WEB SERVICE-BASED VEGETATION CONDITION MONITORING SYSTEM - VEGSCAPE. Zhengwei Yangâ Ç, Genong (Eugene) YuÇ, Liping DiÇ, Bei ZhangÇ, ...
WEB SERVICE-BASED VEGETATION CONDITION MONITORING SYSTEM - VEGSCAPE Zhengwei Yang†ǂ, Genong (Eugene) Yuǂ, Liping Diǂ, Bei Zhangǂ, Weiguo Hanǂ, Rick Mueller† †
ǂ
National Agricultural Statistics Service, USDA, Fairfax, VA 22030, USA Center for Spatial Information Science & Systems, George Mason University, Fairfax, VA 22032, USA ABSTRACT
Timely, frequent, high resolution, fully geospatial covered crop vegetation condition information throughout the season is critical to decision making in both public and private sectors that concern agricultural policy, production, food security, and food prices. This paper presents a new interactive Web service-based vegetation condition monitoring system – VegScape. This system automatically obtains and preprocesses near real-time 250m MODIS daily surface reflectance data for better spatial and temporal resolutions, and generates geospatially various vegetation condition indices for timely crop condition. The VegScape not only offers the online interactive map operations, data dissemination, crop condition statistics, charting and graphing, and comparison analysis, but also provides Web services such on-demand vegetation condition maps and statistics for uses in other applications. This system delivers dynamic user experiences and geospatial crop condition information for decision support with its comprehensive capabilities through standard geospatial Web services in a publicly accessible online environment. Index Terms— VegScape, vegetation condition monitoring, Web service, MODIS, online vegetation analytics 1. INTRODUCTION Crop condition information is critical to decision making in both public and private sectors that concern agricultural policy, production, food security, and food prices. Crop conditions change quickly due to various growing condition changes, such as temperature, soil moisture, fertilization, or disease, etc. Therefore, timely, frequent, fully geospatial covered and sufficiently high resolution observation throughout the season is necessary to monitor crop conditions. The National Agriculture Statistics Services (NASS) of the United States Department of Agricultural (USDA) currently uses a bi-weekly AVHRR normalized difference vegetation index (NDVI) composite provided by the National Oceanic and Atmospheric Administration (NOAA). The AVHRR NDVI maps have been proven valuable in providing a spatially complete view of crop’s
978-1-4799-1114-1/13/$31.00 ©2013 IEEE
vegetation condition. It is especially helpful to manifest some major events in US crop production such as massive flood, drought and long last dry cold winter, which result in drops in corn and soybean acreages and in yields. However, it’s relatively low spatial resolution of 1km (about 250 acres) cannot routinely provide crop specific information because of varying crops in the same region, field size limitations, and alternating crop and fallow field patterns. The bi-weekly AVHRR NDVI composite data cannot meet the timeliness requirement of NASS operations, especially the need of emergency events, which does not follow the regular schedule. Moreover, the current AVHRR based NDVI data are presented in JPEG images with no geocoordinates. They are not easy to navigate and not easy to quantitatively analyze. In this paper, a new interactive Webbased vegetation condition monitoring system named VegScape is presented to automatically fetch and process near real-time remote sensing data from NASA data archive, to generate various vegetation condition indices, to query, visualize, disseminate, and online analyze vegetation condition data geospatially through standard geospatial Web services in a publicly accessible online environment. 2. DATA AND PROCESSING The bi-weekly AVHRR NDVI composite data used by NASS cannot meet (1) the resolution requirement for small size field monitoring; (2) the timeliness requirement of NASS operation, especially the need of emergency event, which does not follow the regular schedule. Therefore, the NASA MODIS 250m resolution, daily surface reflectance data, which provides better spatial and temporal resolutions for more detailed and timely crop specific condition and dynamics, are proposed to replace the AVHRR NDVI in this study. The MODIS surface reflectance data are derived from L1B by applying atmospheric correction algorithm [1]. Both red and near infrared bands in 250 meter resolution are used to derive all vegetation indices for vegetation monitoring. Its Quality Control layer was used to filter out clouds, snows, and other data under quality requirements. Administrative boundaries are Census Tiger Line shapefiles [2]. The VegScape monitoring area covers US lower 48 states. The data processing tasks, such as data correction, denoising, mosaicking, clipping, reprojection, compositing, and index
3638
IGARSS 2013
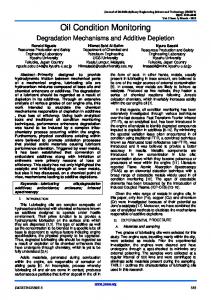
calculation, etc were implemented following the interfaces of Web Processing Service (WPS) for interoperation. The major data processing flow is given as Fig. 1.
sensing data. SOA allows for quick response to new requirements for other geospatial data and assimilates new geospatial data and processing services from service providers [3]. It also provides maximum system scalability for future system augmentation. Open Web standards and OGC geospatial data and processing standards are adopted in this extensible framework to make it accessible,
3. SYSTEM DESIGN A general 3-layer service oriented architecture (SOA) is adopted to process, share and disseminate geospatial remote
Legend MODIS Surface Reflectance (MOD09GQ) Resolution: 250m Bands: Band 1(620-670nm) and 2(841-876nm)
Process
Administrative boundaries (Geographic coordinates, shapefile format)
Data store Interface
WCS
Data
WFS WPS
NDVI: calculating, mosaicking, & clipping
…... (Band2-Band1)/ (Band2+Band1)
NDVI weekly & biweekly: maximum value composite (MVC)
MVCI weekly & biweekly (current-mean)/mean
MVC MVCI weekly
(Band2-Band1)/ (Band2+Band1)
MVCI weekly MVCI weekly
+…+ NDVI
NDVI
(current-mean)/ mean
NDVI weekly composite NDVI weekly composite
Mosaicking & clipping
NDVI weekly composite
MVCI biweekly MVCI biweekly MVCI biweekly NDVI 2010.05.10
NDVI biweekly composite
NDVI2010.04.30
NDVI biweekly composite
NDV 2010.04.29
NDVI biweekly composite
NDVI daily
NDVI weekly
(current-mean)/ mean
NDVI biweekly
MVCI biweekly
WMS
WCS
NDVI (daily, weekly, or biweekly)
MVCI weekly
MVCI (weekly or biweekly)
NDVI (daily, weekly & biweekly)
MVCI (weekly or biweekly)
Figure. 1 VegScape data processing flow chart interoperable, and reusable [4]. This architecture includes application, service and data three layers. The application layer includes various geospatial applications that support standard Web and OGC services; these applications could invoke Web processing services in their own environment. The service layer contains OGC standard compliant Web Feature Service (WFS), Web Map Service (WMS), Web Coverage Service (WCS) and Web geoprocessing services to provide geospatial data and processing services. The Data Layer includes original remote sensing data and their derived data sets, as well as geospatial feature data, which could be accessed directly or indirectly by processing services and application layer. The data in Data Layer are processed and or served by Web services of the Service
Layer. The processed results or data retrieved from the Data Layer are sent back to the clients in the Application Layer. 4. VEGSCAPE IMPLEMENTATION VegScape application implemented a front-end thin client for users to interact with the back-end server and different web services. The system was implemented based on open geospatial specifications, i.e. those specifications from Open Geospatial Consortium Inc. Those specifications include WCS for raster data storage and service, WPS for processing algorithms and their managements, WFS for storing and serving vector geographical features, and WMS
3639
for web-based geospatial presentation. The implementation of the VegScape is described in the following subsections. 4.1. Application Layer In the implementation of VegScape, open source JavaScript libraries, ExtJS and OpenLayers [5], are used to develop an Ajax-powered rich Internet application which can be accessed through most common browsers, for example, Internet Explorer, Firefox, Safari, Opera, and Chrome, without installing any additional software or plug-in. Users, even those who do not have specialized computer skills or GIS experiences, can use this Web application. ExtJS is a free cross-browser JavaScript framework that provides a wide range of user interface components and APIs to build responsive Web applications. OpenLayers offers an Ajaxenabled open source Web mapping framework that supports map layers from OGC WMS and WFS, Geography Markup Language (GML), Google Maps, Yahoo Maps, and Bing Maps, and interacts with these layers through a suite of map controls. 4.2. Service Layer The Service Layer contains open Web geospatial data services and specially developed Web geo-processing services. MapServer [6] deployed in Apache’s Common Gateway Interface (CGI) is used as the server of WFS, WCS, and WMS for its good performance and robustness. In VegScape, a browser client sends (1) a WMS GetMap request to render map layers, including: background layer, Vegetation Condition map layers, political boundary layers and other auxiliary data layers, (2) a WMS GetFeatureInfo request to query the detailed information of specified features, and (3) a WFS GetFeature request to retrieve boundary features in GML. The boundary features are to be displayed and highlighted in the map view. Other operations defined in these OGC standards can also be accessed by users in their applications to interoperate with geospatial data deployed in VegScape. 4.3. Data Layer The data layer includes raster and vector data. The raster data includes all vegetation condition layers, a background map layer, a latest CDL layer and a crop mask layer. The vector data includes different boundary layers, such as region (NASS administrative region), state, ASD, and county boundaries, Water areas, and roads. These data files are served by WMS to provide images for the VegScape client and other geospatial applications, and by WCS and WFS to retrieve vegetation condition data within the AOI. The background map layer, Global Land Cover Data, produced by POSTEL Service Centre from the European Space Agency (ESA) is also served by WMS in VegScape.
The vector data, such as the 2010 TIGER/Line Shapefiles for 48 contiguous states and their counties as well as the District of Columbia, and the ASD boundaries files are served by WMS to provide the images of these vector layers and to define the region of interest for display. 4.4. VegScape Interface The VegScape application user interface (client) was implemented as shown in Fig. 2 and was formally deployed at http://nassgeodata.gmu.edu/VegScape for NASS operation use. The VegScape interface components include data layers, legends, product selection, overview window, map window, and a toolbar. The data layers list all data layers, such as background data layer, crop mask, various boundary layers, water body and lake layer, roads, and the on-the-fly vegetation condition index layer user added. The Legends panel lists legends for all vegetation condition dices. The production selection panel allows user to select different vegetation indices for viewing, analysis and dissemination. The overview window illustrates the overview of the current map view shown in the map window. The map window displays current vegetation condition map overlaid with boundaries and other optional data layers such as road or water layers. The toolbar assembles functional tools for map operation, information query, area of interest selection (importing and exporting), online vegetation condition quantitative analysis and statistics, change analysis, data profiling, automatic PDF format vegetation condition map creation, and data dissemination (downloading and exporting). Overall, the VegScape client allows users to view and analyze geospatially various daily, weekly, bi-weekly, daily vegetation condition indices [7]. The users can perform geospatial queries and manipulate the results interactively. Users can also select and download data products for a given area of interest. 5. CONCLUSION This paper presents design and implementation of a vegetation condition monitoring system – VegScape. The VegScape not only offers the online functionalities of interactive map operations, data dissemination, online crop condition statistics, charting and graphing, and comparison analysis, but also provides Web geoprocessing services such as automatic data delivery and on-demand crop statistics for uses in other applications. This system delivers comprehensive capabilities for near real time analysis, visualization and dissemination of geospatial crop condition information for decision support. The VegScape application proved that the cutting-edge geospatial technology can greatly facilitate remote sensing data accessing and processing, product data querying, visualizing, disseminating, and online analyzing, and will greatly
3640
enhance the user experience for using remote sensing based
vegetation indices for US crop condition monitoring.
Figure 2. VegScape client side (browser) user interface [2] CENSUS, “2010 TIGER/Line Shapefiles Main Page. 2010 Census TIGER/Line® Shapefiles,” Available at: http://www.census.gov/geo/www/tiger/tgrshp2010/tgrshp2010.htm l [Accessed May 3, 2011]. [3] Granell, C., Díaz, D., Gould, M., “Service-oriented applications for environmental models: Reusable geospatial services,” Environmental Modelling and Software, 25(2), pp.182198, February, 2010. [4] Iosifescu-Enescu, I., Hugentobler, M., L. Hurni, “Web cartography with open standards - A solution to cartographic challenges of environmental management,” Environmental Modelling and Software, 25(9), pp.988–999, September, 2010.
Figure 3. VegScape tools
[5] OpenLayers: Free maps for the Web, OpenLayers. http://www.openlayers.org/, [accessed 12 May, 2013].
6. REFERENCES [1] Vermote, Eric F., El Saleous, N.Z. & Justice, Christopher O., “Atmospheric correction of MODIS data in the visible to middle infrared: first results,” Remote Sensing of Environment, Publisher, Location, 83(1-2), pp.97-111, 2002.
[6] Kropla, B., Beginning MapServer: Open Source GIS Development. Apress, Berkley, CA, 448pp, 2005 [7] Yang, Z., Di, L., Yu, G., Chen, Z., “Vegetation Condition Indices for Crop Vegetation Condition Monitoring,” Proc. of IEEE IGARSS 2011, Vancouver, Canada, July 2011.
3641