Abstract. The experimental nuclear reaction database EXFOR contains almost no covariance data because most experimentalists provide experimental data ...
EPJ Web of Conferences 27, 00009 (2012) DOI: 10.1051/epjconf/20122700009 � C Owned by the authors, published by EDP Sciences, 2012
Web Tool for Constructing a Covariance Matrix from kkkkkkkkkkkkm EXFOR Uncertainties V. Zerkin International Atomic Energy Agency, P.O. Box 100, Wagramer Strasse 5, A-1400 Vienna, Austria
Abstract. The experimental nuclear reaction database EXFOR contains almost no covariance data because most experimentalists provide experimental data only with uncertainties. With the tool described here a user can construct an experimental covariance matrix from uncertainties using general assumptions when uncertainty information given in EXFOR is poor (or even absent). The tool is publically available in the IAEA EXFOR Web retrieval system [1].
1 Introduction During the last few years there is a growing interest and usage of covariance data in the nuclear data community. Covariance data in evaluated data files have been available for a very long time, have well-defined formats (ENDF-6) and well developed software tool of different types. The experimental nuclear reaction database EXFOR contains almost no covariance data because most experimentalists provide experimental data only with uncertainties (total, statistical, systematic, partial uncertainties of different types). The tool described here was developed mostly for evaluators who want to construct an ³experimental´ covariance matrix from the uncertainties given in EXFOR. When uncertainty information given in EXFOR is poor or even absent, an evaluator can introduce some assumptions to produce the matrix. The tool is publically available through the Internet as part of the IAEA EXFOR Web retrieval system and can be used remotely. It includes Web plotting and several types of output convenient for users.
2. Setup uncertainties: the user can change (or confirm) existing values of uncertainties, introduce new (additional) uncertainties, e.g. by splitting systematic uncertainties into parts, etc. All these uncertainties can be used in the next step as a component to calculate the fractional covariance matrix. 3. The user defines how to use existing and newly introduced uncertainties for constructing the covariance matrix: correlation type (uncorrelated, fully correlated and partially correlated) and energy intervals. For partially correlated uncertainties the user defines the algorithm of calculation and additional parameters. 4. The user submits the calculation and gets final results as numerical data, data in ENDF-6 format (MF33), EXFOR covariance format, interactive plot and text input for Fortran codes including a subroutine for reading data in a Fortran program.
3 Detailed Description 3.1 EXFOR to C5 Conversion
2 General Approach The procedure for usage of the tools consists of four steps: 1. The tool starts by converting an EXFOR file to computational format ³C5´ (including systematic and statistical uncertainties) and presenting to the user a report with full relevant information: ƒ data points (energy, central values of cross sections) ƒ data uncertainties: total, systematic, statistical ƒ all uncertainties given in the EXFOR file ƒ information from the EXFOR file given in ERRANALYS and METHOD sections.
Translation of an EXFOR file to the computational format C5 LV SHUIRUPHG E\ D -DYD SURJUDP ³[ WRF ´ The format C5 has a similar structure to the C4 format [2] based on ENDF MF/MT definition of reactions, but extended by bibliographical information, systematic and statistical uncertainties. The translation program uses three types of dictionaries: EXFOR dictionaries, X4TOC4 dictionaries and universal X4ENDF dictionary [3]. Approximately 86% of all EXFOR datasets are now converted to C5 (X4TOC4 converts ~56%). 19350 datasets in C5 file have statistical and/or systematic
This is an Open Access article distributed under the terms of the Creative Commons Attribution License 2.0, which permits unrestricted use, distribution, and reproduction in any medium, provided the original work is properly cited.
Article available at http://www.epj-conferences.org or http://dx.doi.org/10.1051/epjconf/20122700009
EPJ Web of Conferences
uncertainties (this is around 15% of all EXFOR datasets). C5 for the full EXFOR database can be easily used for construction of experimental covariance matrices (for example, in large packages like EMPIRE and TALYS) without any further interactive procedures and without any additional assumptions.
For fully correlated data the coefficient of correlation a=1 for all the correlation matrix; for uncorrelated data a=1 for diagonal elements only (rest of elements a=0); for the medium energy range correlations (MERC), the coefficient of correlation a[i,j] is a function of energies E[i], E[j], ³scale type´ DQG ³length of correlation´ ± the last two parameters are defined by the user.
3.2 Algorithms and Parameters 3.2.4 MERC Parameters 3.2.1 Setting up Uncertainties For the calculation of the fractional covariance matrices the user can use uncertainties given in EXFOR, generalized uncertainties calculated in C5 and his own uncertainties. The user can modify values of total, systematic and statistical uncertainties setting them in per-cents of data or by splitting total uncertainties. The user can define his own (artificial) uncertainties setting them either as a fraction of the data or by splitting into parts the total or systematic uncertainties. 3.2.2 Grouping, Energy Intervals, Gaps in Data If the dimension of the final matrix is greater than 100×100, uncertainties are grouped for neighbouring energies. Uncorrelated uncertainties become smaller (square averaging), fully correlated ones remain the same (averaging), total ones are recalculated from systematic and statistical uncertainties. Sometimes EXFOR files have empty fields in the uncertainty columns. In these cases the user defines how to fill in existing gaps. The user can also define energy intervals where a fractional covariance matrix has to be calculated with a given algorithm. This allows, for example, easy construction of fractional covariance matrices if different samples are used for different energy intervals.
The general ideas and algorithms for the calculation of the fractional covariance matrices of MERC type are based on the relevant part of the methodology used in the work under IAEA Coordinated Research Project "Neutron Cross-section Standards" [5]. The two energy dependent parameters are [6]: 1) ³correlation length´ energy range beyond which the correlations between data in two energy ranges disappear 2) ³type of the energy scale´ functional dependence on the difference between energies is defined either in logarithmic or linear scale: ƒ logarithmic scale for energy-energy correlations is more common for time of flight measurements; ƒ linear scale ± mostly for measurements with discrete incident energy beams 3.3 Output Results Finally the user starts the calculation and receives intermediate and final results in the following forms: raw data, data in ENDF-6 (MF33) format, EXFOR covariance section, interactive 2D/3D plot and data formatted for input to a Fortran program including an example of Fortran code with a subroutine for reading energy grid and correlation matrix. Intermediate results present all the steps of the calculation: covariance matrix, variances, Gaussian matrix and test for positive definiteness of the final matrix.
3.2.3 Types of Correlations Three types of data correlations are available in the tool corresponding to the classification given in [4]: ƒ uncorrelated data (short energy range correlations SERC); example: statistical uncertainties. ƒ fully correlated data (long energy range correlations LERC); example: uncertainties in the determination of the mass of the sample. ƒ partially correlated data (medium energy range correlations - MERC); example: detector efficiency. In the Web tool, all three types of correlations can be used for energy intervals for calculations. The fractional covariance matrix is calculated by: Cov[i,j] = a[i,j] × Err[i] × Err[j] where: Cov[i,j] a[i,j] Err[i]
± element of the matrix ± coefficient of correlation ± relative uncertainty of given type for given energy E[i]
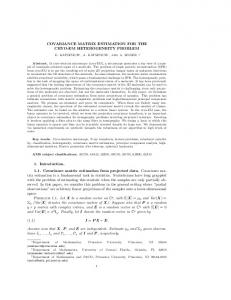
4 Example and Test The test case below presents the experimental energyenergy correlation matrix for the 241Am(n,2n) reaction cross section from EXFOR Entry#23114 [7-8] in comparison with a matrix constructed from uncertainties given in the same Entry. Fig. 1 shows the result of the construction using only statistical and systematic uncertainties given in C5. The large difference between the constructed and the original matrix is clearly visible. Fig. 2 shows the result of construction done with very general assumptions: using statistical uncertainties as given in C5, and splitting systematic uncertainties 50/50 to (a) fully correlated and (b) MERC correlated uncertainties ZLWK SDUDPHWHUV ³FRUUHOation VFDOH´ OLQHDU ³FRUUHODWLRQ OHQJWK´ RI WKH ZKROH HQHUJ\ UDQJH RI this experiment (~6MeV).
00009-p.2
Incident Energy (MeV)
2nd Workshop on Neutron Cross Section Covariances
20
Levels 1 0.9 0.8 0.5 0.2 0
10 10
20 10 20 Incident Energy (MeV) E, MeV Original matrix, % Constructed matrix, % 20.61 20 22 29 30 40 42 39 65 100 49 54 64 68 72 73 49 74 100 19.95 30 34 44 45 58 59 51 100 62 69 81 86 91 93 62 100 19.36 21 24 30 31 39 39 100 41 46 54 57 60 61 100 17.90 41 45 57 59 84 100 61 68 80 85 90 100 17.16 40 45 57 58 100 60 67 79 84 100 16.10 38 43 53 100 57 63 75 100 13.33 37 42 100 54 60 100 9.15 35 100 46 100 8.34 100 100
Incident Energy (MeV)
Fig. 1. Experimental (left) and constructed correlation matrices using only C5 (right). 20
E, MeV 20.61 19.95 19.36 17.90 17.16 16.10 13.33 9.15 8.34
References 1.
Levels 1 0.9 0.8 0.5 0.2 0
10 10
20 10 Incident Energy (MeV)
Original matrix, % 20 22 29 30 40 42 39 65 100 30 34 44 45 58 59 51 100 21 24 30 31 39 39 100 41 45 57 59 84 100 40 45 57 58 100 38 43 53 100 37 42 100 35 100 100
The visualization part of the tool can help to make all of the processes more understandable and transparent. Employing such a tool can increase understanding and formulation of recipes for constructing covariance matrices based on providing partial errors and correlation components. It can also help in the development of the EXFOR format via formalization of parameters from these recipes. Such a tool may be the only practical way to construct covariance matrices for old data stored in the EXFOR database. It can be useful after discussion and testing by experienced experimentalists and evaluators. But even for new data coming to the EXFOR database, until the partial uncertainties can be described in detail and covariance data routinely accompany most of experimental results, such a tool can be very useful as well.
2. 3. 4.
20
5.
Constructed matrix, % 24 27 32 43 51 57 44 70 100 31 35 41 59 70 77 59 100 20 23 27 42 49 54 100 31 34 50 73 84 100 30 33 54 76 100 28 32 58 100 32 39 100 43 100 100 Red: difference >10%
Fig. 2. Experimental (left) and constructed correlation matrices using interactive procedures (right).
6. 7. 8.
Comparing Figs. 1 and 2, it can be seen that applying the interactive tool even with very general assumptions can produce a correlation matrix very similar to the original matrix provided by experimentalists ± which is a result of a very careful analysis and calculations considering all the components of correlation.
5 Discussion and Conclusion The Web tool has two parts: translation of EXFOR files to C5 and interactive construction of a correlation matrix. The first part allows construction of a rough estimation of the covariance matrix on the basis of statistical and systematic uncertainties without any assumptions, and it can be directly used by some program packages. Although this part does not use additional knowledge about specific partial uncertainties, it leads to significant progress in covariance data. The second (interactive) part of the tool relies on the experience of evaluators and their assumptions about correlations. This part is intuitive and therefore subjective. It can help in individual evaluations, but probably not as a routine part in large packages.
00009-p.3
IAEA Nuclear Data Services, EXFOR Web Retrieval System: http://www-nds.iaea.org/exfor/ D.E. Cullen, A. Trkov, Program X4TOC4, Report IAEA-NDS-80, Rev.1 (March 2001) V.Pronyaev, Priv.Comm. (2007) ENDF-6 Formats Manual. CSEWG Document ENDF-102. Report BNL-90365-2009 (2009) 249 V.G. Pronyaev, S.A. Badikov, A.D. Carlson, Chen Zhenpeng, E.V. Gai, G.M. Hale, F.-J. Hambsch, H.M. Hofmann, T. Kawano, N.M. Larson, D.L. Smith, Soo-Youl Oh, S. Tagesen, H. Vonach, International Evaluation of Neutron Cross-Section Standards, STI/PUB/1291 (IAEA, 2007) 10 V.Pronyaev, Priv.Comm. (2010) http://www-nds.iaea.org/EXFOR/23114 C.Sage, V.Semkova, O.Bouland, P.Dessagne, A.Fernandez, F.Gunsing, C.Nastren, G.Noguere, H.Ottmar, A.J.M.Plompen, P.Romain, G.Rudolf, J.Somers, F.Wastin, Phys. Rev. C81, (2010) 064604