1588
JOURNAL OF ATMOSPHERIC AND OCEANIC TECHNOLOGY
VOLUME 22
What Observation Scheme Should We Use for Profiling Floats to Achieve the Argo Goal for Salinity Measurement Accuracy? Suggestions from Software Calibration TAIYO KOBAYASHI
AND
SHINYA MINATO
Institute of Observational Research for Global Change, Japan Agency for Marine–Earth Science and Technology, Yokosuka, Japan (Manuscript received 5 November 2004, in final form 20 February 2005) ABSTRACT To meet the Argo Project’s accuracy goal for salinity measurements (⫾0.01), several measurement schemes for profiling float observations were examined using the standard Argo software calibration for salinity. In this study, salinity calibration errors are evaluated in data series observed by employing several different measurement schemes. In the North Pacific the accuracy goal can be achieved by programming for constant measurements to a depth of 1500 db or more; however, measurements in the mixed water region require the adoption of a scheme that constantly measures salinity profiles to the marginal capability depth of floats (e.g., 2000 db), so that calibration errors can be minimized. In contrast, in the tropical regions of the Pacific and eastern Indian Ocean, 1000-db profiles provide salinity data of sufficient quality. When floats use a Park and Profile scheme, it is recommended that they be programmed to measure deeper profiles every observation cycle. Otherwise, it is impossible to detect and correct suspicious data, such as a salinity jump in which a salinity measurement suddenly differs from previous measurements by ⫾0.02–0.03 or more.
1. Introduction The international Argo Project was launched in 2000 (Argo Science Team 2001); as part of this project, roughly 3000 profiling floats are to be deployed in an effort to construct a real-time monitoring system of the upper open ocean. The expected lifetime of an Argo float is about four years, during which time the floats receive no maintenance. Therefore, salinity measurements may be subject to sensor drift or offset owing to problems such as measuring cell contamination (e.g., Oka and Ando 2004; Oka 2005), biofouling (e.g., Freeland 1997), and biocide washout (S. Riser and D. Swift 2001, personal communication). Thus, the goal of the Argo Project in regard to the accuracy of salinity measurements, which is ⫾0.01 (Argo Science Team 2000), constitutes a challenge. Unlike traditional shipboard conductivity–temperature–depth (CTD) measurements, true salinity data cannot be obtained to cali-
Corresponding author address: Dr. Taiyo Kobayashi, Institute of Observational Research for Global Change, Japan Agency for Marine–Earth Science and Technology, 2-15, Natsushima-cho, Yokosuka, Kanagawa 237-0061, Japan. E-mail:
[email protected]
© 2005 American Meteorological Society
JTECH1798
brate float sensors. Some floats have been recovered while in operation, and their sensors have been postcalibrated in the laboratory (e.g., S. Riser and D. Swift 2001, personal communication; Oka and Ando 2004; Oka 2005), but such cases have been relatively rare. To evaluate and correct the salinity data measured by floats, one of the most realistic methods involves comparing float measurements with local deep-layer ocean climatology data. Float conductivity sensors degrade on time scales of months or weeks, which is more rapid than the changes experienced in the deep-layer salinity structure. Several organizations have worked on developing applicable software calibration methods (e.g., Feng and Wijffels 2002; Kobayashi et al. 2002). At the Pacific Marine Environment Laboratory of the National Oceanic and Atmospheric Administration (NOAA), Wong et al. (2003) developed a software calibration method that uses an objective mapping technique. This method, referred to hereafter as WJO QC, was adopted as the standard method for delayed-mode quality control of the Argo Project at the Argo Data Management Third Meeting, in September 2002 (Argo Data Management Team 2002), because WJO QC has been confirmed as having the potential to achieve the level of accuracy required by the Argo Project (Kobayashi and Minato 2005).
OCTOBER 2005
KOBAYASHI AND MINATO
The Argo Project community agreed that temperature/salinity profiles should be measured to a depth of 2000 db, which allows for data quality evaluation by comparisons with deep-layer local climatology (Argo Science Team 2000). However, many of the floats that are presently deployed have profile depths shallower than 2000 db. Most of these floats have insufficient buoyancy to rise to the sea surface from 2000 db, especially those in tropical regions. Recent advances in the development of the project have led to an innovatory float observation scheme known as Park and Profile (PnP). With the PnP scheme, a float remains at a preset, shallow “parking” depth (e.g., 1000 db) then dives to greater depths (e.g., 2000 db) to measure temperature/salinity profiles (Argo Science Team 2003). This scheme is currently used widely as the Argo standard, and benefits the Project primarily by reducing unexpected problems caused by the mechanical movements of floats under high pressure. In fact, it is reported that the motor-backspin problem, one of the most serious problems for Apex type floats, has not been an issue with floats using the PnP scheme (Argo Science Team 2003). The PnP scheme controls float movements in the ocean more sophisticatedly, such as by periodically skipping deeper layer measurements. Some of the recently deployed floats are programmed with the PnP scheme to dive to 2000-db depths every four observation cycles (PnP N ⫽ 4). It is difficult to change the measuring scheme for profiling floats once a float has been deployed. If a conductivity sensor experiences salinity offset or drift during operation, a final rescue of the salinity data is performed using software calibration, that is, Argo delayed-mode quality control such as WJO QC. Thus, the observation scheme of Argo floats should be carefully determined in order to obtain salinity data of sufficient quality, taking into consideration Argo delayed-mode quality control. This study examined the performance of the software calibration for salinity data observed using several different observation schemes for Argo floats in the Pacific. Based on these results, we suggest guidelines for float observation schemes to achieve salinity data of the quality sought in the Argo Project. As a practice, principle investigators should determine measurement schemes for float observations after taking the necessary factors into account to achieve their purposes. This study shows that software calibration for salinity is an important factor that controls the magnitude of errors in salinity observations.
1589
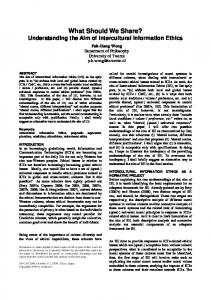
FIG. 1. Schematic figures of the float operations with the observation schemes of (a) constant 2000, (b) 1500, and (c) 1000 db, and (d) PnP N ⫽ 4. Note that the schemes of constant depth measurements can be performed by the PnP scheme, as is shown by dashed lines.
2. Experiments For this study, we prepared several types of salinity data series from the actual data series of floats, which were “observed” under different observation schemes. The floats were selected from those deployed by the Japan Agency for Marine–Earth Science and Technology (JAMSTEC) using the following criteria. 1) Most of the floats’ profiles extended to a depth of 2000 db. 2) The observation cycle was a constant 10 days, throughout the float’s operation. 3) The float had measured at least 30 profiles. The data series actually measured are considered to be the data measured using a constant 2000-db measurement scheme. The data series measured with constant 1500- and 1000-db schemes are produced from the actual data series by subsampling, that is, by removing the deeper layers of each profile. The performance of the PnP N ⫽ 4 scheme is also examined. A float using this scheme measures the 2000-db profile every four cycles, and the profiles of the other cycles are limited to 1000-db depth. Schematic figures of these measurement schemes are shown in Fig. 1. Note that all of the constant depth measurement schemes are performed using the PnP scheme (i.e., PnP N ⫽ 1). Also examined is the performance of software calibration for only the deeper profiles of the PnP N ⫽ 4 scheme. To summarize, this study evaluates the performances of the above four measurement schemes (i.e., constant 2000-, 1500-, and 1000-db, and PnP N ⫽ 4 schemes) and an additional experiment for the PnP N ⫽ 4 scheme, by comparing the results of the software calibration using WJO QC.
1590
JOURNAL OF ATMOSPHERIC AND OCEANIC TECHNOLOGY
VOLUME 22
TABLE 1. Floats examined in the present study. The floats marked with an asterisk (*) are deployed in relatively less variable oceanic conditions than the western regions of MWR, because it is farther from the confluence of the Kuroshio and Oyashio. Measurement locations WMO ID
Lat
Lon
Total profiles
Region
29043 29044 29045 29049 29051 29052 29053 29054 2900055 2900056 2900057 2900177 2900181 2900184 2900185 2900187 2900188* 2900191 2900212* 2900215 2900217 2900219 2900220* 2900221* 2900254 2900288 2900289 3900123 3900124 3900125 3900126 3900127 4900295 5900152 5900165 5900167 5900171 5900173 5900175 5900229 5900294 5900305 5900378 5900387 5900391 5900392 5900393 5900396
32.4°–38.5°N 32.0°–38.2°N 33.1°–39.0°N 31.8°–37.7°N 29.7°–36.3°N 27.1°–29.8°N 28.1°–30.1°N 27.3°–29.2°N 37.8°–47.8°N 43.2°–46.8°N 42.0°–43.3°N 42.4°–47.0°N 8.0°–11.0°N 16.9°–19.8°N 15.0°–17.5°N 41.8°–44.4°N 37.0°–44.9°N 7.1°S–0.1°N 38.3°–46.5°N 36.9°–45.6°N 42.6°–43.7°N 30.4°–35.5°N 37.2°–42.0°N 36.8°–42.5°N 32.1°–41.1°N 49.1°–51.3°N 46.1°–48.6°N 32.7°–32.0°S 33.5°–32.6°S 32.6°–32.0°S 32.7°–31.9°S 33.1°–32.4°S 45.4°–46.4°N 28.3°–35.2°N 5.7°–4.0°S 10.2°–5.7°S 22.0°–26.1°N 20.2°–24.7°N 22.5°–25.7°N 3.8°–2.0°S 21.6°–24.0°N 24.8°–27.6°N 19.1°–21.8°N 34.1°–32.3°S 32.8°–30.6°S 33.8°–32.5°S 33.4°–32.4°S 33.3°–31.7°S
144.9°–161.4°E 142.3°–150.7°E 141.8°–160.6°E 145.2°–152.5°E 141.0°–146.2°E 142.7°–148.0°E 143.1°–147.9°E 148.3°–152.4°E 165.6°E–177.1°W 165.2°–171.1°E 163.4°–165.8°E 165.0°–173.6°E 152.5°–165.2°E 132.4°–138.5°E 127.3°–137.0°E 165.0°–170.0°E 165.1°–173.4°E 175.5°–170.2°W 161.2°E–161.6°W 170.3°–176.8°E 176.3°E–176.4°W 160.7°–171.1°E 164.8°E–168.9°W 164.3°–179.5°E 150.7°–160.1°E 162.6°–167.0°E 164.9°–167.1°E 118.3°–117.0°W 111.8°–109.0°W 106.3°–104.8°W 99.9°–98.3°W 94.1°–93.3°W 165.0°–159.5°W 150.1°–156.7°E 89.0°–91.5°E 92.9°–97.1°E 132.0°–138.4°E 128.2°–136.9°E 132.0°–137.0°E 85.6°–91.5°E 165.1°–170.9°E 171.5°–166.1°W 165.2°–167.7°E 171.8°–169.4°W 154.1°–152.2°W 148.5°–147.7°W 142.5°–141.7°W 124.7°–123.0°W
74 75 84 94 90 70 49 53 114 73 44 63 82 81 66 34 73 80 74 75 75 74 74 74 53 39 39 30 30 30 30 30 73 93 39 73 78 81 74 72 55 54 42 34 33 33 31 31
Mixed water region Mixed water region Mixed water region Mixed water region Subtropical north Subtropical north Subtropical north Subtropical north Subarctic Subarctic Subarctic Subarctic Tropical Subtropical north Subtropical north Subarctic Mixed water region Tropical Mixed water region Subarctic Subarctic Subtropical north Mixed water region Mixed water region Mixed water region Subarctic Subarctic Subtropical south Subtropical south Subtropical south Subtropical south Subtropical south Subarctic Mixed water region Eastern tropical Indian Eastern tropical Indian Subtropical north Subtropical north Subtropical north Eastern tropical Indian Subtropical north Subtropical north Subtropical north Subtropical south Subtropical south Subtropical south Subtropical south Subtropical south
Table 1 summarizes the data from the 48 floats examined in this study. The measurement locations of the floats are summarized in Fig. 2. To examine regional differences, the floats are sorted into six groups: subtropical North Pacific, subarctic North Pacific, mixed
water region (MWR), tropical Pacific, subtropical South Pacific, and eastern tropical Indian Ocean. The results of salinity calibration using WJO QC depend largely on the reference dataset (Kobayashi and Minato 2005). In this study, we used the Selected Hy-
OCTOBER 2005
KOBAYASHI AND MINATO
1591
FIG. 2. Distribution of measurement locations for floats examined in the present study. The orange, blue, light-blue, red, purple, and green colors represent floats classified into the subtropical North Pacific, subarctic North Pacific, mixed water region, tropical Pacific, subtropical South Pacific, and eastern tropical Indian Ocean, respectively.
drographic Dataset version 1.0 (Kobayashi 2004) for the Pacific, and the Indian Ocean HydroBase (Kobayashi and Suga 2005) for the Indian Ocean. Both datasets are in use for Argo delayed-mode quality control at JAMSTEC. The parameters and values of the WJO QC system used in this study are shown in Table 2, and are the same as those used by Kobayashi and Minato (2005).
3. Results As discussed in Kobayashi and Minato (2005), preferable results of salinity calibration by WJO QC should satisfy the following conditions. 1) The optimal values of calibrated salinity agree with true values within calibration errors. 2) Calibration errors are minimized. The criterion is TABLE 2. Parameters used for the WJO QC (Oct 2002 version) in this study. Parameter Large spatial scale Small spatial scale Maximum of data selected Number of profiles for the least squares fit
Zonal Meridional Zonal Meridional
Values
Notes
20° 10° 8° 4° 600 9
Default Default Default Default Default Default (2k ⫹ 1, k ⫽ 4)
⫾0.01, which constitutes the goal of the Argo Project for salinity measurement accuracy. This study focused on the second criterion, and holds that salinity calibrations with smaller errors are preferable to those with larger errors, as the accuracy (or reliability) of float salinity data depends, mainly, on the magnitude of resultant calibration errors. In cases with large calibration errors (i.e., ⫾0.02 or more), the measured values will fall within the range of calibrated values. It is very difficult to detect the salinity bias of float measurements, even when that bias exceeds ⫾0.01 (see Kobayashi and Minato 2005). This study did not evaluate the results in relation to the first criterion, except for cases in which float salinity obviously deviated from the true value. While the agreement of calibrated salinity with true values is very important for Argo delayed-mode quality control, this is beyond the scope of the present study, as it is very difficult for many floats operating in midocean to obtain true salinity values, such as shipboard CTD measurements nearby float observations. The following subsections detail the representative results for the six regions examined in this study.
a. Subtropical North Pacific As expected, the magnitude of calibration errors increases as the profile depth diminishes [Fig. 3; World
1592
JOURNAL OF ATMOSPHERIC AND OCEANIC TECHNOLOGY
VOLUME 22
FIG. 3. The calibration results for float WMO ID 5900175, deployed in the subtropical North Pacific. (a) Float observation locations with historical stations for reference (dots). The results of salinity calibration with the (b) constant 2000-, (c) 1500-, (d) 1000-db, and (e) PnP N ⫽ 4 observation schemes. (f) The results derived just from series of deeper profiles of PnP N ⫽ 4. The black lines with asterisks represent measured salinities interpolated on each reference potential temperature. The gray belts represent the calibrated salinity; widths show the calibration errors. The gray lines with bars represent climatological references and their mapping errors estimated by WJO QC. Asterisks marked with circles in (e) represent measurements to the 2000-db depth. The values in the lowerright-hand corner of each panel show the resultant calibration errors of salinity for average, maximum, and minimum, respectively.
Meteorological Organization buoy identification number (WMO ID) 5900175]. The average calibration error varies from ⫾0.005 for the constant 2000-db scheme to ⫾0.007 and ⫾0.012 for the constant 1500- and 1000-db
schemes, respectively (Table 3). When the profiling floats use the PnP N ⫽ 4 scheme, the average calibration error is ⫾0.007, the same as that of the constant 1500-db measurement scheme.
OCTOBER 2005
1593
KOBAYASHI AND MINATO
TABLE 3. Summary of the calibrated salinity errors, using the method of Wong et al. (2003). Floats marked with an asterisk (*) in the mixed water region are deployed in less variable regions, farther from the confluence of the Kuroshio and Oyashio.
WMO ID
Constant 2000 db
Constant 1500 db
Constant 1000 db
Park and Profile (PnP) N ⫽ 4
Only deeper profiles of PnP N ⫽ 4
Average (min–max)
Average (min–max)
Average (min–max)
Average (min–max)
Average (min–max)
29051 29052 29053 29054 2900184 2900185 2900219 5900171 5900173 5900175 5900294 5900305 5900378
0.0053 0.0061 0.0060 0.0081 0.0035 0.0033 0.0065 0.0054 0.0046 0.0053 0.0064 0.0052 0.0060
(0.0021–0.0073) (0.0052–0.0072) (0.0051–0.0070) (0.0071–0.0095) (0.0028–0.0050) (0.0026–0.0041) (0.0056–0.0079) (0.0046–0.0066) (0.0037–0.0058) (0.0048–0.0067) (0.0054–0.0087) (0.0031–0.0071) (0.0055–0.0068)
0.0092 0.0088 0.0089 0.0109 0.0049 0.0051 0.0089 0.0074 0.0061 0.0074 0.0091 0.0084 0.0091
2900055 2900056 2900057 2900177 2900187 2900215 2900217 2900288 2900289 4900295
0.0058 0.0060 0.0067 0.0055 0.0065 0.0065 0.0061 0.0068 0.0055 0.0049
(0.0043–0.0083) (0.0048–0.0069) (0.0057–0.0080) (0.0048–0.0067) (0.0058–0.0075) (0.0050–0.0082) (0.0053–0.0072) (0.0055–0.0085) (0.0050–0.0068) (0.0044–0.0053)
0.0086 0.0085 0.0097 0.0089 0.0099 0.0094 0.0095 0.0096 0.0084 0.0060
29043 29044 29045 29049 2900188 2900212 2900220 2900221 2900254 5900152
0.0142 0.0113 0.0109 0.0139 0.0078 0.0061 0.0063 0.0067 0.0166 0.0127
(0.0074–0.0245) (0.0020–0.0183) (0.0013–0.0182) (0.0070–0.0198) (0.0060–0.0107) (0.0048–0.0125) (0.0048–0.0073) (0.0058–0.0079) (0.0107–0.0244) (0.0086–0.0221)
0.0196 0.0181 0.0160 0.0217 0.0107 0.0084 0.0087 0.0099 0.0238 0.0187
2900181 2900191
0.0036 (0.0025–0.0045) 0.0053 0.0045 (0.0028–0.0058) 0.0059
3900123 3900124 3900125 3900126 3900127 5900387 5900391 5900392 5900393 5900396
0.0023 0.0027 0.0025 0.0025 0.0031 0.0033 0.0028 0.0026 0.0030 0.0026
5900165 5900167 5900229
0.0044 (0.0040–0.0048) 0.0067 0.0033 (0.0029–0.0040) 0.0056 0.0055 (0.0045–0.0065) 0.0079
(0.0022–0.0025) (0.0024–0.0032) (0.0023–0.0027) (0.0024–0.0030) (0.0030–0.0034) (0.0030–0.0039) (0.0024–0.0037) (0.0024–0.0030) (0.0025–0.0033) (0.0023–0.0030)
0.0043 0.0062 0.0060 0.0061 0.0074 0.0060 0.0049 0.0045 0.0045 0.0046
(0.0027–0.0136) (0.0074–0.0112) (0.0076–0.0098) (0.0098–0.0125) (0.0041–0.0076) (0.0042–0.0064) (0.0074–0.0117) (0.0064–0.0101) (0.0047–0.0079) (0.0066–0.0101) (0.0076–0.0124) (0.0052–0.0112) (0.0083–0.0104)
0.0219 (0.0042–0.0337) 0.0167 (0.0114–0.0201) 0.0170 (0.0130–0.0197) 0.0184 (0.0160–0.0201) 0.0085 (0.0069–0.0111) 0.0094 (0.0077–0.0117) 0.0185 (0.0128–0.0333) 0.0122 (0.0100–0.0189) 0.0092 (0.0070–0.0114) 0.0119 (0.0096–0.0188) 0.0136 (0.0115–0.0179) 0.0152 (0.0128–0.0178) 0.0141 (0.0131–0.0154) Subarctic (0.0071–0.0110) 0.0203 (0.0106–0.0345) (0.0077–0.0109) 0.0186 (0.0125–0.0323) (0.0084–0.0116) 0.0213 (0.0150–0.0307) (0.0071–0.0156) 0.0171 (0.0106–0.0329) (0.0088–0.0136) 0.0206 (0.0172–0.0243) (0.0070–0.0120) 0.0295 (0.0175–0.0618) (0.0082–0.0112) 0.0221 (0.0169–0.0268) (0.0070–0.0126) 0.0193 (0.0137–0.0310) (0.0074–0.0103) 0.0143 (0.0107–0.0211) (0.0053–0.0071) 0.0104 (0.0089–0.0125) Mixed water region (0.0099–0.0288) 0.0449 (0.0240–0.0703) (0.0026–0.0290) 0.0438 (0.0045–0.0779) (0.0015–0.0289) 0.0349 (0.0010–0.0607) (0.0121–0.0288) 0.0486 (0.0342–0.0713) (0.0084–0.0137) 0.0275 (0.0186–0.0384) (0.0062–0.0150) 0.0192 (0.0113–0.0453) (0.0063–0.0102) 0.0246 (0.0182–0.0381) (0.0086–0.0116) 0.0292 (0.0239–0.0353) (0.0142–0.0317) 0.0592 (0.0364–0.0873) (0.0116–0.0385) 0.0357 (0.0223–0.0540) Tropical (0.0035–0.0067) 0.0081 (0.0043–0.0104) (0.0032–0.0077) 0.0075 (0.0039–0.0097) Subtropical south (0.0039–0.0048) 0.0091 (0.0088–0.0097) (0.0046–0.0070) 0.0118 (0.0109–0.0124) (0.0058–0.0063) 0.0101 (0.0092–0.0109) (0.0055–0.0075) 0.0111 (0.0103–0.0132) (0.0060–0.0084) 0.0133 (0.0117–0.0144) (0.0054–0.0069) 0.0135 (0.0125–0.0151) (0.0043–0.0059) 0.0091 (0.0083–0.0104) (0.0041–0.0051) 0.0081 (0.0075–0.0088) (0.0041–0.0048) 0.0086 (0.0080–0.0091) (0.0042–0.0057) 0.0093 (0.0090–0.0101) Eastern tropical Indian Ocean (0.0064–0.0077) 0.0083 (0.0078–0.0089) (0.0050–0.0067) 0.0070 (0.0061–0.0085) (0.0068–0.0091) 0.0100 (0.0086–0.0114)
0.0076 0.0084 0.0081 0.0108 0.0046 0.0046 0.0090 0.0073 0.0060 0.0073 0.0086 0.0072 0.0080
(0.0032–0.0132) (0.0064–0.0104) (0.0059–0.0096) (0.0087–0.0130) (0.0037–0.0059) (0.0033–0.0063) (0.0071–0.0126) (0.0057–0.0100) (0.0044–0.0077) (0.0061–0.0099) (0.0062–0.0125) (0.0036–0.0103) (0.0066–0.0097)
0.0045 0.0061 0.0061 0.0081 0.0035 0.0035 0.0061 0.0054 0.0042 0.0054 0.0065 0.0053 0.0060
(0.0036–0.0071) (0.0054–0.0077) (0.0054–0.0075) (0.0076–0.0091) (0.0032–0.0043) (0.0028–0.0051) (0.0053–0.0075) (0.0047–0.0065) (0.0038–0.0048) (0.0049–0.0060) (0.0056–0.0087) (0.0039–0.0085) (0.0057–0.0068)
0.0088 0.0089 0.0106 0.0080 0.0096 0.0099 0.0093 0.0101 0.0079 0.0068
(0.0059–0.0150) (0.0064–0.0115) (0.0078–0.0193) (0.0062–0.0103) (0.0080–0.0130) (0.0066–0.0170) (0.0073–0.0120) (0.0073–0.0143) (0.0062–0.0122) (0.0056–0.0081)
0.0054 0.0058 0.0068 0.0054 0.0065 0.0064 0.0064 0.0066 0.0054 0.0051
(0.0036–0.0097) (0.0053–0.0066) (0.0058–0.0079) (0.0047–0.0067) (0.0060–0.0072) (0.0047–0.0097) (0.0054–0.0082) (0.0053–0.0083) (0.0050–0.0063) (0.0045–0.0060)
0.0202 0.0167 0.0164 0.0199 0.0114 0.0092 0.0095 0.0101 0.0248 0.0175
(0.0099–0.0323) (0.0027–0.0341) (0.0021–0.0362) (0.0105–0.0321) (0.0050–0.0152) (0.0063–0.0167) (0.0069–0.0119) (0.0071–0.0132) (0.0132–0.0342) (0.0105–0.0293)
0.0130 0.0081 0.0067 0.0113 0.0076 0.0054 0.0057 0.0064 0.0157 0.0130
(0.0089–0.0219) (0.0025–0.0138) (0.0002–0.0157) (0.0104–0.0125) (0.0054–0.0120) (0.0033–0.0093) (0.0040–0.0087) (0.0046–0.0094) (0.0109–0.0255) (0.0096–0.0222)
0.0047 (0.0030–0.0063) 0.0036 (0.0028–0.0053) 0.0057 (0.0031–0.0100) 0.0044 (0.0036–0.0063) 0.0032 0.0036 0.0036 0.0035 0.0044 0.0044 0.0037 0.0037 0.0042 0.0036
(0.0026–0.0053) (0.0027–0.0067) (0.0028–0.0055) (0.0028–0.0064) (0.0036–0.0072) (0.0034–0.0083) (0.0029–0.0047) (0.0028–0.0043) (0.0029–0.0050) (0.0027–0.0044)
0.0023 0.0026 0.0025 0.0024 0.0031 0.0032 0.0028 0.0027 0.0030 0.0026
(0.0022–0.0025) (0.0025–0.0027) (0.0024–0.0027) (0.0024–0.0025) (0.0030–0.0033) (0.0030–0.0036) (0.0025–0.0035) (0.0026–0.0029) (0.0027–0.0035) (0.0025–0.0028)
0.0057 (0.0049–0.0081) 0.0044 (0.0042–0.0046) 0.0044 (0.0035–0.0061) 0.0035 (0.0030–0.0042) 0.0069 (0.0052–0.0100) 0.0054 (0.0050–0.0059)
1594
JOURNAL OF ATMOSPHERIC AND OCEANIC TECHNOLOGY
VOLUME 22
FIG. 4. The results for float WMO ID 2900288 in the subarctic North Pacific (otherwise, as for Fig. 3).
b. Subarctic North Pacific Results for the subarctic region show the same trend as that of the subtropical region (Fig. 4; WMO ID 2900288). When the deeper layers are removed from float profiles, calibration error increases to ⫾0.007, ⫾0.010, and ⫾0.019 for the 2000-, 1500-, and 1000-db cases, respectively (see Table 3). On average, the results of the PnP N ⫽ 4 scheme are almost identical to those of the constant 1500-db scheme. The quality of subarctic salinity data seems more de-
graded than that of subtropical data when profiles diminish. Owing to temperature inversion in the subarctic region, WJO QC estimates climatological references with relatively large mapping errors for reference temperatures warmer than the temperature maximum (about 3°–4°C; Kobayashi and Minato 2005). Thus, the temperature range in which WJO QC works effectively is limited to a range colder than about 3°C. The 3°C isotherm is at about 800–1200 db in the North Pacific subarctic. Thus, the lack of deeper data further degrades the calibration results in the subarctic region.
OCTOBER 2005
KOBAYASHI AND MINATO
1595
FIG. 5. The results for float WMO ID 29043 in the mixed water region (otherwise, as for Fig. 3).
c. MWR The MWR is well known as a region with large variability in water mass structure (Fig. 5; WMO ID 29043). Reflecting these oceanic conditions, calibration results for the MWR are inferior to those in the subtropical or subarctic regions. When floats measure 2000-db profiles in the MWR constantly, the average calibration error is ⫾0.014 (the maximum exceeds ⫾0.02), which does not meet the Argo accuracy goal for salinity measurements. As the profile depth decreases, the results degrade. When measurements are limited to 1500-db
depth, the average error is about ⫾0.02. This means that the float salinity data are similar or slightly superior to the expendable conductivity–temperature–depth instrument (XCTD) measurements, which have a salinity measurement accuracy of about ⫾0.02–0.04 (Mizuno and Watanabe 1998). When profiling floats observe only layers above 1000 db in the MWR, the average error is ⫾0.045. This means that it cannot be determined which floats are yielding suspicious salinity profiles unless the conductivity sensor is damaged to the extent of showing a salinity bias of about ⫾0.05 or more. Thus, for the MWR observations, it is advisable
1596
JOURNAL OF ATMOSPHERIC AND OCEANIC TECHNOLOGY
VOLUME 22
FIG. 6. The results for float WMO ID 2900181 in the tropical Pacific (otherwise, as for Fig. 3).
to use profiling floats that are programmed to measure temperature/salinity profiles to their marginal capability depth (e.g., 2000 db) in every observation cycle.
d. Tropical Pacific For the tropical Pacific Ocean observations, the salinity calibration trend resembles those of the three previous cases: the shallower the profile depth, the larger the calibration errors (Fig. 6; WMO ID 2900181). However, the accuracy of salinity data here is maintained within ⫾0.01, even for 1000-db depth measurements.
This is a very positive result, as it shows that in this region current profiling floats meet the Argo goal for salinity measurement accuracy. There is little geographical variation in the structure of the water mass in the tropical Pacific. Climatological references for salinity calibration can therefore be estimated with smaller mapping errors, even in the relatively warm range around 5°–10°C. Consequently, the temperature range in which WJO QC works effectively may be expanded, and the accuracy of salinity calibration enhanced.
OCTOBER 2005
KOBAYASHI AND MINATO
1597
FIG. 7. The results for float WMO ID 5900392 in the subtropical South Pacific (otherwise, as for Fig. 3).
e. Subtropical South Pacific Floats deployed in the subtropical South Pacific show a trend with respect to salinity calibration results that is fairly similar to that of the above cases (Fig. 7; WMO ID 5900392). However, unexpected results have been found in these experiments: the error found in the software-calibrated salinity is about ⫾0.003 in the case of a constant 2000-db scheme. This is far superior to the results obtained for the subtropical North Pacific. The South Pacific is a region for which salinity data
of sufficient quality are least expected, as there are very few historical observations for this region (see Fig. 7a). It is possible that the positive results noted above are owing to the fact that most of the reference data in this region were observed during the World Ocean Circulation Experiment (WOCE); moreover, the highest quality data were observed within a short period of time. Therefore, the noise level of the reference dataset is very low (Kobayashi 2004), and the climatological reference data can be estimated with fairly small mapping errors. In other words, the float data there may be
1598
JOURNAL OF ATMOSPHERIC AND OCEANIC TECHNOLOGY
VOLUME 22
FIG. 8. The results for float WMO ID 5900165 in the eastern tropical Indian Ocean (otherwise, as for Fig. 3).
calibrated based on a “temporally biased” climatology. These data must be examined further to examine the level of agreement with “true” salinity. It should also be noted that the calibration errors in the constant 2000-db case are smaller than the measurement accuracy of the Sea-Bird Electronics 41-type conductivity sensor (⫾0.005) with which many profiling floats are equipped. Further examination is necessary to discuss whether the accuracy of software calibration can exceed that of sensor hardware.
f. Eastern tropical Indian Ocean Results for the eastern tropical Indian Ocean resemble the results for the tropical Pacific (Fig. 8; WMO ID 5900165). The accuracy of the calibrated salinity degrades with decreasing measurement depth, but is within ⫾0.01, even for constant 1000-db scheme measurements. These positive results are obtained for reasons similar to those for the results from the tropical Pacific.
OCTOBER 2005
KOBAYASHI AND MINATO
1599
FIG. 9. Summary of the salinity errors calibrated with WJO QC for the subtropical North Pacific, subarctic North Pacific, MWR, tropical Pacific (Tr), the subtropical South Pacific, and eastern tropical Indian Ocean (eIO). Blue, yellow, red, and green show the results with the constant 2000-, 1500-, 1000-db, and PnP N ⫽ 4 schemes, respectively. Purple shows the results derived only from the series of deeper PnP N ⫽ 4 profiles. The dashed line at 0.005 represents the measurement accuracy of the Sea-Bird Electronics 41–type conductivity sensor. The floats marked with an asterisk (*) are deployed in relatively less variable regions, farther from the confluence region of the Kuroshio and Oyashio.
4. Discussion Table 3 lists the results of all the experiments, and Fig. 9 summarizes these results. Errors in the calibrated salinity increase, or salinity data quality degrades, as the profile depth of float measurements decreases. However, the degree of data quality degradation varies widely according to the regional characteristics of the water mass structure. In the tropical regions of the Pacific and the eastern Indian Ocean, in particular, the accuracy of software-calibrated salinity data is maintained within an average of ⫾0.01, and thus meets the Argo accuracy goal, even when the profiles are limited to the 1000-db depth. In contrast, in the MWR, the large variability of the water mass restricts accuracy to within about ⫾0.015, even when the profiling floats continuously measure the temperature/salinity structure to the 2000-db depth. In the subtropical South Pacific, measuring 2000-db profiles constantly yields calibrated salinity data with fairly small errors, but the results need to be investigated further. With the exception of the MWR, the performance of the PnP N ⫽ 4 observation scheme seems tolerable for the Argo criterion for salinity measurements. The resultant errors in calibrated salinities are at least as small as those observed using the constant 1500-db scheme. However, the former scheme seems less stable than the latter, as the maximum errors in the PnP N ⫽ 4 scheme
deviate widely from the average, and are sometimes much larger than the maximum errors of the constant 1500-db (see the cases of WMO IDs 2900055, 2900057, 2900215, and 5900387). The relatively high accuracy of the PnP N ⫽ 4 scheme is maintained by the 2000-db measurements every four observation cycles. Thus, the accuracy will be greatly degraded if a float cannot dive to a deeper depth for any reason. Within the Argo community, it is considered that the deeper profiles of the PnP N ⫽ 4 scheme are sufficient to verify the quality of salinity data measured by this scheme, given that sensor conductivity degrades slowly over time. Figures 3f and 8f show the calibration results using only the deeper profiles. In this strategy, the float profiles used for calibration have generally fallen off and their observation intervals have increased to 40 days. In this calculation, the parameter k ⫽ 4 (see Table 2) is also used for the least squares fit, so as not to be influenced by short-term water mass variation. Therefore, this strategy is considered effective for longerlived floats. The results show that this strategy appears successful in reducing the calibration errors to those of the constant 2000-db scheme. Therefore, it is believed that this strategy has sufficient potential to calibrate the salinity data measured with the PnP N ⫽ 4 scheme in the case of conductivity sensor degradation, as was expected at the beginning of the Argo Project. Sensor sensitivity has recently been found to change
1600
JOURNAL OF ATMOSPHERIC AND OCEANIC TECHNOLOGY
suddenly, a change known as salinity jump (Argo Data Management Team 2002), the causes of which have not yet been identified. The salinity jump has been observed in the float WMO ID 5900175 (in the second profile, see Fig. 3), and has been randomly discovered in more than 10 of the approximately 300 floats deployed by JAMSTEC. The typical value of the jump is ⫾0.02–0.03 or more. This is outside the standards agreed in the project, and must be detected and corrected by software calibration. However, it is impossible to detect salinity jumps in a series of deeper PnP N ⫽ 4 profiles (Fig. 3f). Even using the entire series of float measurements (Fig. 3e), it is difficult to detect salinity jumps, as short-term natural variations in salinity are too large to be distinguishable from salinity jumps even in the isothermal layer around 1000-db depth. On the other hand, for the constant 1500-db observation scheme, the salinity measured in the deepest (coldest) layer (see Fig. 3c) appears to be more stable, and it is possible to detect sudden sensor degradation. Therefore, we have come to the following conclusion from the viewpoint of the Argo standard software calibration: to cope with sudden sensor degradation, Argo floats should be programmed to measure temperature/ salinity profiles at deeper depths constantly. One of the criteria is to measure at 1500 db in the Pacific, with the exception of the MWR where the floats must measure profiles to their marginal capability depth. This study examined the performance of software calibration only in regions biased toward the North Pacific. However, it is believed that the present results are likely to show the upper boundary of salinity accuracy that is achievable using current Argo software quality control, because the water masses in the deep layer the North Pacific are the most stable in the world, making this region the best for the WJO QC method. In this study, we have discussed preferable measurement schemes for profiling float observations from the viewpoint of salinity calibration error, which is achieved through the Argo delayed-mode quality control. As a practical matter, the observation scheme should be determined after consideration of several factors, such as, purposes of observations, conditions of target regions, float hardware, and quality control. In the case of float observations in regions that ships rarely visit (e.g., in the South Pacific and Antarctic), for example, it is strongly required to extend floats’ lifetime and minimize unexpected hardware troubles: one of the most reasonable decisions would be to skip some of deep layer measurements, or to omit all of them, even though data quality would be sacrificed. This study has shown that salinity quality control is an im-
VOLUME 22
portant factor that has to be taken into account and that accuracy can vary considerably.
5. Summary To obtain salinity data that satisfy the quality sought in the Argo Project (⫾0.01), this study evaluated the calibration errors of the standard Argo software calibration for several data series observed using different schemes. In the subtropical and subarctic regions of the North Pacific, profiling floats should be used that are programmed to constantly measure profiles to a depth of 1500 db or more. In the tropical regions of the Pacific and the eastern Indian Ocean, salinity data that are accurate to within ⫾0.01 can be achieved using the existing floats, which can measure profiles to a 1000-db depth constantly. In the MWR, however, the profiling floats must be programmed to measure salinity profiles to their marginal capability depth (e.g., 2000 db) constantly, in order to minimize calibration errors. When profiling floats using the Park and Profile scheme are employed for ocean observations, it is recommended that they be programmed to measure deeper profiles every observation cycle (i.e., PnP N ⫽ 1). Otherwise, it is impossible to detect and correct suspicious data, such as salinity jumps, using the standard Argo software quality control. A salinity jump is a sudden difference in measured salinity from previous measurements of ⫾0.02–0.03 or more, and this problem occurs randomly in a certain percentage of currently deployed floats. Acknowledgments. We thank Drs. Toshio Suga, Nobuyuki Shikama, Kensuke Takeuchi, and all members of the JAMSTEC Argo group for their advice and encouragement. In particular, Mr. Hiroyuki Nakajima is gratefully acknowledged for his operation of WJO QC. We also thank two anonymous reviewers for their valuable comments. This publication has used data from the international Argo Project (www.argo.ucsd. edu). Argo is a pilot project of the Global Ocean and Global Climate Observing System. The data from Argo profiling floats are freely available. This work was supported by The ARGO Project—Advanced Ocean Observing System as one of the Millennium Projects of the Japanese Government. REFERENCES Argo Data Management Team, 2002: Report of the Argo Data Management Meeting. Proc. Argo Data Management Third Meeting, Ottawa, ON, Canada, Marine Environmental Data, 42 pp. Argo Science Team, 2000: Report of the Argo Science Team Sec-
OCTOBER 2005
KOBAYASHI AND MINATO
ond Meeting. Proc. Argo Science Team Second Meeting, Southampton, United Kingdom, Southampton Oceanography Centre, 35 pp. ——, 2001: Argo: The global array of profiling floats. Observing the Oceans in the 21st Century, C. J. Koblinsky, and N. R. Smith, Eds., Godae Project Office, Bureau of Meteorology, 248–258. ——, 2003: Report of the Argo Science Team Fifth Meeting. Proc. Argo Science Team Fifth Meeting, Hangzhou, China, Second Institute of Oceanography, 66 pp. Feng, M., and S. Wijffels, 2002: Results from a pilot Argo float program in the southeastern Indian Ocean. Extended Abstracts, Scientific and Technical Workshop of the Data Buoy Cooperation Panel, Perth, Australia, DBCP Tech. Docs. 21, CD-ROM. Freeland, H., 1997: Calibration of the conductivity cells on P-ALACE floats. U.S. WOCE Implementation Rep. 9, 37–38. Kobayashi, T., 2004: Historical salinity dataset for Argo delayedmode quality control: Selected Hydrographic Dataset (SeHyD) (in Japanese with English abstract). Rep. Japan Mar. Sci. Technol. Center, 49, 51–71.
1601
——, and S. Minato, 2005: Importance of reference dataset improvements for Argo delayed-mode quality control. J. Oceanogr., in press. ——, and T. Suga, 2005: The Indian Ocean HydroBase: A highquality climatological dataset for the Indian Ocean. Progress in Oceanography, in press. ——, and Coauthors, 2002: Quality control of Argo data based on high quality climatological dataset (HydroBase). I. ARGO Tech. Rep. FY2001, Japan Marine Science and Technology Center, 36–48. Mizuno, K., and T. Watanabe, 1998: Preliminary results of in-situ XCTD/CTD comparison test. J. Oceanogr., 54, 373–380. Oka, E., 2005: Long-term sensor drift found in recovered Argo profiling floats. J. Oceanogr., 61, 775–781. ——, and K. Ando, 2004: Stability of temperature and conductivity sensors of Argo profiling floats. J. Oceanogr., 60, 253–258. Wong, A. P. S., G. C. Johnson, and W. B. Owens, 2003: Delayedmode calibration of autonomous CTD profiling float salinity data by -S climatology. J. Atmos. Oceanic Technol., 20, 308– 318.