The autonomous profiling float has been a revolutionary development in ... currents from autonomous gliders. ..... float designers to consider building smaller.
PAPER
Autonomous Profiling Floats: Workhorse for Broad-scale Ocean Observations AUTHORS
ABSTRACT
Dean Roemmich Scripps Institution of Oceanography, University of California San Diego Stephen Riser School of Oceanography, University of Washington Russ Davis Scripps Institution of Oceanography, University of California San Diego Yves Desaubies Institut Français de Recherche pour l’Exploitation de la Mer (IFREMER)
The autonomous profiling float has been a revolutionary development in oceanography, enabling global broad-scale ocean observations of temperature, salinity, velocity, and additional variables. The Argo float array applies this new technology to provide unprecedented measurements of the global upper ocean in near real time, with no period of exclusive use. It builds on its predecessors, the upper ocean thermal networks of the 1970’s to 1990’s— extending the spatial domain and depth range, improving the accuracy, and adding salinity and velocity. Precision satellite measurements of sea surface height, as made by the Jason1 altimeter, combine with Argo data in a dynamically complementary description of sea level variability and its subsurface causes. The broad-scale Argo float array is a central element in the international infrastructure for ocean research. A comprehensive ocean observing system can be constructed from floats, together with satellite measurements, improved measurements of air-sea fluxes, moored time-series in the tropics and other special locations, shipboard hydrography, and high resolution measurements in fronts, eddies and boundary currents from autonomous gliders. One of the primary objectives of the observing system is to close the oceanic budgets of momentum, heat, and freshwater on seasonal and longer time-scales in order to understand the role of the ocean in the climate system.
INTRODUCTION s of mid-2004, there are more than 1250 active profiling floats in the Argo array (Fig. 1). The number of active floats has increased by about 50 instruments per month during 2004 (there were 1008 active floats at the end of December 2003 and 1261 on June 10, 2004) toward a planned global array of 3000 floats. Argo will produce unprecedented global-scale observations, every 10 days, of the temperature and salinity fields of the upper ocean and the circulation at intermediate-depth. Seventeen nations are providing Argo floats, with many others participating in deployment logistics and utilization of data. The Argo data management system provides the data in real time to all users, with a completely open data policy. In particular, Argo data are distributed on the global telecommunications system (GTS) of the World Meteorological Organization, as well as via the Internet, so they are available directly to Weather Services and other operational users for incorporation in analyses and forecasts, as well as to researchers.
A
The rapid progress toward a global Argo array, and the high level of interest worldwide, are due to the broad utility and efficiency of profiling float technology and to its central role in a comprehensive ocean observing system. The following discussion begins by considering the concept of broadscale ocean sampling, then its application in the Argo array, and finally summarizes the present status and future directions of profiling float technology.
The Broad-scale Mode of Ocean Sampling The term broad-scale sampling describes measurements spread over large ocean areas, at spatial intervals of hundreds of kilometers, greater than the size of eddies and boundary currents. The quantity of interest is a smoothed or area-averaged measurement such as heat content, average salinity, or large-scale circulation. Implicit in the definition is that the number of independent
FIGURE 1 Positions of 1261 active Argo floats as of June 2004
Spring 2004
Volume 38, Number 1
31
samples must be sufficient so that the largescale components of the measured field are estimated with acceptable signal-to-noise ratio, rather than being noise-dominated due to unresolved features. Broad-scale measurements may be made using freely drifting arrays of floats or drifters, by ships making widely spaced transects (e.g. with expendable bathythermographs, XBTs), or by moored buoys. The oceanic scales of interest for this form of measurement have typically been 1000 km or larger, up to basin or global scale. An improved understanding of the ocean’s role in the climate system requires measurements of the time-varying storage of heat and freshwater, as well as their lateral fluxes and air-sea exchanges. The terms of the heat budget reveal how the ocean absorbs heat in one region, carries it on ocean currents to another, sequesters it in subsurface layers, and eventually passes it back to the atmosphere. The freshwater budget can identify regional variability in precipitation and evaporation through tracking of surface and subsurface salinity anomalies. A comprehensive observing system must measure all three terms—air-sea exchange, storage, and lateral transport—for both heat and freshwater. Multi-decadal broad-scale sampling programs have been used to estimate heat storage and air-sea heat exchange. For the lateral flux of heat, a different form of sampling is needed. Eddy-resolving sampling along specific lines is complementary to the broad-scale mode. The line-sampling mode is aimed at the lateral fluxes across the boundary of a region. It is necessary to sample at higher spatial resolution in the line mode, resolving eddies and boundary currents for flux calculations, and to sample from ocean boundary to boundary for flux integration. Research vessels lend themselves to the linesampling mode, for example in the ocean heat transport estimates from the World Ocean Circulation Experiment (WOCE, e.g. Ganachaud and Wunsch, 2000). The XBT has been used in both the broad-scale and eddy-resolving line modes. Since the 1970s, broad-scale XBT surveys of upper ocean temperature have been carried out along many commercial ship tracks
32
Marine Technology Society Journal
(Fig. 2). A series of network design studies determined that commercial ship tracks were dense enough to permit broad-scale sampling of upper ocean temperature, and estimated the optimal spacing of probes along the tracks. Successful broad-scale programs were carried out in the northern and tropical Pacific and Atlantic Oceans. Ship tracks in the southern hemisphere are much sparser, so broad-scale ship-based measurements of upper ocean temperature are not practical on a global basis. The XBT has advantages of low cost and technical simplicity. Its limitations are the need for a ship to pass at the time and place of the measurement, and the relatively low quality of XBT temperature data. Due to its technical limitations, the observing system of the 1990s provided only narrow glimpses of the oceans’ heat and freshwater budgets. Substantial shortcomings in broad-scale sampling included the lack of salinity measurements, poor spatial coverage in remote regions, insufficient depth coverage (400 m or 760 m for XBT profiles), and poor data quality. Float technology offers improvement in all of these respects. Autonomous floats were developed in the late 1980s (Davis et al, 1992), differing from previous subsurface float technology by using surface satellite tracking rather than sub-surface acoustical tracking, thus eliminating the need for costly moored sound sources. The initial objective was to measure intermediate-depth circulation globally
during WOCE (Davis, 1991). Temperature profiling capabilities were added in the mid1990s during WOCE deployments in the Indian Ocean, and CTD profilers were deployed later in regional arrays in the Atlantic Ocean (e.g. Lavender et al., 2002; Kwon, 2003). The potential of the new profilers in broad-scale sampling of upper ocean temperature, salinity, and absolute velocity was quickly recognized, leading to planning for the global Argo array in 1998. Profiling floats are autonomous, operating globally in icefree regions for years at a time, and have been deployed from research vessels, commercial ships, and C-130 aircraft. They provide high quality temperature and salinity data at a moderate cost. Instrument motions are primarily due to mid-depth velocity rather than surface drift, and, consequently, float arrays are dispersed after deployment with minimal tendency to clump or spread. A broadscale array can be effectively maintained with reseeding intervals of a few years. Although the profiling float has enormous potential for broad-scale ocean observations, it does not provide a complete observational strategy. It is essential that parallel advances be made in the measurement of air-sea exchanges and in the eddy-resolving line mode for estimation of lateral fluxes. Fortunately, there are promising developments in both of those areas (Weller et al., 2004; Rudnick et al., 2004).
FIGURE 2 Map of subsurface ocean temperature profile locations for a typical month in the 1990s (January 1995) including XBTs and tropical moorings.
The Design and Initial Implementation of Argo Argo came about through the need to adapt the technology of profiling floats to the global and regional requirements for broad-scale ocean sampling. While the climate research applications of Argo are prominent, the array has a wide variety of other research and operational applications, including ocean state estimation and fisheries and ecosystem studies. In 1998, the International Argo Science Team was established jointly by the Climate Variability and Predictability (CLIVAR) project and the Global Ocean Data Assimilation Experiment (GODAE). One of the first actions of the Argo Science Team was to study appropriate design criteria for the Argo array (Roemmich et al., unpublished manuscript, 1998, see http://www.argo.ucsd.edu/argodesign.pdf), resulting in a provisional recommendation for a global array deployed at 3o by 3o spatial scales. A primary element in Argo design was the broad-scale network design studies carried out for the XBT networks. These included White and Bernstein (1979, North Pacific Ocean), Phillips et al. (1990, Indian Ocean), Meyers et al. (1991, tropical Pacific Ocean), Sprintall and Meyers (1991, eastern Pacific Ocean), Festa and Molinari (1992, Atlantic Ocean), and White (1995, global from 30oS to 60oN). In each of these, correlation statistics and noise and signal variances for the large-scale temperature field were estimated from historical XBT data. These statistics were then applied using optimal interpolation techniques (Bretherton et al., 1976) to determine sampling requirements for estimation of the large-scale (> 1000 km) signals. Argo’s 10-day cycling at 3o by 3o spacing exceeds the requirements suggested by these studies. For example, based on the global minimum in spatial and temporal correlation scales, White (1995) concluded that 2500 – 3000 temperature profiles per month globally would be sufficient to resolve biennial (but not year-toyear) variability. Argo is already providing more than 3500 CTD profiles per month (Fig. 4a) and on full implementation will provide about 9000.
Another primary consideration in Argo design was TOPEX/Poseidon altimetric height data. The largest contributor to sea surface height fluctuations is steric variability due to subsurface temperature and salinity (e.g. Gilson et al., 1998, Rintoul et al., 2002). With multi-year altimetric data, Wunsch and Stammer (1995) produced a globally averaged along-track wavenumber spectrum for sea surface height. They found that 48% of the variance is at wavelengths longer than 1000 km and 70% at wavelengths longer than 500 km. Thus, for estimating signals having wavelengths longer than 1000 km, an array with 500 km spacing would provide a 1:1 ratio of signal variance to error variance. Spacing of 250 km would improve this ratio by more than a factor of 2 in each dimension. The unresolved variability—fronts, mesoscale eddies etc.—has correspondingly short correlation times, typically 10-20 days, compared with the seasonal, interannual, and decadal climate signals of interest. Hence, the ratio of signal-to-noise can be greatly increased by temporal averaging. Stammer (1997) showed a shift to shorter spatial scales at higher latitude, so that closer spacing is needed there. Because of the convergence of meridians at high latitude, the Argo 3o by 3o specification provides for an increase in float sampling density with latitude.
Other datasets and model calculations have provided additional evidence for the effectiveness of a fully-implemented Argo array. Analyses of WOCE float data (e.g. Davis, 1998) showed that, even at lower sampling density than Argo, float arrays were effective for mapping the large-scale circulation. Guinehut et al. (2002) used a 1/3o primitive equation model which was then sampled at Argo resolution. They found that most of the large-scale low frequency variance could be retrieved, and that the array suffered little from degradation due to motion of floats. The statistics of variability in the global ocean are still not well known. A primary goal in the early years of Argo is to improve our knowledge of the scales and patterns of seasonal and interannual variability, so that the initial design of the Argo array can evolve for better regional and global sampling. The early implementation of Argo provided regional arrays in the northern and tropical Atlantic and Pacific, in accordance with priorities set by float-providing nations. However, the implementation of a global array was agreed as the top priority of all Argo participating nations. Now that the regional arrays are at about 50 - 100% of design density, it is agreed to expand Argo to sparse global coverage by the end of 2004, and then to increase float sampling density in subsequent years. The largest gaps in
FIGURE 3 An example of plans for Argo float deployments during April – December 2004. Scattered black symbols are presently active floats and red symbols connected by lines are planned.
Spring 2004
Volume 38, Number 1
33
present coverage (Fig. 1) are in the southern Pacific, where there are few commercial ships or transiting research vessels. The plan for Argo float deployments during 2004 (Fig. 3) includes contributions from several nations. An important element is a joint project of U.S. and New Zealand Argo involving deployment of over 140 floats from a small
research vessel. The Argo array has already surpassed the XBT networks with respect to the number and broad-scale distribution of profiles (Fig. 4a). Argo also provides increased accuracy and depth, and salinity profiles and intermediate-depth velocity measurements. Argo is the dominant source of deep-ocean CTD data (Fig. 4b).
FIGURE 4a Locations of 3526 Argo float profiles (red) and 2329 XBT profiles (blue, along lines), delivered in near-real time in March 2004. (Courtesy of NOAA/AOML).
FIGURE 4b Annual total of CTD profiles to 850 m or greater depth from research vessels, WOCE floats, and Argo floats (Courtesy of J.K. Willis). By 2007, the number of Argo profiles will be about 100,000 per year.
34
Marine Technology Society Journal
Argo and Jason Satellite altimetry and profiling floats have a special relationship since, as noted previously, they measure the height of the sea surface and its subsurface causes. It is this relationship that gave Argo its name— to emphasize the close connection between the Argo float array and the NASA/CNES Jason-1 altimeter. Essentially, sea surface height increases when the underlying ocean warms and expands or when cool water is replaced by warmer water. As noted above, thermal expansion is the largest contributor to sea surface height variability on seasonal and longer time-scales over most of the ocean (Gilson et al., 1998; Rintoul et al., 2002). Salinity also affects sea surface height, with a relatively fresh column of sea water standing higher than a saltier one. Finally, the horizontal distribution of mass in the sea affects sea surface height, and the drift of a float at mid-depth reveals horizontal gradients in the mass field above the drift level (via the geostrophic relationship, e.g. Davis, 1998). Floats cannot directly observe changes in the global average of sea surface height, although altimeters can (Leuliette et al., 2004). However, decadal sea surface height changes due to net melting or freezing of polar ice could be detected from their effect on mean ocean salinity (Munk, 2003). Early work with the TOPEX/ POSEIDON altimeter showed that subsurface variability—heat content or temperature structure—could be estimated using altimetry and the high correlation of height versus heat content (White and Tai, 1995). In combining the altimetric and subsurface datasets, one would like to achieve both the excellent spatial and temporal resolution of altimetry together with the knowledge of subsurface vertical structure in temperature provided by profile data. The modest signal-to-noise ratios provided by the in situ data array alone can be greatly improved if, in effect, the altimeter data are used to interpolate on the finer scales not resolved by the broad-scale sampling mode. Recent work (Willis et al., 2003) improved on the technique for combining altimetry and subsurface data, and in Willis et al. (2004), global maps of ocean heat content and tempera-
ture change were produced for each year from 1993 to 2003. The average heat gain over the 10-year period was 1.0 W/m2, or about 0.34 pW globally (Willis et al., 2004). This study pointed to strong warming at 40oS, where Argo is presently contributing many floats in previously data-void regions. Another approach to exploiting the Argo/JASON combination is through ocean data assimilation modelling, including operational modelling and forecast systems. These models provide estimates of the state of the ocean, consistent with diverse in situ and space borne datasets, and subject to dynamical constraints. Several global systems have demonstrated the ability to monitor and forecast the global ocean and regional seas through routine assimilation into 3D ocean models (e.g. Bahurel et al., 2002; Stammer et al., 2002). It is one of the objectives of GODAE to demonstrate further the feasibility and the value of such operational systems. While remotely sensed data from satellites provide the only means to gather global, high-resolution, real-time information on the ocean environment, in situ data are indispensable to complement the satellite data, which sense only the ocean surface. The combination of all data types through assimilation into numerical ocean circulation models enables self-consistent merging of the data types, interpolation in time and space for uniform coverage, evolution of information assimilated according to the model’s physics and dynamics, validation and quality control of the data sets, and nowcasting (i.e. data synthesis in real-time), forecasting, and hindcasting. An important innovation in satellite and in situ observing systems has been the adoption of an open data policy, including provision of datasets in near-real time with no period of exclusive use. Timely access by forecast centers enables an assessment of the operational implications of Argo, which can provide valuable feedback to help justify support needed to maintain the array over the long term. The open data policy and efficient data management systems of Argo, Jason, and other observing system components are essential ingredients in the revolutionary advancement of global ocean observations.
The Present Status of Profiling Float Technology Buoyancy Engine The heart of a profiling float (Fig. 5) is its buoyancy engine, the pump that enables a float to change its volume, alternately becoming neutrally buoyant at mid-depth or rising to the sea surface. Two kinds of pumps have been used in autonomous floats, and both kinds are presently used in Argo. A single-stroke pump relies on gearing to obtain a high mechanical advantage to rotate a screw and extend or retract a piston in a cylinder. The volume of the cylinder (presently as much as 260 cm3) determines the maximum volume of mineral oil that can be pushed into an exterior bladder to increase float buoyancy. The alternative is a reciprocating pump, with valves to enable a small cylinder to be filled repeatedly from an interior reservoir and emptied to the exterior bladder. A small light-weight reciprocating pump provides effectively unlimited buoyancy adjustment but at some cost in the extra complexity of valves required to change buoyancy in both directions and in a sensitivity to pump failure from “vapor lock” if a small volume of gas fills the pump cylinders.
Pressure Case Pressure housings presently used in profiling floats are typically built to withstand pressures at depths somewhat greater than 2000 meters, but not full-depth ocean pressures. Stronger pressure housings would increase the float’s weight and volume, and therefore require greater capacity for buoyancy adjustment and higher energy cost. Since salinity signals in the deep ocean are small—comparable to or less than salinity sensor drift in multi-year float missions—it may not be cost effective to trade off greater size and energy consumption for increased depth capability. An engineering challenge, as salinity stability increases, will be to increase the depth range of floats appropriately.
CTD Sensor Most present Argo floats use a pumped conductivity cell fitted on the top of the float. The use of a pumped system, although con-
FIGURE 5 Structure of a profiling float. The float shown has a single-stroke pump; other models have a reciprocating pump and internal fluid reservoir.
suming some additional energy, leads to improved stability in the resulting salinity measurements (Fig. 6) in two ways. First, the use of a biocide in the pumped loop slows degradation of the conductivity estimate due to bio-fouling. During the periods when the pump is stopped, biocide concentration builds up and inhibits fouling. Great care is needed to ensure that the concentration of biocide is high enough to be effective but does not itself lead to any change in the conductivity cell. Second, it is essential that the pump shuts off before the instrument reaches the sea surface. In instruments that continue to pump while crossing the air-sea interface (standard practice with shipboard CTD instrumentation), any surface films in the water will coat the conductivity cell and speed the problem of salinity drift. In early Argo floats, it was noted that conductivity cells were more stable than anticipated except in instruments where the pump was inadvertently left running at the air-sea interface due to drift in pressure sensors. Spring 2004
Volume 38, Number 1
35
On the whole, data quality has been high although all extant CTDs become less accurate after long periods exposed to bio-fouling and corrosion. Conductivity sensor problems can be categorized as (a) small, slow drifts, (b) anomalous changes in calibrations, and (c) temperature spiking. About 95% of sensors are subject to gradual drifts of O(0.02 psu). Recalibration corrections based on comparison with historical observations (Wong et al., 2003) typically allow these to be corrected to about 0.01, depending on tightness of the temperature/salinity relation. About 5% of the Argo sensors have, in their lifetimes, shown errors greater than 0.1 psu, These anomalous errors are about evenly split between large but slow drifts (easily corrected) and jumps, which often affect only a few profiles and may result from contact with biological matter. Salinity spiking occurs when instrument responses to transient T and S features occur with different time constants. In the pumped Sea Bird CTD that is most common Argo, the conductivity sensor has significant thermal mass that affects the temperature of the water whose conductivity is measured, causing erroneous conductivity readings that in regions of high T and S gradients can generate apparent density instabilities. With the present System ARGOS communications, readings are typically spaced 5 m or more in the vertical so spiking can be minimized by appropriate averaging
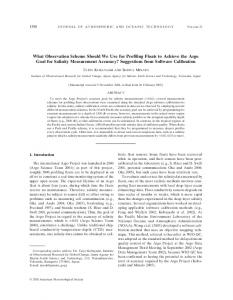
FIGURE 6 Temperature/salinity data from a single float (PALACE 063) in the western subtropical North Atlantic Ocean over a period of 3 years. The float data are shown in comparison with data from 224 stations previously collected in this region during the period 1963-1993; the archival data are taken from the World Ocean Atlas 1994. The float data show considerably less scatter than do the data in the archives, especially at subsurface levels where the variability is expected to be smaller. This float was one of a few that were recovered at sea, and the CTD was subsequently recalibrated at the factory. Salinity drift over the three-year period was found to be 0.007 (PSS78), a surprisingly small change that demonstrates the high quality of salinity data that can be expected to be collected by Argo floats.
Satellite Communication Most Argo floats use the one-way, lowbandwidth System ARGOS satellites for location and data relay. There are several advantages to using a two-way, higher bandwith system. (i) The time spent on the sea surface, where floats are most susceptible to biofouling and various other hazards, could be reduced from the present 12-16 hours per profile to a few minutes. (ii) The significant amount of battery energy presently expended re-transmitting messages to ensure receipt would be greatly reduced if confirmations were possible. (iii) Higher bandwidth would enable transmission of more data, including higher vertical resolution in profiles. (iv) Two-way capability would make it possible
36
Marine Technology Society Journal
to send instructions to floats for troubleshooting or mission alterations. Changeover to faster two-way satellite systems has progressed slowly in part because of concern for stability of each of the available systems. Prototype two-way instruments have been deployed in Argo, but there have not yet been large-scale deployments.
Complexity and Reliability The profiling float is not a simple instrument. Its pumping system must work reliably at deep ocean pressures year after year, with minimal energy use. The instrument controller must communicate dependably with the separate CTD controller and
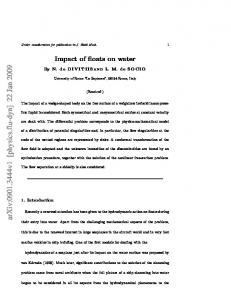
well as managing all of the float’s buoyancy adjustment and communication functions in a nearly fail-safe manner. A goal for Argo is to achieve mean instrument lifetimes of 4 years (after discounting for a small percentage of early failures). Early Argo floats of all designs deployed in 2000 – 2001 suffered from a variety of problems. About onefourth of these instruments failed by the end of their first year (Fig. 7). A hiatus in float deployment for part of 2002 was necessary to address problems in float design, manufacture and deployment practices. Instruments deployed in 2003 have demonstrated improved reliability. It is too early to judge the extent to which these instruments will
meet the target for float lifetime, but 1-year statistics of the improved float designs are promising. For the 290 U.S. Argo floats deployed in 2003, which now have a mean lifetime of 1 year (36 cycles), 91% of the instruments remain active (Fig. 7). The improvements, incorporated in all of the U.S. instruments in 2003, in some cases reached other Argo partners late in the year. Higher overall survival rates are expected for 2004 deployments. Efforts continue to identify and correct weaknesses, a difficult undertaking since floats are rarely recovered, and they send back only limited diagnostic information. Given the complexity of the instrument, diligence in identifying and correcting new problems before they affect large numbers of instruments will be an essential part of Argo. From the outset of Argo, it has been understood that profiling floats are a developing technology rather than a mature one. However, the reasons for implementing a global ocean observing system sooner rather than later are compelling. In order for Argo to succeed, strong involvement by the ocean research and technology communities is required, so that the instrument will continue to evolve and improve even as the array provides unprecedented views of the global ocean.
The Future of Profiling Floats in the Ocean Observing System There are two pressing issues for defining the continuing role of profiling floats in the observing system during the next decade. The first question is how the technology will evolve in response to requirements for both (i) better efficiency and performance and (ii) accommodation of additional sensors. The second question is how profiling floats will combine with other autonomous instrumentation, especially gliders (see Rudnick et al., 2004, this issue) in a comprehensive ocean observing system. The dual requirements of efficiency and new sensors may lead to the development of float technology along two separate trajectories. Efficiency and performance require float designers to consider building smaller
FIGURE 7 Survival rate for floats deployed in 2001 and 2003 (Source: Argo Information Centre, http://argo.jcommops.org). The abscissa is the average number of 10-day cycles completed by the group of floats. U.S. Argo 2003 deployments incorporated improvements aimed at increased reliability and robustness.
instruments. Smaller diameter pressure cases are stronger for a given wall thickness, and smaller instruments require less pumping capacity and energy for a given buoyancy adjustment ratio (∆Volume)/(Volume). The high-pressure pumping system typically uses 50% or more of a float’s energy budget, so reductions in pumping energy are critical. At least one float manufacturer is already developing an instrument of significantly reduced size, and others may follow. Although smaller, more efficient CTD profiling floats are feasible, miniaturization becomes problematic as additional sensors are incorporated onto the basic float hull. A number of promising new sensors are in various stages of development and testing, including sensors for oxygen, carbon dioxide, velocity shear, seismic activity, and biooptical measurements. Improved capabilities for sea surface temperature and salinity and fine structure measurements are also
feasible and could broaden the float user community. An added consideration with new sensors is the scales of variability and depth requirements for, say, biological variables, relative to physical and geochemical ones. It may prove to be more efficient to deploy separate instruments for biological measurements—with higher cycling rates and shallower dives than are required for temperature and salinity variability in the climate system—rather than a single array to sample all variables. One can imagine regional arrays of multi-sensor floats imbedded in a global broad-scale temperature/salinity array. The development of new sensors opens up exciting opportunities for the observing system but also poses difficult challenges in prioritization and in design of optimal arrays. Autonomous gliders (Davis et al., 2002; Rudnick et al., 2004) have buoyancy adjustment capability similar to a float but addiSpring 2004
Volume 38, Number 1
37
tionally have a streamlined hull, wings and tail, a compass, and a dynamical nose-totail ballasting capability. The instrument glides up and down through the water column while pointing toward a target, so that the instrument’s net displacement is the sum of its relative motion plus ocean currents. In order to follow a programmed track, rather than being moved about by ocean currents, a glider must cycle more rapidly than a float. Typically, gliders do not “park” at depth like floats, but rather cycle continuously. Hence their temporal and spatial interval between profiles is less than for floats. The glider is therefore intrinsically an eddy-resolving linemode device, rather than a broad-scale one. The natural niche for gliders in the observing system is in measurements of boundary currents and fronts and of property fluxes across lines, as well as coverage of shallower coastal waters. They are thus likely to be a powerful complement to floats rather than a replacement for them. The reusable aspect of gliders is a strong attraction, but their relatively high cost and additional engineering challenges are balancing factors. The ocean observing system of the future will be very reliant on autonomous instruments, but it is more likely to consist of several different types of measurement platforms rather than being built on a one-platform-fits-all strategy. Full-size multi-sensor floats, compact CTD floats, and gliders may all fill distinctive niches.
Acknowledgements The Argo project is a community endeavor, spread across more than 17 nations. The shared contributions by many scientists and engineers in technology development and improvement, and in designing and implementing the Argo array, are gratefully acknowledged. We thank C. Schmid, J.K. Willis, W.J. Gould, L. Lehmann, and J. Gilson for providing figures. Y. Desaubies was partially supported by the EU project GyroScope, contract EVK2-CT-200000087. Participation by D. Roemmich, R. Davis, and S. Riser was partially supported by NOAA (Grant NA17RJ1231 Task 2 at SIO and NA17RJ1232 Task 2 at UW) and by ONR Grant N00014-01-1-1084 at UW. The views expressed herein are those of the authors and do not necessarily reflect the views of NOAA or any of its sub-agencies.
References
Marine Technology Society Journal
Ganachaud, A., and C. Wunsch, 2000. Improved estimates of global ocean circulation, heat transport and mixing from hydrographic data. Nature, 408:453 – 457. Gilson, J., D. Roemmich, B. Cornuelle and L.-L. Fu. 1998. Relationship of TOPEX/ Poseidon altimetric height to the steric height and circulation in the North Pacific. J Geophys Res. 103:27947-27965. Guinehut, S., G. Larnicol, and P.Y. Le Traon. 2002 Design of an array of profiling floats in the North Atlantic from model simulations. J Marine Syst. 35(1-2):1-9. Kwon, Y.O. 2003. Observation of general circulation and water mass variability in the North Atlantic Subtropical Mode Water region. PhD thesis. University of Washington.
Bahurel, P., P. De Mey, C. Le Provost and P.Y. Le Traon. 2002. A GODAE prototype system with applications - Example of the Mercator system. “En route to GODAE” 2002 Proceedings, 137-142, Edited by CNES, France.
Lavender, K.L., R.E. Davis and W.B. Owens, 2002. Observations of open-ocean deep convection in the Labrador Sea from subsurface floats. J Phys Oceanogr. 32:511 – 526.
Bretherton, F.P., R.E. Davis and C.B. Fandry, 1976. A technique for objective analysis and design of oceanographic experiments applied to MODE-73. Deep Sea Res. 23:559 – 582.
Leuliette, E.W., R. S. Nerem and G. T. Mitchum. 2004. Results of TOPEX/Poseidon and Jason-1 calibration to construct a continuous record of mean sea level, Mar Geod, in preparation.
Davis, R.E. 1991. Observing the general circulation with floats. Deep Sea Res A. 38 Supplement:S531 – S571. Davis, R.E., D.C. Webb, L.A. Regier, and J. Dufour 1992. The Autonomous Lagrangian Circulation Explorer (ALACE). J Atmos Ocean Tech. 9:264 – 285.
38
Festa, J. and R. Molinari. 1992. An evaluation of the WOCE Volunteer Observing Ship XBT network in the Atlantic Ocean. J Atmos Ocean Tech. 9:305-317.
Meyers, G., H. Phillips, N. Smith and J. Sprintall. 1991. Space and time scales for optimal interpolation of temperature - Tropical Pacific Ocean, Progr Oceanogr. 28:198-218. Munk, W. 2003. Ocean freshening, sea level rising. Science. 300:2041 – 2043.
Davis R.E. 1998. Preliminary results from directly measuring middepth circulation in the tropical and south Pacific. J Geophys Res. 103(C11):24619-24639.
Phillips, H., R. Bailey and G. Meyers. 1990. Design of an ocean temperature observing network in the seas north of Australia. Part II, Tropical Indian Ocean: Statistics. CSIRO Marine Laboratories Report No. 211.
Davis, R. E., C. C. Eriksen and C. P. Jones. 2002. Autonomous buoyancy-driven underwater gliders, In: Technology and Applications of Autonomous Underwater Vehicles, ed. G. Griffiths. London: Taylor and Francis.
Rintoul, S., S. Sokolov and J. Church. 2002. A 6 year record of baroclinic transport variability of the Antarctic Circumpolar Current at 140oE derived from expendable bathythermograph and altimeter measurements, J Geophys Res. 107(C10):3155, doi:10.1029/2001JC000787.
Rudnick, D., R. Davis, C. Eriksen and M.J. Perry. 2004. Undersea gliders for ocean research. Mar Technol Soc J (this issue). Sprintall, J. and G. Meyers. 1991. An optimal sampling network for the eastern Pacific Ocean. J Geophys Res. 96:10539-10552.
Wunsch, C. and D. Stammer. 1995. The global frequency-wavenumber spectrum of oceanic variability estimated from TOPEX/ POSEIDON altimetric measurements. J Geophys Res. 100:24895-24910.
Stammer, D., 1997. Global characteristics of ocean variability estimated from regional TOPEX/ POSEIDON altimeter measurements. J Phys Oceanogr. 27:1743-1769. Stammer, D., C. Wunsch, I. Fukumori and J. Marshall. 2002. State estimation in modern oceanographic research. EOS, Transactions, American Geophysical Union. 83(27):289 & 294-295. Weller, R.A., F. Bradley, and R. Lukas. 2004. The interface or air–sea flux component of the TOGA Coupled Ocean–Atmosphere Response Experiment and its impact on subsequent air– sea interaction studies. J Atmos Ocean Tech. 21:223 – 257. White, W. 1995. Design of a global observing system for gyre-scale upper ocean temperature variability. Progr Oceanogr. 36:169-217. White W. and C.K. Tai. 1995. Inferring interannual changes in global upper ocean heat content from TOPEX altimetry. J Geophys Res. 100(C12):24943-24954. White, W. and R. Bernstein, 1979. Design of an oceanographic network in the mid-latitude North Pacific. J Phys Oceanogr. 9:592-606. Willis, J., D. Roemmich and B. Cornuelle. 2003. Combining altimetric height with broad-scale profile data to estimate steric height, heat storage, subsurface temperature and SST variability. J Geophys Res. 108(C9):3292, doi:10.1029/2002JC001755. Willis, J., D. Roemmich and B. Cornuelle. 2004. Interannual variability in upper-ocean heat content, temperature and thermosteric expansion on global scales. Submitted to J Geophys Res. Wong, A.P.S., G.C. Johnson and W.B. Owens. 2003. Delayed-mode calibration of autonomous CTD profiling float salinity data by theta-S climatology, J Atmos Ocean Tech. 20:308 - 318. Spring 2004
Volume 38, Number 1
39