1
Wi-Fi Scaling and Performance in Dense Frequency Planned Networks Jonathan Ling, Howard Huang, and Reinaldo Valenzuela
ABSTRACT The capacity scaling of a Wi-Fi network with fixed transmit power is investigated. The 802.11 MAC appears to impose a hard limit on the area capacity by enforcing single transmissions in overlapped cell coverage areas. However due to the difficulty reading the packet header when transmissions either overlap or are faded, stations in different cells may lose synchronization with each other. A large frequency planned network with full propagation impairments of fast and slow fading is simulated in NS-3 with an upgraded receiver model supporting packet capture. Downlink Wi-Fi performance is compared to an equivalent LTE network on the same cell centers. Results show that Wi-Fi downlink throughput grows with densification limited by decreasing SINR and partially operational virtual carrier sense. LTE area capacity grows faster as it is only constrained by SINR.
I. INTRODUCTION Operating in the unlicensed band Wi-Fi networks must be compatible with wide range of devices that also might share the band, including ad-hoc deployments of the same technology. The 802.11 standard [1][2] specifies collision sense multiple access (CSMA) media access control (MAC), and specifically two carrier sense mechanisms: energy detection (ED) and virtual carrier sense (VCS) which relies on information in the packet header. Even though automatic channel selection would normally be used to avoid neighbors and increase reuse distance [3], two Wi-Fi access points (APs) can in fact be put physically on top of each other and via ED & VCS timeshare the same channel. CSMA is optimal in the sense it maximizes spatial reuse, producing maximal packing patterns, whereby no additional transmissions can be accommodated [4]. Cell densification has been meeting the increasing network demand. Yet as out-of-cell interference becomes stronger due to the smaller cells the gain due to cell splitting along with capacity-to-cost ratio diminishes [5][6][7]. Furthermore for 802.11 networks the MAC VCS appears to impose a hard limit on the area capacity due to strict enforcement of timesharing. However this limit is based on idealistic modeling of the receiver where all stations are coordinated, i.e. always hear each other’s transmissions. In practice MAC coordination between cells is limited due to propagation loss, fading, and interference. This is implied by the experiment of [8] which shows the throughput growing with separation of two pairs of stations (STAs) due to a gradual transition between coordinated and uncoordinated MAC. Jonathan Ling (
[email protected]) is at Nokia.
In this paper we model physical layer packet capture, a behavior originally lacking in NS-3, for the performance evaluation of a large frequency planned network. Basic experiments with small number of APs are performed, insights gleaned, followed by experiments on a large network with wrap around propagation. Slow fading and the Linux Minstrel rate manager are also modeled. Performance is investigated vs. cell densification for high reuse and low reuse pattern. We also compare Wi-Fi performance to 3GPP LTE performance to separate the effect of worsening signal-to-interference-andnoise-ratio (SINR) from MAC interaction. Simulation traces from NS-3 were examined carefully, and from this analysis we provide an explanation of the underlying MAC behavior justifying the observed trends in area capacity. The performance of 802.11 is difficult to characterize due to the complexity of the MAC, especially when considering 802.11n/ac enhancements, and large number of variables, such as traffic type and loading, wireless channel, and spatial distribution of users. Tools such as open source simulators have difficulty juggling conflicting requirements such as managing complexity while providing useful and correct abstractions from application layer down to the physical layer. NS-3 has 802.11a support and the basic CSMA implementation, but advanced PHY/MAC layer techniques in 802.11n or 802.11ac are not supported. Many features in the simulation model lack validation or have even been shown to be incorrect [9][10]. Alternatively experimental approaches have their own difficulties as some of the MAC, e.g. the scheduler on the AP, is proprietary and undocumented. Therefore the underlying mechanisms can be difficult to isolate and generalize beyond the specific set of hardware and software. One must rely on low level probing tools that have their own limitations. For example the radiotap header [11] would seem ideal to obtain low level PHY/MAC information, but device drivers tend to fill in fields sparsely and not always correctly. Related work is mostly focused on a single cell and simplified view of the protocol stack. Throughput vs. number of users is analyzed analytically by Bianchi [12]. The Minstrel rate manager is experimentally shown to provide higher TCP rates than other rate managers in [13]. Multi-cell performance estimates in [14][15] are limited by assumption of ideal timesharing MAC. Desensitizing the VCS to avoid time sharing with co-channel cells has been proposed [16]. Using the aforementioned technique, NS-3 simulations show that to 85% increase in rates after doubling the number of APs in a stadium environment [17]. Other improvements can be found in 802.11ax draft [18].
2 Many MAC algorithms are being evaluated with overly simplistic (0 or 1) adjacency graphs [8]. More accurately packet capture causes the stronger received packet to be decoded. Intuitively this leads to imbalance in user rates in favor of users closer to the AP. An analytical model for the effect of capture unfairness has been derived and experimentally validated [9]. While MAC layer modification is possible, e.g. via the 802.11 point control function (PCF), one proposed solution is to route uplink IP packets on LTE and downlink on Wi-Fi [20], thus both uplink and downlink will be scheduled and fairness enforced. The remainder of this paper is organized as follows. In Section II we discuss firstly the effect of packet capture on the MAC and secondly modifications to NS-3 model to support capture. In Section III we study the MAC behavior and performance for a small isolated network. In Section IV we study performance of a large frequency planned Wi-Fi network as the cell density increases. In the conclusions we summarize the key discoveries and mention future work.
802.11n standard from 20.3.24 PLCP receive procedure is: “The HT PHY shall maintain PHY CCA.indication (BUSY , channel-list) until the received level drops below the CCA sensitivity level (for a missed preamble) specified in 20.3.22.5.” From 17.3.10.5 CCA sensitivity is “If the preamble portion was missed, the receiver shall hold the carrier sense (CS) signal busy for any signal 20 dB above the minimum 6 Mbit/s sensitivity (-62 dBm). There are two situations possible: neither packet can be decoded, and all listening stations return to the idle state, according to Figure 1, or one packet (with higher RSSI) is captured and the other rejected. Therefore STAs will be divided into three groups each with different NAV settings:
II. CARRIER SENSE AND MODELING
This undesirable situation is mitigated by the ED mechanism.
A. Overlapped packets and VCS/ED Virtual carrier sense (VCS) is the primary MAC mechanism which involves the following PHY layer operations: packet preamble is detected, channel estimation performed, header read and decoding attempted. For normal data frames the channel is declared busy for the duration of the payload plus the short-inter-frame-space (SIFS) and acknowledgement (ACK). Since the packet header is coded at the lowest and most reliable modulation-and-coding-scheme (MCS), detection can occur at the lowest signal strength, approximately -90 dBm with modern receivers. This means that STAs will back-off and refrain from using the channel if it detects another transmission, even a very weak one. Regulatory agencies require power or energy detection in unlicensed bands before transmission, a.k.a. listen-before-talk. According to the 802.11 standard [1] the threshold is specified at -62 dBm which is 20 dB higher than the nominal decoding sensitivity of the lowest MCS (i.e. rate ½ BPSK). The ED threshold is relatively high SNR of 32 dB given 7 dB NF. Energy detection also has an important place in preventing incell collisions. The 802.11 MAC specifies random back-off in terms of slots, which are 9 uS long. The number of slots depends on the traffic priority. In the 802.11a, there are 31 slots, while in 802.11e there are 15 slots of best-effort traffic, and even fewer or higher priority traffic like voice and video. Transmission is allowed after 34uS long inter-frame space called the DIFS. In 802.11e this is called the AIFS and the length depends on the priority of the traffic intended for transmission. If two stations have the same back-off value there will be a collision. Listening stations will receive preamble from both STAs, which will appear similar to multi-path if such OFDM symbols fall within the cyclic prefix. Even if they don’t packet detection will likely be triggered. In the case of overlapped packets, the exact phrase in the
Proposition 1: Even in non-fading channels where the VCS ought to work ideally, energy detection serves as a useful backup to the VCS.
N1. Reject both packets. NAV is reset. N2. Capture packet 1. NAV is set according to length field of packet 1. N3. Capture packet 2. NAV is set according to length field of packet 2.
Consider a single AP with many STAs wishing to transmit and two overlapping transmissions. i)
Given STA’s in set N1, i.e. both packets not detected due to CRC check (802.11n). Without ED after another DIFS period STAs are free to transmit. ii) Given STAs in N2 or N3, the resultant SINR is enough for one of packets headers to be decoded. Consider the set of STAs where channel busy time is incorrectly set to the shorter packet rather than the longer one. Without ED after another DIFS period STAs are free to transmit. For both i) and ii) transmission during the ongoing packet collision is prevented by ED, which will hold the channel busy until both overlapped packets are completed. Regarding throughput, when the VCS and ED work together MAC sensing operates close to ideal and Bianchi’s Markov chain analysis predicts slow throughput decline with increasing STAs [12]. Wi-Fi vendors use this to their marketing advantage to demonstrate the “robustness” of Wi-Fi through a “large user scenario” by presenting results of an experiment of a single Wi-Fi AP and many STAs in the nearly ideal channel conditions that prevail in a single room, e.g. [19]. Furthermore simulators such as NS-3 should be able to replicate Bianchi’s results, which we show in the Section III.
3
Parameter
Value
Rate
802.11a OFDM 6 to 54 Mbps by Minstrel Rate Manager with update interval of 100 ms
MAC Protocol
Basic 802.11 access (no RTS/CTS)
Packet Capture Model
Custom SINR based
Packet Capture Threshold
-93 dBm AWGN channel
Packet Header
68 bytes, including IP & UDP headers & padding
Packet Length
1800 byte payload, 622 uS airtime
Rx Sensitivity
2 RX Antenna, Atheros Enterprise Chipset
Channel
Rayleigh flat faded with 10 Hz Jakes Doppler (2 kph)
Transmit Power
+14 dBm fixed
Noise Floor
-94 dBm, 7 dB NF
Traffic Model
Full buffer via saturated UDP flows
Scheduler
Round Robin
Table 1: Wi-Fi Fi related parameters setting for NS-3. NS Figure 1. VCS and receiver state machine. If the VCS fails, i.e. due to parity check failure, returns to idle state. B. Overlapped packets and NS-3 modeling. NS-33 is a state of the art network simulator [21], a ground up replacement for NS-2, 2, and used in this paper to simulate a large frequency planned network along with the corresponding 802.11a MAC and PHY layers. Inspection of the code and by traces shows that NS-33 does not correctly capture packets. If two packets are generated simultaneously a receiver simply captures the first one in the queue, computing the SIR in the presence of the other. While one may simulate the PHY layer in detail e.g. [22], wee have introduced two changes to improve the existing abstraction, In the NS-33 file yans yans-wifi-phy.cc, packet capture is delayed until the end of the ppreamble which is 4 uS. At this point a new event called sync2packet is created for the strongest packet. This event is triggered at the end of the packet header, i.e. in 20 uS. The event handler of sync2packet computes the SINR over the packet header and if it is greater than 4 dB [23] the upper MAC will be informed. It was also necessary to modify file interference interference-helper.cc to record all the overlapping events rather than collapsing the power as it does normally. Thus we have modified the NS-3 receiver model to calculate the header SINR and capture the packet with the higher one. An attempt to decode the payload will be made if the header is properly read, or else the receiver will return to idle state as indicated in Figure 1 from [1] [1]. Additionally a patch was introduced to correct a serious bug in NS NS-3’s implementation of the Minstrel rate manager [10]. Other parameters which control the operation of NS NS-3 are detailed in Table 1.
III. ISOLATED SMALL NETWORK NETWOR In a frequency planned network co-channel co APs are separated by distance and additional pathloss, as in Figure 2. As compared to full reuse, this his increases increas the overall SINR at the expense of reducing the bandwidth due to channelization. In this section we consider a small network with few cochannel APs and study MAC performance through selected examples and by numerical study. Inter-Cell Pathloss
Intra-Cell Pathloss Low PL -> energy detect triggered if header missed High PL-> energy detect ignored if header missed
Figure 2:: Two APs each with 3 STAs. AP are in center of cells, but not shown. A. Overlapping packets in a small network. In Section II it was shown that ED prevents transmissions and collisions when the NAV is incorrectly set to the shorter of the overlapped packets. Consider a small network of cells where each cell and its co-channel channel neighbor are reachable, i.e. the header and payload, transmitted at the lowest MCS, MCS are decodable. Neighboring cell transmissions will generally g fall below the ED threshold and therefore only activate the VCS. As result of careful inspection of NS-3 NS traces we provide two propositions that will be helpful in explaining the related numerical results. Proposition 2a: Identical back-off back triggers overlapped transmissions between cells. In Figure 3, three APs have data to transmit and are synchronized by a DIFS period by sensing the channel. Consider the events:
4 E1. Having identical back-off values AP 1 and 2 transmit together. E2. AP 3 is unable to decode the headers of either 1 or 2 due to interference and starts later. E3. AP 1 & 2 complete before AP 3 and after back-off AP 1 transmits. E4. AP 3 isn’t aware AP 1 is transmitting, so transmits. While a packet collision occurs at E1, reception may be successful depending on the STA SINR and the transmitted MCS. At AP 3 the overlapped packets are received at approximately zero dB SINR the VCS is unable to set the NAV. Due to failing to sense the channel busy, AP 3 transmits at E2, followed by further un-synchronized packets E3 and E4. At E3 when AP 1 listens it doesn’t receive any packet preambles, and thus transmits concurrently with AP 3. The same occurs at E4, when AP 3 finishes transmission, listens, but doesn’t detect any packet preambles, and thus transmits.
Figure 3: Example of timeline (left to right) of three APs/STA’s transmitting. The label “Data” represents the entire 802.11 preamble, header, and MPDU. A second example illustrates the difficulty maintaining MAC synchronization between cells, especially as distance is increased. Proposition 2b: A single fading event triggers overlapping transmissions between cells. Given two APs initially synchronized to a DIFS, Figure 4. There is a channel fading event between AP 1 and AP 2 so that even though they both have different back-off values B1(1) and B2(1) from AP 1 and AP 2 respectively, both APs transmit. During packet transmission, let the fading event be over, i.e. packet headers from one AP can be received by the other and vice versa. As shown in the figure due to the different packet lengths and starting times, AP 1 begins the second DIFS period before AP 2, and after back-off transmits before AP 2 completes its transmission. Now AP 2 waits for DIFS and with back-off B2(2) sees no preambles and transmits. DIFS+B1(2) A C K
Data
Cell 1 B1(1) Cell 2 B2(1)
Data
Data
A C K
DIFS+B2(2)
A C K Data
A C K
Figure 4: Fading causes initial sync loss and overlapped transmission, followed by continued overlap due to sensing misalignment. B. NS-3 small network study of capacity vs. separation Consider scenarios with 2 and 4 APs. All propagation channels were time varying with a Rayleigh distribution. The average pathloss between cells is fixed at the same value for all AP/STAs. The average intra-cell pathloss is fixed at 64 dB such that both VCS and ED are active. The MCS is fixed to 24 Mbps. Uplink UDP traffic is generated, such that there is always a full buffer. NS-3 is configured to report the number of received packets at completion of the simulation period. Figure 5 and 6 present the throughput results for varying number of users and inter-cell pathlosses. Single AP throughput is provided for reference as indicated by the blue circle. We observe: O1. Cell total throughput is limited to single cell AP when the pathloss is such that the ED is active. See Figure with PL=64 dB where the out of cell RSSI is -50 dBm, as the throughput curves overlap. The MAC operates nearly ideally since as described by Proposition 1 the ED quickly resynchronizes all the STAs when collisions or fading causes synchronization loss. O2. Cell total throughput grows with increase separation when the ED is not active. Observed in curves where PL is 86, 96, 106 dB. The ED threshold is not met by the out-of-cell transmissions which are received at -72, -82, and -92 dBm. respectively. This is 1 dB above the minimum required to decode the packet header so the VCS is effective in the AWGN channel. Since probability of VCS failure increases with average pathloss, and VCS failure according to Propositions 2a and 2b leads to overlapped transmissions, and these increases throughput being from separated cells. O3. Initial rise in throughput vs. number of users. This behavior may be attributed to increase in collisions that cause overlapped transmissions according to Proposition 2a. O4. Subsequent decay in throughput vs. number of users. This is due to in cell collisions. O5. Decay in throughput falls according to Bianchi’s model for single cell & when ED is active. Note the throughput was normalized at single user to give consistent amount of overhead. NS-3 results closely follow Bianchi’s model, thus validating NS-3’s CSMA model in ideal single cell scenarios.
5 neighbor is every other cell for reuse 4. A total 36 of APs and 4 STAs per AP, for total of 144 STAs were simulated. Indoor pathloss at distance r from the source is given by [6]:
35
Total Throughput (Mbps)
30
PG =
25
15
5
0 0
1 AP 2 AP PL=64 2 AP, PL=86 2 AP PL=96 2 AP, PL=106 10
20
30 40 50 Number of Users (Total)
60
70
Figure 5. Two cell throughput vs. number of users for different values of inter-cell pathloss. 70 4 AP PL=64 4 AP PL=81 4 AP, PL=86 4 AP PL=96 4 AP, PL=106
Total Throughput (Mbps)
60
50
30
Bianchi
10
0 0
20
(1)
40 60 80 Number of Users (Total)
100
B. Results & Analysis The relative capacity providing efficiency E of an AP is defined as fractional change in area capacity divided by the fractional change in cell density. E is also the area capacity C1 at new density D1 divided by the area capacity at the original density, i.e.
E=
40
20
1 −κd r κd 4π r + 4π r 2 e
where λ is the wavelength in meters, and κd is the absorption coefficient taken. Using (1) with κd =0.24, along with lognormal shading fading of 4 dB, propagation is computed between all STAs and APs. Fast fading due to mobility is a random process according to the Jakes Doppler spectrum. Given only the average pathloss via (1) the range for ED is 15 meters.
20
10
λ2 4π
120
Figure 6. Four cell throughput vs. total number of users for different values of inter-cell pathloss. IV. MULTI-CELL CAPACITY SCALING WITH DENSITY A. Experiment Design APs are placed on a square grid modeling a dense frequency planned Wi-Fi network. The grid is wrapped around to eliminate edge effects, i.e. the bottom cells see interference from the top. Figure 7 shows the user locations (STAs) around the APs and the reuse plan 12. To simplify the traffic model, traffic is full-buffer (not a limitation of NS-3), which may roughly correspond to a scenario of FTP download to each of the stations. Representing the majority of deployed devices the AP and STA transmit at fixed RF power Frequency reuse puts certain amount of distance between the co-channel cells, reducing interference but reducing the bandwidth available per cell. An aggressive reuse plan with 4 channel groups (reuse 4) and less aggressive plan with 12 channels (reuse 12) is simulated. The number of 5 GH unlicensed band channels varies with local regulation. 12 channels for total of 240 MHz bandwidth is assume here. With reuse 4 each AP has 3 separate 20 MHz channels, whereas for reuse 12 each AP only has one 20 MHz channel. Only the co-channel cells are simulated, and the nearest
C1 C0 , / D1 D0
(2)
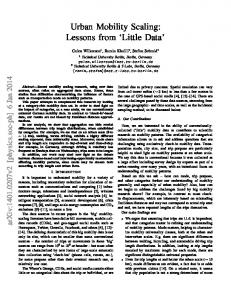
and E=1 means that a new cell brings 100% of the throughput at the original density. The basic data, i.e. user throughputs, from which scaling is derived is shown in Figure 8 for reuse 12. The CDFs illustrates the effect of shrinking ISD on throughputs and fairness. The worsening of these key metrics is due to decrease in SINR. At 40 m ISD where the cells should be operating ideally the throughput ratio between worse users (10%) and the best (90%) is 1.3. At 10 m ISD this ratio is much worse at 2.6. Area capacity is plotted as a function of relative cell density in Figure 9. The relative cell density is cell area divided by the reference cell area at 40 m ISD. Initially the area capacity of aggressive reuse (reuse 4) is much higher than less aggressive (reuse 12), but with densification, the capacity saturates quicker and the advantage diminishes. Initially increasing cell density provides full area capacity gains with E≈1. As the cells begin to overlap, the E decreases to about 0.65, i.e. for every new cell added the capacity increases by 65% as it would in the low density regime. The area capacity trend is composed of two effects: MAC interaction and SINR degradation. To separate the effects we compare Wi-Fi area capacity to the capacity of regular licensed band FDD LTE. FDD LTE downlink may transmit continuously in reuse 1 fashion. This is not to be confused with LTE-U or LAA which has a listen-before-talk feature for use in the unlicensed band. Using the downlink SINRs obtained as if all APs were broadcasting at full power, a rate mapper is applied to compute the “LTE” rates. For comparison the LTE system is only given one 20 MHz channel vs. the 240 MHz given to the Wi-Fi network. Despite 1/12 the bandwidth the initial LTE area capacity is actually about the same as 802.11a Wi-Fi reuse 4. Note that 802.11n due to MIMO and aggregation will have higher starting point. While the absolute throughput values will vary as both LTE
6 and Wi-Fi Fi evolve, results show LTE area capacity also reduced due to interference, with E about 0.8.
rea capacity vs. density for Wi-Fi for Figure 9: Downlink area reuse 4 and reuse 12, along with LTE at reuse 1. CONCLUSIONS The he VCS and ED mechanisms jointly prevent in-cell collisions, but for separated cells the VCS permits cells to lose synchronization. Results show no hard limit on downlink area capacity that would be expected under an ideal 802.11 MAC. Wi-Fi Fi area capacity grows with densification but bu each new cell provides less capacity than a cell at the original origina density. This penalty is due to decreasing SINR and partial MAC coordination. Future work would focus on performance scaling for uplink and bi-directional directional TCP traffic. REFERENCES [1] [2]
Figure 7:: Square cell centers with frequency plan of 12. Red circles are the APs and blue circles are STA locations. CDF of Downlink Full-Buffer Throughput 1 0.9 0.8
10m 15m 20m 30m 40m
[3] [4]
[5] [6]
ISD ISD ISD ISD ISD
[7]
F(x)
0.7 0.6
[8]
0.5
[9]
0.4 0.3
[10]
0.2
[11] [12]
0.1 0 0
1
2
3 4 5 User Throughput (Mbps)
6
7
8
Figure 8: User throughputs at 10 to 40 m ISD and reuse 12 12.
[13]
[14]
400
[15] LTE Reuse 1 802.11a Reuse 4 802.11a Reuse 12
Capacity Mbps / Area of Cell at 40m ISD
350
[16]
300
[17] 250
[18] [19]
200 150
[20]
100
[21] [22]
50 0 0
2
4
6 8 10 12 Relative Density (to 40m ISD)
14
16
[23]
IEEE Std. 802.11 Part 11: Wireless LAN Medium Access Control (MAC) and Physical sical Layer (PHY) Specifications. Specifications O. Bejarano, E. W. Knightly, and M. Park, “IEEE 802.11ac: from channelization to multi-user MIMO,” IEEE Comm. Co Mag., Oct. 2013. IEEE Std 802.11aa-2012.. Section 10.27 Procedures to manage OBSS. B. Nardelli, J. Lee, K. Lee, Y. Yi, S. Chong, E. Knightly, and M. Chiang, “Experimental evaluation of optimal o CSMA,” Proc of IEEE INFOCOM 2011. J. Ling, and D. Chizhik, “Capacity Capacity scaling of indoor pico-cellular pico networks via reuse,” IEEE Comm. m. Letters, Letters Feb. 2012. D. Chizhik, J. Ling, and nd R. A. Valenzuela, “Radio wave diffusion indoors and throughput scaling with cell density,” Proc. of IEEE Trans. On Wireless Comm., Sept. 2012. M. Ding, D. Lopez-Perez, G. Mao, P. Wang, and Z. Lin, “Will the area spectral efficiency monotonically grow as small cells go dense?” URL: http://arxiv.org/abs/1505.01920. C. Kai and S. C. Liew, “Towards a more accurate carrier sensing model for CSMA wireless networks,” Proc. of IEEE ICC, ICC 2010. Y. Bejerano, H-G. Choi, and S-J. Han, Han “Fairness analysis of physical layer capture effects in IEEE 802.11 networks,” Proc IEEE WiOPT, May 2015. 3 bug 1726 “Minstrel rate manager doesn’t save state”. URL: NS-3 https://www.nsnam.org/bugzilla/show_bug.cgi?id=1726. https://www.nsnam.org/bugzilla/show_bug.cgi?id=1726 Radiotap URL: http://www.radiotap.org/ G. Bianchi, “Performance analysis of the IEEE 802.11 distributed coordination function,” IEEE JSAC,, March 2000. N. Khademi, M. Welzl, and S. Gjessing, Gjessing “Experimental evaluation of TCP performance in multi-rate rate 802.11 WLANs,” Proc of IEEE WoWMoM, 2012. J. Hakegard, “Multi-Cell Cell WLAN coverage and capacity,” c Telektronikk 3/4.2006. URL: http://www.telenor.com/ wp-content/ wp uploads/ 2012/ 05/ T06_3-4.pdf Kang, D. H., Sung, K. W., and Zander, J.. "Attainable user throughput by dense Wi-Fi deployment at 5 GHz." Proc of IEEE PIMRC, 2013. S. Choudhury, et. Al, “Impact Impact of CCA adaptation on spatial reuse in dense residential scenario,” IEEE 802.11-14/0861r0, 802.11 July 14 2014. O. Kaya, D. Calin, H. Visvanathan, “On “ the performance of stadium high density carrier Wi-Fi Fi enabled LTE small cell deployments,” deployments Proc. of IEEE WCNC, March 2015. 802.11ax TG URL: http://www.ieee802.org/11/Reports/tgax_update.htm “HIGH-DENSITY WI-FI FI BENCHMARK TEST Aruba Networks APAP 135 and Cisco AP3602i” URL: www.arubanetworks.com J. Ling, S. Kanugovi, S. Vasudevan, and A. Pramod, “Enhanced capacity and coverage by Wi-Fi Fi LTE integration,” IEEE Comm. Mag., vol. 53, no. 3, pp. 165–171, 171, March 2015. NS-3. URL: https://www.nsnam.org/ S. Papanastasiou, J. Mittag, E. Strom, and H. Hartenstein, “Bridging the gap between physical layer emulation ation and network simulation,” Proc. of IEEE WCNC, 2010. K. Mandke, and S. M. Nettles,, “Using software-defined software radio to validate wireless models in Simulation,” Proc. of IEEE MASCOTS, MASCOTS Aug. 2012.