Alternative structural layouts for wind turbine blades are investigated with the ... edge reinforcement and the offset spar cap topology are both more efficient in ...
AIAA 2012-1502
53rd AIAA/ASME/ASCE/AHS/ASC Structures, Structural Dynamics and Materials Conference
20 23 - 26 April 2012, Honolulu, Hawaii
Wind Turbine Blade Structural Efficiency Neil Buckney,∗ Steven D. Green,† Alberto Pirrera‡ and Paul M. Weaver§
Downloaded by Paul Weaver on April 30, 2013 | http://arc.aiaa.org | DOI: 10.2514/6.2012-1502
University of Bristol, Bristol, BS8 1TR, UK Alternative structural layouts for wind turbine blades are investigated with the aim to improve their design, minimize weight and reduce the cost of wind energy. To obtain the new concepts, topology optimization is performed on a 45 m wind turbine blade. Additionally, shape factors for non-symmetric sections under biaxial bending are developed to evaluate the results in terms of ability to minimize deflection and stress. The topology optimization results in a concept which transforms along the length of the blade, changing from a design with spar caps at the maximum thickness and a trailing edge mass, to a design with offset spar caps towards the tip. The shape factors indicate that the trailing edge reinforcement and the offset spar cap topology are both more efficient in minimising deflection and stress. In summary, an alternative structural layout for a wind turbine blade has been found and shape factors have been developed, which can quantitatively assess the structural efficiency under asymmetric bending.
Nomenclature A C d E f I K ˜ K M p u v, w
Area Compliance Diameter Young’s modulus Load vector Second moment of area Stiffness matrix Modified stiffness matrix Bending moment Penalty factor Displacement vector Displacement in y and z-directions
I. A.
vf Z δtip θtip φd φs ρ σ
Volume fraction Section modulus Tip deflection Tip rotation Deflection shape factor Stress shape factor Fictional density Bending stress
Subscript e 0
Element number Reference beam
Introduction
Wind Energy
n order for wind energy to be competitive in the market, it is important that its cost is minimized. One way Iincreases, to achieve this is to continue the present trend towards larger wind turbines, because, as their rated power the cost per kW decreases. This is because the power generated by a wind turbine is theoretically 1
proportional to the square of the blade length. On the other hand though, the blade mass increases with the cube of the length.1 This square-cube law means that the blade mass grows faster than the energy output as ∗ PhD Student, Advanced Composite Centre for Innovation and Science (ACCIS), Dept. of Aerospace Engineering, University Walk, Bristol, BS8 1TR, UK. AIAA Student Member. † PhD Student, Advanced Composite Centre for Innovation and Science (ACCIS), Dept. of Aerospace Engineering, University Walk, Bristol, BS8 1TR, UK. ‡ Post-Doctoral Research Assistant, Advanced Composite Centre for Innovation and Science (ACCIS), Dept. of Aerospace Engineering, University Walk, Bristol, BS8 1TR, UK. AIAA Member. § Professor in Lightweight Structures, Advanced Composite Centre for Innovation and Science (ACCIS), Dept. of Aerospace Engineering, University Walk, Bristol, BS8 1TR, UK. AIAA Member.
1 of 19 Copyright © 2012 by Neil Buckney. Published by the American Institute of Aeronautics and Astronautics, Inc., with permission.
American Institute of Aeronautics and Astronautics
Downloaded by Paul Weaver on April 30, 2013 | http://arc.aiaa.org | DOI: 10.2514/6.2012-1502
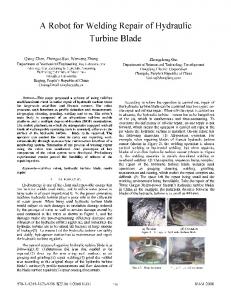
Figure 1. Conventional wind turbine blade design.
size increases, and is the basis for speculation of a size limit for wind turbines.2, 3 In reality, through improved design methodology, the blade mass of current turbines has been found to be growing at an average exponent of 2.3 as opposed to 3.4 Despite this, as wind turbines have grown in size, the loads due to self-weight have become increasingly influential. Yet, the basic topology has remained unchanged. Larger blades are also more efficient from manufacturing and financial viewpoints. Furthermore, lightweight designs can benefit the entire wind turbine through decreased mass-induced loads. Indeed, the cost of the rotor may represent 20% of the total, but decreasing the mass can have a significant effect by reducing the material demands, and thereby cost, of the nacelle, tower, and foundations.5 For these reasons, as blade size increases, it becomes more important to increase structural efficiency. It is thought that the current blade topology may have reached maturity and that without major changes there will be no significant weight and cost reduction.6 By improving the structural efficiency of the blades through new design concepts, wind turbines could potentially be made larger and produce more energy, which would result in lowering the cost of electricity. B.
Current Wind Turbine Blade Design
Before investigating new structural layouts, current designs are considered. As seen in Fig. 1, the conventional design of a wind turbine blade consists of two structural skins and a box spar beam.7 The skins form the aerodynamic profile of the blade. Typically, they are constructed from sandwich panels to resist buckling and are bonded at the leading and trailing edges. The spar provides the stiffness and strength requirements of the blade, performing as a beam while simultaneously resisting buckling phenomena. The caps are often thick hybrid composites of carbon and glass fibre, whereas the webs are often sandwich panels which typically carry shear forces. Sandwich panels have become widely used for their ability to provide high bending stiffness, strength and buckling resistance (per unit weight).3 C.
Aims and Objectives
For all of the aforementioned reasons, there is a clear need to improve the structural efficiency of wind turbine blades, so the aim of this study is to investigate alternative structural configurations which would make wind energy a more cost-effective source of power generation. The first step to finding alternative designs has been to perform topology optimization on a 45 m blade from a 3 MW wind turbine. The topologies resulting from these analyses were then studied with respect to their bending response. Their structural efficiency was quantitatively assessed using shape factors, i.e. novel coefficients purposely developed to account for the asymmetric bending behavior of the blades.
II. A.
Topology Optimization
Background
Topology optimization was used to generate alternative structural design concepts for the benchmark wind turbine blade. Topology optimization, also known as layout or generalized shape optimization, is a nonparametric technique used to determine the best layout to sustain loads in a given design domain. In this context, the structural layout refers to the topology, shape and sizing of the benchmark design.
2 of 19 American Institute of Aeronautics and Astronautics
Downloaded by Paul Weaver on April 30, 2013 | http://arc.aiaa.org | DOI: 10.2514/6.2012-1502
In a more conventional approach, the topology of a design is chosen through intuition or from preexisting designs.8 Instead, topology optimization provides a tool which can determine the optimal material distribution at an early stage of design. This can significantly reduce development time and be an effective way to understand the load paths within the component. Topology is often followed by a sizing optimization which produces quick and effective design solutions.9 The choice of topology in a design is done at the conceptual phase and is critical as typical sizing optimization processes cannot alter it during the solution process.8 Three previous examples of topology optimization of a wind turbine blade are known. The first is a part of a wider study proposing a new design concept for a 75 m long thermoplastic blade.10 In this work, a preliminary study first undertook topology optimization on a section of the blade and considered how this may be adaptable to thermoplastic composite manufacturing.11 Topology optimization was then performed on the inner half of the full blade and then the results were interpreted to create a shell model upon which a sizing optimization was performed.12 The results led to a design using ribs, multiple skin panels, and spars. The second study conducted topology optimization of a wind turbine blade, inspired by similarities in function and structure to plant leaves.13 Both of these studies minimized the compliance with volume fraction constraints and the results both showed spar caps approximately at the maximum thickness with trailing edge ribs. Lastly, the third investigation accounted for the effects of design-dependent wind loads in the topology optimization of an off-shore wind turbine tower.14 The results presented in this section are based on an earlier study which involved topology and sizing optimization of a wind turbine blade. Further details of the topology optimization may be found in Buckney et al.15 In the present work, the method used in the topology optimization was the Solid Isotropic Material with Penalization (SIMP), also known as the density method.16 In this approach, the design variables are a fictional density of the material, which can vary from 0 to 1 in order to modify the stiffness using ˜ e = ρpe Ke , K
(1)
˜ e and Ke are the real and modified stiffness, p is the penalty factor and ρe is the fictional density. The where K penalization factor is used to avoid densities of intermediate values and force the solution to be comprised of elements with a density of either 0 or 1. In other words, the material is made to be either present or void. Even so, despite the use of the penalty factor (which typically ranges from 2 to 4), elements with intermediate values of density can still persist. B.
Model
In this study, the finite element (FE) topology optimization was performed using Altair Optistruct.17 Initial investigations were performed on a small section of the blade in order to ascertain suitable problem formulations, which were then applied to a more complete model. This helped to determine what optimization controls should be set, what types of analyses to run (i.e. minimize volume or minimize compliance) and any other problems. The geometry of the blade was based on an existing design. The computer program airfoil, along with chord, thickness and twist data, were used to generate coordinates for naca 6-series airfoils for 50 sections equally distributed along the blade.18 The blade geometry data are shown in Fig. 2. In this study, bending out of the rotor plane and bending in the rotor plane are respectively referred to as flapwise and edgewise bending, as shown in Fig. 3. Finding the material distribution within the design domain was the aim of the optimization. As such, the element size was effectively the resolution of the resulting structure. The problem of low resolution can be exacerbated in a wind turbine blades as they are thin, lightweight, and have low volume fraction. Inboard, there are large changes in chord, twist, thickness, and a complex transition from the circular root section to an airfoil. Outboard, the twist, relative thickness of the airfoil, and overall area of the cross-section are decreasing. For this reason and in order to capture potential changes in topology along the length, the entire blade was modeled. Topology optimization is computationally intensive, particularly on a large model with complex geometry such as a wind turbine blade. This meant that there is a compromise between having small enough elements to capture the topology and the computational limits set by memory and time constraints. The outer surface of the blade was meshed with 210, 000 TRIA3 (three-node triangular) shell elements. These elements on the surface of the blade were used to apply pressure loads. In reality, the skin is always
3 of 19 American Institute of Aeronautics and Astronautics
Downloaded by Paul Weaver on April 30, 2013 | http://arc.aiaa.org | DOI: 10.2514/6.2012-1502
Figure 2. Chord, thickness and twist of the blade.
required, so a skin thickness of 2 mm was defined. This structural skin is outside of the design space and is fixed throughout the optimization. The inner volume of the blade was meshed with 2.46 million TETRA4 (four-node tetrahedral) solid elements which formed the design space of the topology optimization problem. Tetrahedral elements were chosen for two main reasons. Firstly, they are efficient in meshing sharp features such as the narrow trailing edge. Secondly, when compared to a hexahedral element mesh with similar edge size, tetrahedral meshes have a larger number of elements with respect to the number of nodes. This maximizes the element density for a given FE model size and hence maximizes the resolution within the computational limits. The blade transitions from very large sections near the root to small sections at the tip, so a mesh bias was used along the length to decrease element size approaching the tip. This meant that the element size was proportional to the chord and thickness at that section. This was required to avoid an excessively fine mesh near the root or a coarse mesh at the tip. The solid elements that made up the design space were given properties of a quasi-isotropic layup of a typical high strength carbon fiber equivalent to E = 54 GPa, G = 21 GPa and ν = 0.270. The shell elements of the skin were given the same properties. Real designs use orthotropic materials with more reinforcement along the blade length but, it was not possible to apply these properties in the topology optimization. The loading on a wind turbine blade is stochastic and has components from the following sources: aerodynamic, gravitational, inertial (centrifugal and gyroscopic) and operational (grid-failure, braking, etc.).10 Loading data for the blade were available in the form of a moment distribution along the blade length for extreme forward and reverse loads in the flapwise and edgewise directions (Fig. 4). Forward flapwise bending causes compression on the suction side, and forward edgewise bending causes compression in the trailing edge. In addition to this, a map of combined load conditions from actual blade data were provided (Fig. 5). The data have been presented generically with the moment distribution normalized to the maximum value (forward flapwise bending). The map of combined loads shows the perimeter of the data cloud of com-
4 of 19 American Institute of Aeronautics and Astronautics
Downloaded by Paul Weaver on April 30, 2013 | http://arc.aiaa.org | DOI: 10.2514/6.2012-1502
Figure 3. Wind turbine blade model: Side and top view.
Figure 4. Normalised moment distribution.
bined load points with references to the extreme values. From the combined load map, seven load cases were identified for the analysis. The first four are the extreme bending moments which are taken to occur independently. The final three load cases are selected as the extreme combined loads as shown on the map. C.
Optimization Problem Definition
The objective of the optimization was to minimize the compliance with a volume fraction constraint applied. The compliance can be considered as the reciprocal of the stiffness. It was minimized by minimizing the strain energy of the structure 1 with Ku = f , (2) C = uT f 2 where C is the compliance and u and f are, respectively, the nodal displacement and load vector. The stiffness matrix K depends on the stiffness of the elements. As there were seven load cases, each with its own compliance, the objective was to minimize the maximum compliance. By setting a volume fraction constraint this optimization found the stiffest layout for a given mass. The volume fraction was chosen as 0.125 based on the volume and mass of a real wind turbine blade. In addition to the volume fraction constraint, a maximum tip displacement of 9 m in the flapwise direction was applied to ensure adequate tower clearance. There was also a limit of 2◦ for the rotation of the tip about the radial axis, so that aerodynamics were not adversely affected. A penalty factor of 2.5 was used and checkerboard control applied. Checkerboard control generally yields a larger number of semi-dense elements around fully dense elements, but avoids the 5 of 19 American Institute of Aeronautics and Astronautics
Downloaded by Paul Weaver on April 30, 2013 | http://arc.aiaa.org | DOI: 10.2514/6.2012-1502
Figure 5. Loading map of the wind turbine blade.
Table 1. Load case summary.
Load Case 1 2 3 4 5 6 7
Description Forward Flap Reverse Flap Forward Edge Reverse Edge Forward Flap & Forward Edge Reverse Flap & Forward Edge Reverse Flap & Reverse Edge
Multiplication factor for extreme load Fwd Flap Rev Flap Fwd Edge Rev Edge 1 1 1 1 1 1 1 0.5 0.5 1
emergence of checkerboard-like patterns in the results. Checkerboard control is typically applied in topology optimization as these patterns are not optimal microstructures but are the results of numerical noise in the FE analysis.19, 20 The problem formulation is summarized in Eq. (3), where vf is the volume fraction, δtip is the tip deflection and θtip is the tip rotation: Objective function: Subject to constraint functions:
D.
Min(Max) Compliance, vf ≤ 0.125, δtip ≤ 9 m, θtip ≤ 2◦ .
(3)
Results
The results from the topology optimization are displayed in the form of contour plots showing the density of the elements, with high density regions indicating where material is required. Figure 6 shows a top view of the blade with elements of density less than 0.05 hidden. Also shown are Sections A and B, which show all element densities. These are situated at 25% and 75% of the blade length, respectively. Similarly to a conventional design, there are spar caps running along the length of the blade. Near the root they are
6 of 19 American Institute of Aeronautics and Astronautics
Downloaded by Paul Weaver on April 30, 2013 | http://arc.aiaa.org | DOI: 10.2514/6.2012-1502
Figure 6. Minimize compliance with volume fraction constraint. Density less than 0.05 hidden.
situated at approximately the maximum thickness of the airfoil section. Moving out towards the blade tip, the topology changes with the appearance of a separate spar cap structure on the upper surface, nearer to the trailing edge. As this new spar cap grows in width, the original upper spar cap diminishes in size and eventually disappears. This effectively results in a new spar cap position in which they have become offset from the point of maximum thickness as the upper spar cap is located towards the trailing edge. (This spar cap position has also been seen in parallel work by Pirrera et al.21 ) The most obvious difference to a typical blade design is the reinforcement at the trailing edge of the blade. Starting at the root, this decreases in size along the length and eventually disappears as can be seen in Section B. At the root, both the upper and lower spar caps form from a combined mass at the leading edge. In this transitional region, where the cross-section transforms from a circular root to an airfoil shape, there is a diagonal structure on the upper and lower surface which connects the trailing edge mass and spar caps. Rib-like structures can be seen in the first half of the blade which form at approximately 45◦ to the spar caps. In the regions where they appear, these features provide the only connection between the high density features, which suggests that they carry shear loads. Two of the main functions of a rib are to maintain the aerodynamic cross-section and to increase buckling stress by providing end restraints.22 As the analysis was linear and did not have buckling constraints, these features will be called shear posts to distinguish function. These shear posts were most prominent in the sections of the blade with the largest thickness and twist.
III. A.
Structural Efficiency
Shape Factor Background
Following the topology optimization, the layout of the blade was taken and evaluated to understand why it appeared as the solution. This was done using shape factors, as they are a useful way to determine the efficiency of material usage in a structure.23 Shape factors are dimensionless parameters, depending on shape and not scale, which compare the efficiency of a shaped section to that of a simple reference section of equal area (in this case a circular cross-section). A shape factor greater than one indicates a more efficient shape than the reference section; conversely, a shape factor less than one is less efficient. Due to the asymmetric bending behavior, it was vital to have a clearly defined bending convention. The radial, edgewise and flapwise directions are now defined as the x, y and z-axes using the right-hand rule (Fig. 7). A positive Mz (flap moment) causes tension in the y-direction (edgewise); positive My (edge moment) causes compression in the z-direction (flapwise). With this bending convention, the moment
7 of 19 American Institute of Aeronautics and Astronautics
� � �
���
�
���
� �
�
Figure 7. Bending coordinate system.
Downloaded by Paul Weaver on April 30, 2013 | http://arc.aiaa.org | DOI: 10.2514/6.2012-1502
curvature relationship is d2 w My Iz − Mz Iyz , = 2 2 ) dx E(Iy Iz − Iyz
(4a)
d2 v Mz Iy − My Iyz , = 2 ) dx2 E(Iy Iz − Iyz
(4b)
where M is the moment, E is the Young’s modulus and, I is the second moment of area (with the subscript indicating the relevant axis). The bending stress in the x-direction (radial) is σx =
Mz (Iy y − Iyz z) My (Iz z − Iyz y) + , 2 2 Iy Iz − Iyz Iy Iz − Iyz
(5)
where z and y denote the distance from centroid in the flapwise and edgewise directions, respectively. B.
Deflection Shape Factor
When evaluating the performance of a structure under bending loads, it is typical to consider its stiffness, which is proportional to the Young’s modulus and the second moment of area.23 This is suitable for symmetric sections under simple loading conditions, but this ceases to be the case for wind turbines which undergo asymmetric bending. For example, coupling between the flapwise and edgewise moments through the product term of the second moment of area means that the resulting behavior is not immediately obvious: a deflection due to a positive flapwise moment can be counteracted by a deflection in the opposite direction caused by a positive edgewise moment. The flapwise deflection is the critical parameter as the blade tip must have adequate clearance from the tower.24 For this reason, the flapwise deflection was used to create a shape factor as opposed to stiffness as this is the critical factor in the design. The deflections are complicated by the biaxial loading and the increased number of terms due to asymmetrical geometry. From Eq (4), the moment curvature relationship in the flapwise direction is22 d2 v Mz Iy − My Iyz . (6) = 2 ) dx2 E(Iy Iz − Iyz Since the curvature is proportional to the deflection of the beam, it is used to evaluate the efficiency in minimising the deflection. This is achieved by comparing the curvature to that of a reference beam of equivalent area. In order to to so, we define � � 2 � � 2 � � � � 2 E(Iy Iz − Iyz ) d v d v Mz Iy − My Iyz φd = / , (7) = 2 ) dx2 0 dx2 E(Iy Iz − Iyz Mz Iy − My Iyz 0 which is the shape factor for efficiency in minimising the deflection in the flapwise direction. The reference beam, which is denoted by the subscript 0, is a circular beam and was chosen due to its inherent axial symmetry. This means the second moment of area terms will remain constant no matter the cross-sectional axis of interest. The second moment of area is described with respect to its cross-sectional area: I0 =
A2 πd4 = 64 4π 8 of 19
American Institute of Aeronautics and Astronautics
(8)
For the reference beam Iy = Iz = I0 and Iyz = 0. These can now be substituted back into the expression for the shape factor. If only one material is considered, the Young’s modulus terms cancel, as φd =
Downloaded by Paul Weaver on April 30, 2013 | http://arc.aiaa.org | DOI: 10.2514/6.2012-1502
C.
2 2 ) ) Mz (Iy Iz − Iyz 4πMz (Iy Iz − Iyz = . I0 Mz Iy − My Iyz A2 Mz Iy − My Iyz
(9)
Stress Shape Factor
A similar procedure will now be used to find a shape factor to evaluate the efficiency of the section in minimising stress under given loading conditions. In a simple beam, shape affects stress through the section modulus, Z = I/ym , which is taken from the bending equation for a simple beam, where I is the second moment of area and ym is the maximum distance from the bending axis. A beam with a stress shape factor of 10 will have a maximum stress equal to a tenth of that in a solid circular section of the same area. To develop a shape factor for stress efficiency in asymmetrical bending, the first step was to manipulate the bending stress (Eq. (5)) so that it only had one term. This was achieved rotating the coordinate system to align with the resultant moment MR (Iy� y � − Iyz� z � ) σx = , (10) 2 Iy� Iz� − Iyz � where MR is the resultant moment and the rotated coordinates system is indicated by prime. The section modulus, Z, is now redefined to account for the asymmetrical bending Z=
(Iy� y � − Iyz� z � ) , 2 Iy� Iz� − Iyz �
(11)
The reference section modulus can be simplified due to the conditions of the second moment of area. The maximum distance from the bending axis for any applied load is the radius Z0 =
A2 A3/2 I0 = = √ . r 4πr 4 π
(12)
The strength efficiency of the shaped beam is then calculated as the ratio between its modulus and the modulus of the reference beam with equivalent cross-sectional areas √ 2 � Z 4 π Iy� Iz� − Iyz φs = . (13) = 3/2 � �) � � Z0 (I y − I z A y yz Burgess et al. use a similar method for beams with misaligned loads but neglects the product second moment of area.25 While Iyz is zero when the axes of symmetry are coincident with the coordinate system, it ceases to be zero when this is not the case. The exception is for beams where Iy = Iz , for example, the circular reference beam. D.
Results
With the shape factors for deflection and stress now defined, they were applied to the results of the topology optimization. The purpose of this analysis was not to create a final wind turbine design but to evaluate the topology optimization results. To calculate the shape factors, section models based on the high density material of the topology optimization were created. The high density material was used for the sections as this is the primary part of the structure which is resisting the bending loads and allows a discrete model to be used. The section properties were then calculated using an elemental area method for asymmetric bending.26 Stress, curvature, and the neutral axis were calculated.22 The shape factors were developed from the methods given by Weaver and Ashby.23 The sections at 25% and 75% of the blade radius (herein called inboard and outboard) were compared to sections with more conventional spar cap positions (Fig. 8). In the topology optimization, only a limited number of load cases could be applied due to the high computational expense. On the other hand, the calculation of the shape factors is not demanding. This allowed the sections to be evaluated for the entire range of loads seen in the load cloud (Fig. 5). Both of the shape factors are only dependent on the ratio of the flapwise and edgewise moments, regardless of their magnitude. In other words, they only depend on the direction of the resultant moment. This 9 of 19 American Institute of Aeronautics and Astronautics
(a) Conventional @ 25% radius
(b) Concept @ 25% Radius
(c) Conventional @ 75% radius
(d) Concept @ 75% radius
Downloaded by Paul Weaver on April 30, 2013 | http://arc.aiaa.org | DOI: 10.2514/6.2012-1502
Figure 8. Blade sections used for comparison.
meant that it was convenient to work in polar coordinates, with angular coordinate and radius representing respectively the angle and magnitude of the resultant moment.√For example, if Mz = 1 and My = 1, the angle of the resultant moment would be 45◦ , and its magnitude 2. Equivalently, the forward flapwise only load case is at an angle of 0◦ ; the forward edgewise only load case is at 90◦ . The load cloud in polar coordinates is shown in Fig. 9. Results are presented in Figs. 10 to 15. The seven load cases, which were used in the topology optimization, are shown on the polar plots, highlighted by radial lines. Points which lie on the same radial line are subject to the same load case. While it is convenient to work in polar coordinates, the results for the flapwise deflection shape factor takes the form of a tan curve, which is simpler to plot in Cartesian coordinates, with the resultant moment angle α on the horizontal axis and the shape factor φd on the vertical axis. The results for the inboard and outboard sections are shown in Figs. 10 and 11, respectively. The conventional topology is shown as a red dashed line and the concept topology optimization result as a solid blue line. The result is initially non-intuitive but it can be understood by considering the form of the shape factor. The circular reference beam is axisymmetric, which means that Iy = Iz and Iyz = 0, independently from the coordinate system. In other words, there is no coupling between the flapwise and edgewise moments: when an edgewise moment is applied, the deflection in the flapwise direction is zero. For sections of general shape, there is a still a condition where the applied loads result in zero flapwise deflection. This occurs when the neutral axis aligns with the edgewise axis. As the neutral axis begins to align with the edgewise axis, the denominator of the shape factor tends towards zero and hence the shape factor tends to infinity. The shape factor becomes asymptotic with the α which causes this condition. It is also possible for the flapwise deflection shape factor to become negative near asymptotic values. This indicates that the deflection of the beam is in the opposite direction to that of the reference beam. In general, it can be seen that for the inboard section (Fig. 10), the concept has larger deflection shape factors. Importantly, the concept has larger values for all of the combined load cases. As the concept topology shape factor becomes asymptotic at a smaller α, this means the shape factor is larger for the critical load case of forward flap, forward edge (load case 5). Table 2 shows the numerical results for the seven load cases which are also indicated on the plot. Table 2. Shape factors for efficiency in minimizing flapwise deflection under asymmetrical bending.
Topology Conventional @ 25% Concept @ 25% Conventional @ 75% Concept @ 75%
1 10.1 10.9 4.1 3.8
2 10.1 10.9 4.1 3.8
Load case 3 4 5 0 0 11.1 0 0 13.1 0 0 4.2 0 0 4.5
6 9.6 9.8 4.1 3.5
7 12.5 17.0 4.3 5.6
As with the inboard sections, the outboard concept shape factor (Figure 11) become asymptotic at a smaller α. In contrast to the inboard section, the outboard concept topology shape factors are not all larger than the conventional topology. The flapwise only load cases (load cases 1 and 2) have marginally smaller shape factors; conversely the shape factor for load case 5 is slightly larger. 10 of 19 American Institute of Aeronautics and Astronautics
Downloaded by Paul Weaver on April 30, 2013 | http://arc.aiaa.org | DOI: 10.2514/6.2012-1502
���
�
Figure 9. Polar plot of the load cloud with the seven load cases marked. The angular coordinate represents the angle of the resultant moment. The radial coordinate gives the magnitude of the resultant moment.
The flapwise deflection shape factor is based upon the critical deflection of the wind turbine blade, required for tower clearance. The objective of topology optimization was to minimize the compliance which is not direction specific. Therefore, it was also useful to look at the resultant deflection shape factor. This was calculated in the same way as previously, but with a coordinate transformation to align the z-axis with the neutral axis. Polar plots of the resultant deflection shape factor are shown in Figs. 12 and 13. Looking at the inboard results it can be seen that the conventional topology is more efficient at reducing edgewise deflection over flapwise deflection. The concept topology has larger values for flapwise orientated moments but smaller for edgewise moments. At an α value of approximately 75◦ and 255◦ , the shape factor peaks to a value of 96. This occurs at the point where the resultant moment aligns with the principal second moment of area which is large due to the trailing edge reinforcement. The outboard resultant deflection shape factors are shown in Fig. 13. The shape of the plot for the concept topology is very similar to the inboard concept, though the magnitudes are smaller. The shape factor peaks at 23 at an α of approximately 80◦ and 260◦ . For the conventional topology, the edgewise shape factor is larger than for flapwise loading. The shape of the plot is almost symmetric about the flapwise and edgewise direction, as is the geometry of the section itself. The polar plots for the stress shape factors are shown in Figs. 14 and 15. As the stress shape factor is dependent on the distance from the centroid, the maximum value for each load condition is used. For the inboard sections, it can immediately be seen that the shape factors for the concept are larger for edgewise loads but slightly smaller for the flapwise load case. Despite this, the shape factor for the critical forwardforward load case (number 5) is significantly larger. The numerical values of the shape factors are given in Table 3. The stress shape factors for the outboard sections show that the shape of the plot is rotated to align with the resultant moment of the forward-forward load case. In contrast, the conventional section is aligned with
11 of 19 American Institute of Aeronautics and Astronautics
�
������� ������� �� �
�
�
��
�
������ � ��������
�
������ � �������� ������ �
������ �
������ � ��������
��������
�
�������� �
����
�
�
�
�
Figure 10. Flapwise deflection shape factors at a radius of 25%. The conventional design is shown as a red dashed line and the concept as a solid blue line. The seven load cases from the topology optimization are indicated on the plot.
�
������� ������� �� �
�
��
Downloaded by Paul Weaver on April 30, 2013 | http://arc.aiaa.org | DOI: 10.2514/6.2012-1502
�
������ � ��������
������ � ��������
������ �
������ �
������ � ��������
��������
��������
�
�
����
�
�
�
�
Figure 11. Flapwise deflection shape factors at a radius of 75%. The conventional design is shown as a red dashed line and the concept as a solid blue line. The seven load cases from the topology optimization are indicated on the plot.
12 of 19 American Institute of Aeronautics and Astronautics
������ � �
�� � � !�"�
��
���
��
� � ���� � � !�"�
�� #�� ���� � � !�"�
��
��
�
Downloaded by Paul Weaver on April 30, 2013 | http://arc.aiaa.org | DOI: 10.2514/6.2012-1502
���
#�� ����
#�� ���� #�� !�"�
� � ����
�
#�� !�"� ���
������� ������������
Figure 12. Resultant deflection shape factors at a radius of 25%. The conventional design is shown as a red dashed line and the concept as a solid blue line. The seven load cases from the topology optimization are indicated on the plot.
the flapwise only load case where the shape factors are thus larger. To further understand the behavior of the sections, bending stress contour plots have been generated for the load cases of the topology optimization. The contour plots are normalised to the maximum stress in that section, so they are merely used to compare the distribution of stresses as opposed to relative magnitudes. The stresses in the inboard and outboard sections are shown in Figs. 16 and 17. The figures also indicate the position of the first principal second moment of area (blue dashed line) and the neutral axis (red dashed line). The principal second moment of area is independent of the loading but the neutral axis changes for each load case. For the inboard sections, both the conventional and concept topology have principal axes at similar angles. The centroid of the concept is translated slightly further towards the trailing edge. The neutral axes show more variance. In general, the neutral axis of the concept is more aligned with the chord of the airfoil. The result of the neutral axis being more aligned with the chord line is that the stresses are more evenly distributed in the spar caps. For the outboard sections, the angle of the principal second moments of area differ. In the conventional section, it is almost aligned with the edgewise axis but in the concept is more rotated, at an angle similar to the sections at 25%. The neutral axis of the forward-flap load case (load case 1) is closely aligned to the chord of the airfoil in the conventional section but not in the concept. This results in a more even stress distribution in the spar caps. The opposite effect is seen for load case 5, with evenly distributed stresses in the concept but not the conventional topology.
13 of 19 American Institute of Aeronautics and Astronautics
������ ��
� ��� �!�
��
���
��
��� ���� ��� �!�
�� ��� ���� ��� �!�
Downloaded by Paul Weaver on April 30, 2013 | http://arc.aiaa.org | DOI: 10.2514/6.2012-1502
�
���
��� ����
��� ����
��� ���� ��� �!�
�
��� �!� ������� ������������
���
Figure 13. Resultant deflection magnitude shape factors at a radius of 75%. The conventional design is shown as a red dashed line and the concept as a solid blue line. The seven load cases from the topology optimization are indicated on the plot.
Table 3. Shape factors for efficiency in minimizing stress under asymmetrical bending.
Topology Conventional @ 25% Concept @ 25% Conventional @ 75% Concept @ 75%
1 5.0 4.3 3.2 1.8
2 5.0 4.3 3.2 1.8
Load case 3 4 5 1.9 1.9 2.6 7.0 7.0 6.4 1.5 1.5 2.9 1.7 1.7 4.0
6 5.1 4.2 3.0 1.3
14 of 19 American Institute of Aeronautics and Astronautics
7 2.0 7.9 2.0 5.0
�� �� ������� �
� � ����
�������
���
�
�������
�������
�
�
Downloaded by Paul Weaver on April 30, 2013 | http://arc.aiaa.org | DOI: 10.2514/6.2012-1502
���
�������
� ����
� ����
� ����
� ����
�
���� � ��� �� ����
���
Figure 14. Stress shape factors at a radius of 25%. The conventional design is shown as a red dashed line and the concept as a solid blue line. The seven load cases from the topology optimization are indicated on the plot.
IV.
Discussion
Based on the topology optimization result and the shape factors, the solution will now be discussed in order to understand why it has arisen. The variation in topology along the blade length is not unexpected due to the large changes in geometry. From the root to the tip, the twist of the blade varies from approximately 24◦ to almost zero, whereas the relative thickness of the section decreases by a factor of almost 7. With these differences in the design domain, alternative layouts have formed to sustain the loads. A good design would be one in which each of the possible failure modes is pushed to the limit to give a lightweight blade. In addition to purely reducing the weight, the results of the topology could offer better manufacturing opportunities. However, manufacture was not considered at this stage of research so as not to be a constraint. In general, we believe that the use of topology optimization for wind turbines was justified as the complexities due to the asymmetric bending meant that the solutions were non-trivial. From the stress contour plots, it was seen that the neutral axis of the concepts was more closely aligned with the chord when compared to the conventional sections. Crucially, this was the case for the critical forward flap, forward edge load case. The closer alignment reduces the maximum distance from the neutral axis and thus helps contribute to a more stress-efficient design. As the distance from the neutral axis in the spar caps does not vary as in a conventional design, the stress is more evenly distributed. In the trailing edge reinforcement concept, the rotation of the neutral axis is achieved because of the increased edgewise second moment of area as well as the larger product second moment of area. The centroid is also translated toward the trailing edge, thus reducing the maximum distance under edge-dominated loads. At first glance, it may have seemed that the trailing edge reinforcement was just maximizing edgewise stiffness, but it is likely that the most beneficial effect comes from the rotation of the neutral axis. With this knowledge it could be possible to fine-tune a wind turbine blade so the section properties align the neutral axis with the chord line.
15 of 19 American Institute of Aeronautics and Astronautics
�� � ��������
�
�
��
������ � ��������
������ � �������� �
Downloaded by Paul Weaver on April 30, 2013 | http://arc.aiaa.org | DOI: 10.2514/6.2012-1502
���
������ �
������ � ��������
������ �
�
�������� ���
������� ������� �� �
Figure 15. Stress shape factors at a radius of 75%. The conventional design is shown as a red dashed line and the concept as a solid blue line. The seven load cases from the topology optimization are indicated on the plot.
The rotation of the neutral axis in the offset spar caps is achieved through the increased product second moment of area, with a smaller change in the edgewise second moment of area. Inboard, the shape of the concept stress shape factor polar plot was stretched in the edgewise directions when compared to the conventional section. In contrast, the shape of the outboard concept stress shape factor was a rotated, stretched version of the conventional section plot. It should be noted that for both the deflection and stress shape factors, there were load cases which had smaller shape factors than the conventional section. The shape factor plots do not depend on the magnitude of the applied loads, so when analyzing the results, it is important to also consider this. The load case which drove the topology optimization was the forward flap, forward edge load case, but the other load cases still satisfied the constraints. So the increased structural efficiency for the key load case comes at the expense of reduced structural efficiency for some other load cases. The effect of this would be a design in which the reserve factors for all the load cases converge toward the same value. The shape factor plots could be used to identify potential problems for changing load cases. For example, the conventional outboard stress shape factor (Fig. 15) shows that the forward-forward load case is located at a vertex of the plot. Small increases in the edgewise load would result in a rapid decrease in the stress shape factor. This is of particular relevance to large blades which have relatively larger edgewise loads. The changes in the geometry of the blade cross-section along the blade length provide very different design domains. The shape factors do not depend on scale, but overall the shape factor magnitudes were smaller for the outboard sections. The reduced relative thickness and twist create a more limiting design domain, and it is more difficult to sustain the loads as efficiently.
16 of 19 American Institute of Aeronautics and Astronautics
Downloaded by Paul Weaver on April 30, 2013 | http://arc.aiaa.org | DOI: 10.2514/6.2012-1502
Figure 16. Stress contour plots for the critical load cases at 25% of the blade radius. Each contour plot is normalised to the maximum stress. The blue line shows the principal second moment of area. The red line shows the neutral axis.
Figure 17. Stress contour plots for the critical load cases at 75% of the blade radius. Each contour plot is normalised to the maximum stress. The blue line shows the principal second moment of area. The red line shows the neutral axis.
17 of 19 American Institute of Aeronautics and Astronautics
Downloaded by Paul Weaver on April 30, 2013 | http://arc.aiaa.org | DOI: 10.2514/6.2012-1502
V.
Conclusion
Alternative structural configurations for wind turbine blades were investigated, with the aim to improve their design, minimize weight and reduce the cost of wind energy. Topology optimization was used to find these layouts and develop new and non-intuitive solutions. The result was a structure which changed along the length of the blade, transforming from the trailing edge reinforcement design to one with offset spar caps. This solution was then evaluated in terms of stress efficiency and the ability to resist flapwise deflections due to bending. To do this, shape factors were developed which could account for asymmetric bending which results from the lack of geometrical symmetry and the biaxial loads. The deflection was considered, as opposed to the stiffness, because it is the tower clearance which is the design constraint. This highlights the distinction between deflection and stiffness which is vitally important for asymmetric bending. Similarly, the bending stress is not simply related to the bending stiffness. Asymmetric bending behavior is non-intuitive because the stress depends on section properties, loading and distance from the neutral axis. In simple bending, improving bending rigidity typically reduces stress, but this may not be the case with asymmetric bending. For the key load cases, the sections from the topology optimization had larger shape factors for both deflection and stress, which meant that they are more structurally efficient. The reasons for the different topologies at different positions along the blade can be explained by the large changes in the twist and relative thickness of the airfoil section. By maximizing the structural efficiency of a wind turbine blade the design will require less material resulting in a more lightweight blade. This is particularly important for large blades and is necessary to overcome the square-cube law between power and mass. The concepts presented in this study are at an early stage of development, but they indicate there is an opportunity to improve the design of wind turbine blades, and thus reduce the cost of wind energy.
Acknowledgments The research was supported by the EPSRC (as part of the doctoral training centre at the Advanced Composites Centre for Innovation and Science), grant number EP/G036772/1. The work was also partly supported by Vestas Wind Systems. This financial support is gratefully acknowledged.
18 of 19 American Institute of Aeronautics and Astronautics
Downloaded by Paul Weaver on April 30, 2013 | http://arc.aiaa.org | DOI: 10.2514/6.2012-1502
References 1 Ashwill, T. D., “Materials and Innovation for Large Blade Structures: Research Opportunities in Wind Energy Technology,” 50th AIAA Structures, Structural Dynamics, & Materials Conference, Palm Springs, May 2009. 2 US DOE Energy Efficiency and Renewable Energy, “20% Wind Energy by 2030; Increasing Wind Energy’s Contribution to U.S. Electricity Supply,” 2008. 3 Thomsen, O. T., “Sandwich Materials for Wind Turbine Blades - Present and Future,” Journal of Sandwich Structures and Materials, Vol. 11, January 2009, DOI: 10.1177/1099636208099710. 4 Ashwill, T. D., “Innovative Design Approaches for Large Wind Turbine Blades: Final Report,” Tech. rep., Sandia National Laboratories, May 2004. 5 Jensen, F. M., Ultimate strength of a large wind turbine, Ph.D. thesis, Technical University of Denmark, May 2008. 6 Joncas, S., Thermoplastic Composite Wind Turbine Blades; An Integrated Design Approach, Ph.D. thesis, Technische Universiteit Delft, 2010. 7 Brondstead, P., Holmes, J. W., and Sørensen, B. F., “Wind Turbine Blade Materials Technology,” Wind Turbine Technology: European Sustainable Energy Review , Vol. 2, 2008, pp. 36–40. 8 Eschenauer, H. A. and Olhoff, N., “Topology Optimization of Continuum Structues: A review,” Applied Mechanics Review , Vol. 54, No. 4, July 2001, pp. 331–390, DOI: 10.1115/1.1388075. 9 Bendsøe, M. P. and Sigmund, O., Topology Optimisation: Theory, Methods and Applications, Springer, 2003. 10 OFGEM, “Renewables Obligation: Annual Report 2008-09,” 2010. 11 Joncas, S., de Ruiter, M. J., and van Keulen, F., “Preliminary design of large wind turbine blades using layout optimization techniques,” 10th AIAA/ISSMO Multidisciplinary Analysis and Optimization Conference, Albany, New York, 2004. 12 Forcier, L. and Joncas, S., “New structural design concepts for large wind turbine blades using structural optimization techniques,” 51st AIAA/ASME/ASCE/AHS/ASC Structures, Structural Dynamics, and Materials Conference, Orlando, Florida, April 2010. 13 Liu, W. and Y.Zhang, “Network study of plant lead topological pattern and mechanical property and its application,” Advances in Natural Science, Vol. 3, No. 2, 2010, pp. 82–92. 14 Zakhama, R., Abdalla, M. M., G¨ urdal, Z., and Smaoui, H., “Wind load effect in topology optimization problems,” Journal of Physics: Conference Series, Vol. 75, 2007, DOI: 10.1088/1742-6596/75/1/012048. 15 Buckney, N., Green, S. D., Pirrera, A., and Weaver, P. M., “On the structural topology of wind turbine blades,” Wind Energy (to be published). 16 Bendsøe, M. P., “Optimal shape design as a material distribution problem,” Structural Optimization, Vol. 1, 1989, pp. 193–202, DOI: 10.1007/BF01650949. 17 Altair Engineering, HyperWorks 10.0 Release Notes, 2009. 18 Ladson, C. L., C. W. Brooks, J., Hill, A. S., and Sproles, D. W., “Computer Program To Obtain Ordinates for NACA Airfoils,” NASA Technical Memorandum 4741, National Aeronautics and Space Administration, Langley Research Center, December 1996. 19 Diaz, A. R. and Sigmund, O., “Checkerboard patterns in layout optimization,” Struct. Optim., Vol. 10, 1995, pp. 40–45, DOI: 10.1007/BF01743693. 20 Jog, C. S. and Haber, R. B., “Stability of finite element model for distributed parameter optimization and topology design,” Comp. Meth. Appl. Mech. Engrg., Vol. 130, 1996, pp. 203–226, DOI: 10.1016/0045-7825(95)00928-0. 21 Pirrera, A., Capuzzi, M., Buckney, N., and Weaver, P. M., “Optimization of Wind Turbine Blade Spars,” 53rd AIAA/ASME/ASCE/AHS/ASC Structures, Structural Dynamics, & Materials Conference, 23-26 April 2012, Honolulu, Hawaii, AIAA Paper 2012-xxxx. 22 Megson, T. H. G., Aircraft Structures for Engineering Students, John Wiley & Sons, 3rd ed., 1999. 23 Weaver, P. M. and Ashby, M. F., “Material Limits for Shape Efficiency,” Progress in Materials Science, Vol. 41, 1997, pp. 61–128. 24 Commission, I. E., “Wind turbines - Part 1: Design Requirements (BS EN 61400-1:2005),” 2005. 25 Burgess, S., Kahangamage, U., Barr, G., and Williams, J., “Shape factors for beams with misaligned loads,” Proceedings of the Institution of Mechanical Engineers, Part C: Journal of Mechanical Engineering Science, Vol. 215, No. 8, 2001, pp. 981– 993. 26 Shanley, F. R., Basic Structures, John Wiley & Sons, 1944.
19 of 19 American Institute of Aeronautics and Astronautics