Journal of Rangeland Science, 2015, Vol. 5, No. 3
Rostami et al., /181
Contents available at ISC and SID Journal homepage: www.rangeland.ir Research and Full Length Article:
Comparing Deterministic and Geostatistical Methods in Spatial Distribution Study of Soil Physical and Chemical Properties in Arid Rangelands (Case Study: Masileh Plain, Qom, Iran) Noredin RostamiA, Vahid HabibiB, Raed Kamali MoghadamC A
Assistant Professor, Department of Range and Watershed Management, Faculty of Agriculture, Ilam University, Iran (Corresponding Author), Email:
[email protected] B Ph.D. Candidate of Watershed Management, Islamic Azad University, Sciences & Research Branch, Iran C M.Sc. of Watershed Management, Islamic Azad University, Sciences & Research Branch, Iran
Received on: 20/11/2014 Accepted on: 03/05/2015
Abstract. Accurate knowledge of spatial distribution of soil physical and chemical properties is needed for suitable management and proper use of rangelands in Masileh plain, Qom, Iran. In present study, for the spatial modeling of chemical and physical parameters such as sodium (Na), calcium (Ca), soluble potassium (K), magnesium (Mg), Electrical Conductivity (EC), Saturation Percentage (SP%), silt, clay and sand percent, 49 soil samples were collected from a depth of 0-30 cm of soil surface in a systematic pattern with 1030 m interval and then, they were compared using deterministic methods (radial basis function, inverse distance weighting and local polynomial interpolation) and geostatistical methods (ordinary, universal and disjunctive kriging, and Cokriging). First normality of data was test using Kolmogorov-Smirnov method. Log transformation was used for non-normal data and finally, spatial structure of the data was determined. Then, cross variogram of parameters was calculated by variography analysis. Then, results were evaluated by MBE and MAE calculation for the predicted and observed data. The results demonstrated that geostatistical methods lead to notable findings rather than deterministic ones. According to the results, the best method for modeling calcium and electrical conductivity parameters was Cokriging method while the best method for saturation percent, magnesium, sodium and silt as well as clay percent parameters was disjunctive kriging. Moreover, ordinary kriging method was suitable for the zonation of potassium and sand percent.
Key words: Geostatistics, Soil properties, Variogram, Masileh plain, Iran
J. of Range. Sci., 2015, Vol. 5, No. 3
Introduction Identifying, planning, proper management and use of natural resources need a serious attention to ecosystem components. In order to study the sustainable use of rangelands, it is necessary to recognize water, soil and vegetation and analyze their relationships. Some soil factors (physical, chemical and biological), humidity and temperature are necessary for the opt imu m p lant growt h (Rezaipoorbaghedar et al., 2011). Planning for the use of rangeland ecosystems, particularly in fragile condition rangelands in the arid regions is impossible regardless of soil properties. So, the importance of having accurate information on the soil spatial distributing properties is obvious (Sokoti Oskoei et al., 2006). There are different methods for estimating the spatial distribution of data such as arithmetic mean, Thiessen and hypsometric methods (Walter et al., 2001). Although these methods are quick and easy to use, they have disadvantages and difficulties which sometimes cause to less accurate and unacceptable results. On the other hand, classical statistical analyzes are based on the independence of samples from one another and one sample cannot offer any information about the next sample (Einax and Soldt, 1999). Problems of mentioned methods lead to introduce the geostatistical methods (Sokoti Oskoei et al., 2006). Geostatistics is a technique to identify the systematic changes in the parts of natural materials such as soil. Similarity of quantitative parameters of soil in small areas is higher than distant places and this subject is considered in large scale and small scale mapping and validation of soil parameters (Habashi et al., 2007). Azimzadeh et al. (2006) applied kriging method to estimate the percentage of desert pavement and wind erosion threshold velocity in Ebrahim Abad district, Mehriz province, Iran. They demonstrated that geostatistics and
Comparing …/ 182
ordinary kriging methods were convenient and accurate methods for mapping important parameters in wind erosion like erosion threshold velocity and REG cover distribution. Cerri et al. (2004) used geostatistical method for soil characterization in order to choose the suitable areas of pasture in the Amazon basin in Brazil. Duffera et al. (2006) investigated spatial distribution of soil properties by combining two variogram and Principal Component Analysis (PCA) models and concluded that soil characteristics can be divided into two categories. The first group of characteristics is associated with soil unit maps such as soil texture and the second one is not associated with soil units such as soil porosity. Robinson and Metternicht (2006) used ordinary, log-normal ordinary and inverse distance weighting kriging methods for the interpolation of soil properties that affect yield productions in a region of Australia and reached to some acceptable results. Rodriguez et al. (2007) in south of Madrid in Spain studied spatial variations of soil erodibility index parameters using geostatistical methods and prepared the erosion map of the study area. In another study, Mohammad Zamani et al. (2007) using geostatistical methods for the evaluation of spatial changes of soil properties in the agricultural lands of Sorkhankalateh in Golestan province, Iran stated that variography analysis and kriging method can be used as powerful tools in providing soil sampling strategy. Tavares et al. (2008) used geostatistical methods of ordinary kriging, indicator kriging and Cokriging in addition to Landsat TM images as a covariate in order to map the affected, non-infected and suspected areas by heavy and toxic metals. Zhang et al. (2007) in their study on soil of North East of China in order to determine the spatial variability of soil nutrients such as organic matter, available nitrogen, soluble phosphorus
Journal of Rangeland Science, 2015, Vol. 5, No. 3
Rostami et al., /183
and available potassium using kriging interpolation method found that except available nitrogen, this method was acceptable for the other parameters. Because of such limitations as time and cost problems in most of environmental studies, sampling points of soil properties are limited. For better conception about the phenomenon which leads to better planning for the resource management, use of statistical models is needed for the estimation of parameters. Variography analysis can show important information about the spatial distribution patterns and quantitative values of the parameters (Mohamad Asghari, 2008). The objective of this study was to develop spatial variability modeling of soil physical and chemical properties using geostatistical and deterministic methods in Arid Rangelands of Masileh Plain, Qom, Iran. Also, spatial variability mapping of soil properties and its application in the restoration of degraded rangelands by the evaluation of soil properties changes were considered.
climate of region using the modified DeMarton classification is cold and hyperarid with 45% annual relative humidity. The study area is a winter pasture in poor conditions with vegetation cover including Salsola rigida, Seidlitzia rosmarinus, and Haloxylon spp.
Materials and Methods Study area Masileh plain with an area of 50 km2 is located in Qom Salt Lake watershed that lies from 51˚ 12' 20˝ to 51˚ 25' 00˝ E and 34˚ 40' 45˝ to 35˚ 00' 00˝ N and its mean altitude is 814 m above sea level. Its mean annual rainfall and temperature are 168 mm and 18.2°C, respectively. The
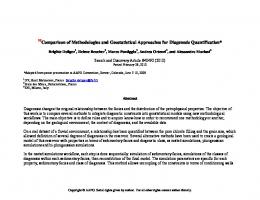
Fig. 1. Outline of a variogram (Mohamad Asghari, 2008)
Spatial structure of data In this study, 49 sampling points with 1030 m interval were selected using GIS software. Coordinates of these points were determined by field survey using a GPS instrument. Then, soil samples were gathered from 0-30 cm depth of surface soil. The EC, soluble Ca, Mg, Na and K, saturation percent (SP%), clay (%), silt (%) and sand (%) parameters were measured for each soil sample. After that, the Kolmogorov - Smirnov test was used for normality of data and log transformation was used for non-normal data and finally, spatial structure of the data was determined. Semi-variogram describes the spatial continuity of a variable. Spatial continuity means the adjacent samples that are dependent to each other in a given distance and it assumes that this dependency among samples can be presented by a mathematical model as variogram. In a variogram, the sum of squared differences between two points with h distance from each other is calculated and plotted against h as shown in Fig. 1.
Comparing …/ 184
J. of Range. Sci., 2015, Vol. 5, No. 3
In this research, some of geostatistical methods (ordinary, universal and disjunctive kriging and Cokriging) were compared with deterministic methods (radial basis function, inverse distance weighting and local polynomial interpolation). So, a brief explanation of these methods has been presented as below:
Geostatistic kethods Kriging kethod Kriging method (Srivastava, 2013) is an estimator which considers the values of a variable in the un-sampled points as a linear combination of values in the search radius of that variable and for the estimation of unknown points, a weight was assigned for each sample.
Ordinary kriging This method assumes that the data set has a stationary variance but a non-stationary variance means a value in the search radius.
Universal kriging This method is applied in a situation that both parts of variability (deterministic and stochastic) simultaneously exist in the spatial structure of variable region.
Disjunctive kriging A nonlinear estimator is applied where the data distribution is complicated and they cannot fit by the usual statistical distributions (normal or log-normal).
Cokriging Cokriging estimator is the developed kriging with respect to secondary variables.
Deterministic methods Radial basis function method A Radial Basis Function (RBF) is a realvalued function whose value depends only on the distance from the origin so that on the distance from some other point c is called a center so that. Any function ϕ that satisfies the property is a radial function. The norm is usually Euclidean distance although other distance functions are also possible (Lukaszyk, 2004).
Inverse distance weighting method Inverse Distance Weighting (IDW) interpolation is one of the most commonly used deterministic interpolation methods. An IDW function generates the interpolated surface by assigning values to the unknown points from a weighted sum of values of known points (Shepard, 1968). Local polynomial interpolation method Local Polynomial (LP) interpolation fits many polynomials, each in the specified over lapping neighbor hoods. The neighborhood can be defined using the Search Neighborhood dialog box. The shape, maximum and minimum number of points to use, and the sector configuration can be specified or a slider can be used to define the width of the neighborhood with a power parameter that will decrease the weights of sample points based on distance in the neighborhood. So, LP interpolation produces surfaces that explain more local variation. This method has more flexibility than Global Polynomial interpolation (Williams, 2010).
Validation of model and variogram The performance of methods was evaluated using Mean Absolute Error (MAE) and Mean Biased Error (MBE) as below (Equations 1 & 2): MAE
1 n z ( x) z ( x) n x 1
(Equation 1)
MBE
1 n z( x) z( x) n x 1
(Equation 2)
Where, ̂ ( ) is the estimated value at x point and n is the number of samples. MAE and MBE values indicate the bias which should be zero in the ideal case while positive or negative values mean higher or lower estimation than the actual value ( Waker nagel, 2003 ). MAE represents the method accuracy and average error, which is much better to be closer to zero and MBE represents the mean Standard Deviation (SD) between the estimated and observed values and lower MBE means more accuracy
Journal of Rangeland Science, 2015, Vol. 5, No. 3
Rostami et al., /185
(Kravchenko and Bullock, 1999). Isaaks and Serivastava (1989) suggested that MAE can be used as a measure which includes bias and precision characteristics to compare the accuracy of methods. Also, relative Nugget effect can be used to evaluate the spatial structure of data. When this parameter is less than 0.25, spatial structure of variable of interest is strong; a range of 0.25-0.75 shows an average spatial structure and more than 0.75 represents a weak spatial structure (Chien et al., 1997; Liu et al., 2006).
Variogram of each parameter is presented in Figs. 2-10 and then, results of variography analysis are listed in Table 1. The results demonstrated that the spatial structure of Ca and sand percent parameters was average and spatial structure of other parameters was weak. Table 2 presents the results of cross variogram of data that are needed for the calculation of Cokriging method. To calculate the cross variogram, the correlation between the parameters of interest was established and higher correlations were considered as a covariate as compared to the other parameters. The results demonstrated that Ca, Mg and K had fairly high correlations with their covariate although other variables have fairly low correlations with their covariate.
Results Kolmogorov-Smirnov test showed that Ca, K, Mg, EC of saturation extract and silt% were not normal. Therefore, they were normalized using log transformation method. Table 1. Results of variography analysis
Nugget
Average
R2
SD
Skewness
Ca (meq/l)
108.3
0.97
54.28
0.154
Spherical
Mg (meq/l)
265
0.96
170.3
0.106
K (meq/l)
37.49
0.94
21.28
Na (meq/l)
860.7
0.83
SP (%)
40.6
EC (ds/m)
Variable
Model
Spatial
Sill
Range
3.78
11.569
1789
0.67
Exponential
3.2
45.64
4000
0.93
0.329
Exponential
0.0366
0.24
1080
0.85
611.5
0.343
Exponential
0.1
89.6
2240
0.99
0.92
7.52
0.092
Spherical
0.001
0.034
2820
0.95
24.78
0.85
12.12
0.156
Spherical
0.0001
0.301
3200
0.99
Silt (%)
36.71
0.93
10.06
0.164
Spherical
0.001
0.653
2330
0.99
Clay (%)
36.88
0.78
9.69
0.084
Exponential
0.001
0.687
1890
0.99
Sand (%)
26.41
0.96
9.94
0.058
Exponential
0.38
1.2
1920
0.68
Effect
Autocorrelation
Table 2. Results of cross variogram analysis Variable
Covariate
Model
Ca (meq/l) Mg (meq/l) K (meq/l) Na (meq/l) SP (%) EC (ds/m) Silt (%) Clay (%) Sand (%)
Mg K Mg EC Clay Na Sand SP SP
Linear Exponential Exponential Exponential Linear Spherical Spherical Linear Exponential
Correlation Coefficient 0.60 0.67 0.67 0.506 0.51 0.506 0.50 0.51 0.48
Results of different methods of estimating and variograms of parameters in this study were presented in Table 3.
Nugget Effect 10 0.001 0.001 10 0.01 100 0.1 0.01 0.00001
Sill
Range
9124 1.002 1.002 6251 21.01 5292 52.81 16.87 0.01
5920 2110 2110 1970 4050 1650 5530 4350 2110
Spatial Autocorrelation 0.99 0.99 0.99 0.99 0.99 0.98 0.99 0.99 0.99
Finally, according to the MAE and MBE, map of the best estimation model for each parameter was drawn (Figs. 11-19).
Comparing …/ 186
J. of Range. Sci., 2015, Vol. 5, No. 3
Table 3. Results of evaluation of geostatistics and deterministic methods using mean absolute error (MAE) and mean biased error (MBE) Geostatistics and Deterministic methods Ordinary kriging Universal kriging Disjunctive kriging Cokriging, Local Polynomial Interpolation Inverse Distance Weighting method Radial Basis Function method
MBE 0.15 1.43 -0.20 -0.20 1.34
K MAE 1.64 1.24 1.89 1.59 1.54
Mg MBE MAE 3.22 11.27 6.41 12.84 3.73 11.77 6.31 122.1 7.48 12.08
MBE 2.87 47.00 -0.20 31.5 3.28
MAE 40.24 39.52 15.89 169.8 41.92
Sand% MBE MAE 0.32 7.21 0.46 7.30 0.32 7.29 0.41 7.41 0.59 7.29
Silt% MBE MAE 0.10 7.14 0.65 7.14 0.01 7.10 0.50 7.42 0.12 7.24
EC MBE MAE 0.51 9.16 1.84 8.62 0.51 9.16 0.17 8.62 0.70 9.08
Clay% MBE MAE 0.47 7.71 0.48 7.71 0.03 6.93 0.50 7.90 1.09 8.62
MBE 0.51 3.19 1.32 0.16 1.24
MAE 3.88 3.08 3.34 3.07 3.6
MBE 0.17 0.35 0.26 0.25 0.85
SP MAE 5.18 5.34 5.19 5.30 5.62
0.53
1.09
5.60
11.94
8.78
43.89
0.38
7.16
0.15
7.10
0.17
9.32
0.69
7.74
0.19
3.57
0.25
5.26
0.37
1.19
4.96
11.34
9.63
42.02
0.46
7.30
0.13
7.15
0.19
9.14
0.59
7.68
0.41
3.93
0.23
5.23
Fig. 2. Soluble Mg variogram
Fig. 5. Silt percent variogram
Fig. 8. SP variogram
Na
Fig. 3. Soluble K variogram
Fig. 6. EC variogram
Fig. 9. Sand percent variogram
Ca
Fig. 4. Soluble Ca variogram
Fig. 7. Soluble Na variogram
Fig. 10. Clay percent variogram
Journal of Rangeland Science, 2015, Vol. 5, No. 3
Rostami et al., /187
Fig. 11. Spatial distribution of clay
Fig. 14. Spatial distribution of soluble Mg
Fig. 12. Spatial distribution of soluble Ca
Fig. 15. Spatial distribution of soluble K
Fig. 13. Spatial distribution of EC
Fig. 16. Spatial distribution of soluble Na
Comparing …/ 188
J. of Range. Sci., 2015, Vol. 5, No. 3
Fig. 17. Spatial distribution of sand
Fig. 18. Spatial distribution of silt
Fig. 19. Spatial distribution of SP
Discussion Because vegetation cover of the study area was limited to some halophyte species and litter percent was about zero, it assumed that soil organic matter is inconsiderable; so, this parameter is not evaluated. In other parameters, differences of variogram models were related to the assigned weights to adjacent and distant samples and had a large effect on precision of estimations. Spherical model was suitable for Ca, SP,
EC and silt% and exponential model for the other parameters. Rise of Nugget effect causes the rise of variance or estimation error which was observed in Ca and Mg parameters. Fairly low values of MAE and MBE mean high accuracy of Cokriging method for Ca and EC, Disjunctive kriging for SP, Na, Mg, silt and clay percent and ordinary kriging for the zonation of K and sand percent. This study represents the priority of geostatistical methods over deterministic
Journal of Rangeland Science, 2015, Vol. 5, No. 3
methods in zoning physical and chemical properties of soil in the study area which is in accordance with the studies of Azimzadeh (2006), Robinson and Metternicht (2006), Mohammad Zamani et al. (2007) and Zhang et al. (2007). Fitness of Cokriging method for Ca and EC indicates that these two parameters had a significant relationship with their covariates, Mg and Na, respectively. The purpose of present study was to map soil properties for future studies and monitoring soil properties based on results of this study in order to avoid costly studies. So, there is no need to soil sampling for those parameters that had the highest accuracy in Cokriging method and their covariate can be used instead of them as presented in Table 2. It was concluded that geostatistical methods lead to notable findings rather than deterministic methods. Also, Cokriging was the best method for modeling Ca and EC parameters, disjunctive kriging for SP%, Mg, Na, silt and clay percent parameters and ordinary kriging was suitable for the zonation of K and sand percent parameters. So, one of the main characteristics of arid rangelands is saline soils and vegetation distributions in these soils are correlated to soil properties; therefore, study of vegetation changes with soil characteristics is essential for management and restoration of arid rangelands.
Literature Cited Azimzadeh, H. R., Ekhtesasi, M. R., Mohammadi, J. and Refahi, H. A., 2006. Spatial estimation of threshold velocity and desert pavement using Kriging method. 1th Congress of Wind erosion, Yazd, 166-172. (In Persian). Cerri, C. E. P., Bernoux, M., Chaplot, V., Volkoff, B., Victoria, R. L., Melillo, J. M., Paustian, K., Cerri, C. C., 2004. Assessment of soil property spatial variation in an Amazon Pasture: basis for selecting an agronomic experimental area. Geoderma, 123(1 & 2):5168.
Rostami et al., /189
Chien, Y. L., Lee, D. Y., Guo, H. Y., and Houng, K. H., 1997. Geostatistical analysis of soil properties of mid-west Taiwan soils. Soil Sci, 162:291–297. Duffera, M., White, J. G., and Weisz, R. W., 2007. Spatial variability of southeastern U.S. coastal plain soil physical properties: Implications for site-specific management. Geoderma, 137(3, 4): 327-339 Einax, J. W., and Soldt, U., 1999. Geostatistic and multivariate statistical methods for the assessment of polluted soils-merits and limitations. Chemometr Intell Lab Syst. 46(1): 79-91 Habashi, H., Hosseini, S. M., Mohammadi, J., and Rahmani, R., 2007. Geostatistic applied in forest Soil studying processes. Jour. Agric. Sci. Nature. Resource, 14(1):18-27. (In Persian). Isaaks, E. H., and Serivastava, R. M., 1989. An introduction to applied Geostatistics. Oxford University Press, New York. 561pp. Kravchenko, A., and Bullock, D. G., 1999. A comparative study of interpolation methods for mapping soil properties. Agronomy Jour., 91(3): 394-400. Liu, X., Wu, J., and Xu, J., 2006. Characterizing the risk assessment of heavy metals and sampling uncertainty analysis in paddy field by geostatistics and GIS. Environ. Pollut., 141: 257-264. Lukaszyk, S., 2004. A new concept of probability metric and its applications in approximation of scattered data sets. Comput Mech, 33(4): 299304. Mohamad Asghari, H., 2008. Investigation of soil property Spatial variability using Geostatistic methods and Remote Sensing. M.Sc. University of Tehran, 167 pp. (In Persian). Mohammad Zamani, S., Ayoubi, Sh., and Khormali, F., 2007. Spatial Variability of Wheat Yield and Soil Properties in a Selected Agricultural Land of Sorkhankalateh. JWSS Isfahan University of Technology. 11(40):79-92 (In Persian). Rezaipoorbaghedar, A., Hakimi, M. H., Sadeghinia, M., Azimzadeh, H. R. 2011. Effect of Some Soil Properties on Distribution of Eurotia ceratoides and Stipa barbata in Baghedar, Bafgh Rangelands. Jour. Rangeland Science, 2(1): 417-424 Robinson, T. P. and Metternicht, G., 2006. Testing the performance of spatial interpolation techniques for mapping soil properties. Comput. Electron. Agric., 50(2): 97-108.
J. of Range. Sci., 2015, Vol. 5, No. 3
Rodriguez, R. P., Marques, M. J. and Bienes, R., 2007. Spatial variability of the soil erodibility parameters and their relation with the soil map at subgroup level. Sci. Total Environ., 378 (12): 166–173. Shepard, D., 1968. A two-dimensional interpolation function for irregularly-spaced data. In: ACM 68: Proceedings of the 1968 23rd ACM national conference. ACM, New York, USA, 517-524. Sokoti Oskoei, R., Mahdian, M. H., Mahmodi, Sh., Ghayomian, J., 2006. A comparative study of interpolation methods for mapping soil properties of Oromieh plain. 9th Soil Science Congress of Iran, Tehran, 663-667. (In Persian). Srivastava, M. R. 2013. Geostatistics and Orebody Modelling. Toronto: FSS Canada Consultants Inc. Tavares, M. T., Sousa, A. J., and Abreu, M. M., 2008. Ordinary Kriging and indicator Kriging in the cartography of trace elements contamination in São Domingo's mining site (Alentejo, Portugal). Jour. Geochemical Exploration, 98(1, 2):43-56. Wackernagel, H., 2003. Multivariate geostatistics, Third edition, Springer-Verlag, Berlin, 387 pp. Walter, C., McBratney, AB., Douaoui, A., Minasny, B., 2001. Spatial prediction of topsoil salinity in the Chelif Valley, Algeria, using local ordinary kriging with local variograms versus whole-area variogram. Aust. Jour. Soil Res. 39(2): 259 – 272. Williams, Shannon F., 2010. Spatial Distribution of Fluoride Concentration in Goathill North Rock Pile, Questa Molybdenum Mine, Questa, New Mexico. A Master Thesis submitted for the degree of Master of Science in Hydrology, University of Nevada, Reno. Zhang, X. Y., Sui, Y. Y, Zhang, X. D., Meng, K., Herbert, SJ., 2007. Spatial variability of nutrient properties in black soil of northeast China. Pedosphere, 17(1): 19-29.
Comparing …/ 190
Journal of Rangeland Science, 2015, Vol. 5, No. 3
Rostami et al., /191
یقبژسٍ ريشَبی یعیه ثب ريشَبی زییه آیبری در ثررسی پرامىص ینبوی ثرخی خصًصیبت فیسژنی ي ضیمیبژی خبك در یراتع یىبطق خطل اژران (یطبلعٍ یًردی :دضت یسیلٍ ،استبن قم) د
ًَضالسيي ضؾتويالؿٍ ،حیس حجیجية ،ضائس کوبلي هقسم
الؿاؾتبزيبض نطٍُ رٌگل ٍ هطتع ،زاًكکسُ کكبٍضظي ،زاًكگبُ ايهم (ًگبضًسُ هؿئَل) ،پؿت الکتطًٍیک
[email protected] 7 ةزاًكزَي زکتطي یثریعزاضي زاًكگبُ یظاز ٍاحس علَم تحقیقبت دزاًفیهَذتِ کبضقٌبؾي اضقس یثریعزاضي زاًكگبُ یظاز ٍاحس علَم تحقیقبت
تبضيد زضيبـت8060/35/06 7 تبضيد پصيطـ8061/30/80 7
چنیذٌ .ثِ هٌ َض هسيطيت ٍ ثْطُ ثطزاضي ثْیٌِ هطاتوع ،ینوبّي صوحیز اظ پوطاکٌف هکوبًي ذصَصویبت ـیعيکي ٍ قیویبيي ذبک هْن ثِ ً ط هيضؾس زض ايي تحقیق ثطاي هسلؿبظي هکبًي پبضاهتطّبي ـیعيکوي ٍ قیویبيي ذبک زض زقت هؿیلِ قن اظ قجیل ؾسين ،کلؿین ،پتبؾین ٍ هٌیوعين هحلوَلّ ،وسايت الکتطيکوي ( ،)ECزضصس اقجب ( ،)SP%زضصس ؾیلت ،ضؼ ٍ قي ذبکً ،وًَوِثوطزاضي اظ عووق 3-03ؾوبًتي هتوطي ؾغز ذبک ثِ تعساز ً 16وًَِ ٍ ثب الگَي ًوًَِثطزاضي هٌ ن ثوب ـَاصول 8303هتوط اظ ّون ،اًزوبم قوس ٍ ؾپؽ ثِ کوک ضٍـّبي هعیي (تبثع قعبعي ،هیبًگیي هتحطک ٍظىزاض ٍ ترویي هَضعي) ٍ ظهیي یهوبضي (کطيزیٌگ هعوَلي ،ربهع ،نؿؿتِ ٍ کَکطيزیٌگ) ثب ّوسيگط هقبيؿِ قسًس زض اثتسا ًطهبل ثَزى زازُّوب ثب اؾتفبزُ اظ یظهَى کَلوَنطٍؾ -اؾویطًَؾ ثطضؾي نطزيس ٍ زازُّبي ؼیطًطهبل اظ عطيق تجسيل لگوبضيتوي ًطهبل قسًس ؾپؽ یًبلیع ٍاضيَنطاـي ٍ ٍاضيَنطام هتقبثل پبضاهتطّب هحبؾجِ نطزيس اضظيبثي ًتبيذ ثب هحبؾجِ ذغبي MAE ٍ MBEثطاي هقبزيط هَضز اًت بض ٍ هكبّسُ قسُ اًزبم نطـت ًتبيذ ًكبى زاز کوِ ضٍـ- ّبي ظهیي یهبضي ثطتطي قبثل ههح ِاي ًؿجت ثِ ضٍـ ّبي هعیي زاضًس ٍ ثْتطيي ضٍـ هسلؿوبظي ثوطاي پبضاهتطّبي کلؿین ٍ ّسايت الکتطيکي ،ضٍـ کَکطيزیٌگ ،ثطاي پبضاهتطّبي زضصس اقجب ،هٌیعين ،ؾوسين، زضصس ؾیلت ٍ ضؼ ،ضٍـ کطيزیٌگ نؿؿتِ ٍ ثطاي پٌِْثٌسي پبضاهتطّبي پتبؾوین ٍ زضصوس قوي ،ضٍـ کطيزیٌگ هعوَلي هيثبقٌس ملمبت ملیذی :ظهیي یهبض ،ذصَصیبت ذبکٍ ،اضيَنطام ،زقت هؿیلِ ،ايطاى