X-Ray Volume Rendering by Hierarchical Wavelet Splatting Michel A. Westenberg and Jos B.T.M. Roerdink Institute for Mathematics and Computing Science University of Groningen, P.O. Box 800, 9700 AV Groningen, The Netherlands
[email protected],
[email protected] z
Abstract
v
This paper is concerned with X-ray volume visualization by means of wavelet splatting, a wavelet-based extension to splatting. Wavelet splatting allows multiresolution visualization of volume data. During user interaction, only low resolution images are computed. When interaction ceases, the image is refined incrementally. We discuss a particular implementation of wavelet splatting which was proposed previously, and show that certain rendering artefacts appear in the low resolution images, due to the particular ordering of the wavelet coefficients. We propose a new variant that uses a different ordering, and computes low resolution images based on the wavelet approximation coefficients only. This variant does not suffer from artefacts, and is faster by a factor of two to three.
1
θ P (u,v) θ
u
y
x
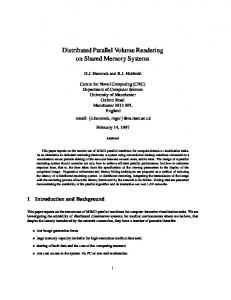
Figure 1. Parameters of the X-ray transform.
Fourier rendering [6] is a fast method to compute the X-ray transform by using frequency domain techniques. Splatting [9] is an object order rendering method in which the voxels are projected to the view plane. In the discrete case, we have a collection of samples ck , k = (k, l, m) ∈ Z3 , of the function f . The splatting algorithm reconstructs f from its samples by convolution with a reconstruction filter φ, and then computes a mapping to the screen. This is expressed by X Z Pθ f (u, v) = ck φk (uu + vv + tθ) dt. (2)
Introduction
X-ray volume rendering remains an interesting technique for medical applications, because physicians are well-trained in interpreting X-ray like images for diagnosis. X-ray volume rendering is a direct volume rendering method [2], based upon integrating the 3-D data along the line of sight. The underlying mathematical principle is the X-ray transform, well-known from computerized tomography [3]. The X-ray transform Pθ f of f (x), x = (x, y, z) ∈ R3 , is defined by Z Pθ f (u, v) = f (uu + vv + tθ) dt, (1)
k
R
The integral over φ results in a two-dimensional function, which is called a footprint. For orthographic projection, all voxels have the same footprint for a fixed viewing direction θ. A mapping to the view plane by accumulation of the footprints weighted by the voxels forms the image. Previously, Lippert et al. [4, 5] proposed a wavelet-based extension to splatting, called wavelet splatting. Wavelet splatting modifies the splatting algorithm by using wavelets as 3-D reconstruction filters. One of the reasons to use wavelets is that rendering the data sets is time consuming due to their size. This produces a need for compression methods and mechanisms to visualize the data incrementally (‘progressive refinement’). For this purpose, waveletbased multiresolution models have been developed, which
R
where u and v are two mutually orthogonal vectors in the view plane perpendicular to a direction vector θ (cf. Fig. 1). Usual implementations are based either on ray-casting, Fourier rendering, or splatting. Ray-casting is an image based rendering method in which a ‘virtual’ light ray is cast from the view plane into the volume data. For X-ray rendering, the voxel values are simply added along this light ray. 163
eτ the detail coefficients are dj,τ k = hf, Ψj,k i, where h·, ·i denotes the inner product in the space L2 (R3 ) of square integrable functions on R3 . This equation expresses Pθ f (u, v) as a weighted summation of integrals along the line of sight, resulting in 2-D functions on the view plane: the footprints. The integrals have to be evaluated only once for a given viewing direction at the coarsest scale j = M and translation k = (0, 0, 0), yielding eight prototype footprints. The footprints for other scales and translations are computed by rescaling and shifting. Prototype footprints are computed efficiently by slicing their 3-D Fourier transforms [4]. For the Haar and cardinal B-spline wavelets, analytical expressions exist, therefore, no interpolation from discrete samples is necessary.
allow systematic decomposition of the data into versions at different levels of resolution. Wavelet-based methods also have proved to perform well in compression of images [1] and compression of volume data [7]. In this paper, we compare two different implementations of wavelet splatting, and come up with a new variant, called hierarchical wavelet splatting, which takes advantage of the strengths of both methods. The first method uses the hierarchical ordering provided by the wavelet transform [8] during rendering. The second method imposes a global ordering on the wavelet coefficients [5]. It turns out that the global ordering of the coefficients introduces artefacts in low resolution images. The hierarchical ordering does not suffer from these artefacts. The advantage of the global ordering is that images of high resolution are obtained using a small number of wavelet coefficients. The remainder of this paper is organized as follows. Section 2 reviews the fundamentals of wavelet splatting, discusses the two different implementations, and gives a comparison. In Section 3, we introduce hierarchical wavelet splatting. Finally, some experimental results are presented in Section 4, and discussed in Section 5.
2 2.1
2.2
A straightforward implementation of (3) uses the hierarchical ordering of the decomposition levels. Rendering starts by using the approximation coefficients cM k to compute a low resolution image. This image is then refined by using the detail coefficients dM,τ , followed by the detail k M −1,τ 0,τ coefficients dk , . . . , dk . We recently proposed twostage wavelet splatting [8], which provides a fast rendering algorithm for the hierarchical ordering. Two-stage wavelet splatting splits the splatting process in two stages: (i) coefficient projection and accumulation, and (ii) a final convolution with the footprint. This is more efficient than a direct implementation of (3), which blends the footprint into the view plane for each voxel. This requires interpolation of all elements of the footprint, whereas two-stage splatting only interpolates a single voxel. The final convolution requires no interpolation. We incorporated two-stage splatting into wavelet splatting, and found speedups in rendering time up to a factor of three for Haar and B-spline wavelets [8].
Wavelet splatting Basic wavelet splatting
A 1-D biorthogonal wavelet basis can be constructed from a scaling function φ with associated wavelet ψ, and e The corredual scaling function φe and dual wavelet ψ. sponding basis functions are {φj,k } and {ψj,k }, j, k ∈ Z, where φj,k (x) = 2−j/2 φ(2−j x − k) and ψj,k (x) = 2−j/2 ψ(2−j x − k). The dual basis functions are defined similarly. The parameters j and k denote scale and translation, respectively. From the 1-D basis, one constructs a 3-D separable wavelet basis (of the so-called nonstandard type) with eight basis functions, i.e. one scaling function Φ0j,k (x, y) and seven wavelet basis functions Ψτj,k (x, y), τ ∈ T = {1, 2, . . . , 7}, by taking tensor products of the 1-D scaling functions φj,k and wavelets ψj,k . Wavelet splatting [4, 5] modifies the basic splatting algorithm in two ways: (i) it uses wavelets as reconstruction filters, and (ii) it provides a mechanism to visualize data at different levels of detail. First, the algorithm performs a 3D wavelet decomposition of the volume data. Substitution of the expansion of f on the 3-D wavelet basis in the X-ray transform (1) results in: Z X Pθ f (u, v) = cM Φ0M,k (uu + vv + tθ) dt k +
M XX X j=1 τ ∈T
k
dj,τ k
2.3
Z
Ψτj,k (uu + vv + tθ) dt.
Global ordering
Lippert et al. [5] proposed an implementation of wavelet splatting which is targeted at networked applications. In order to transmit the volume data efficiently, they developed a compression technique that allows progressive transmission. The data compression pipeline converts the wavelet transformed data set into a sequential bitstream. First, a separate sequence of coefficients for each wavelet type and decomposition level is generated, and the coefficients in each sequence are sorted in descending order. Next, lossy compression involving deltacoding, normalization, and quantization is performed on each sequence. Finally, all sequences are merged and sorted in descending order. This step imposes a global ordering on the wavelet coefficients, in which the hierarchical order defined by the wavelet decomposition levels is lost. The client decompresses the stream and performs the actual splatting. The frame rate
R
k
Hierarchical ordering
(3)
R
e0 The approximation coefficients are cM k = hf, ΦM,k i, and 164
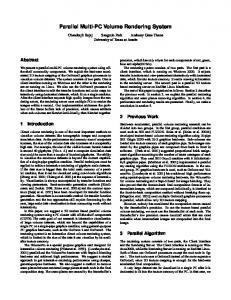
ages using all approximation coefficients, we determined the number of coefficients that can be visualized with WS at the same frame rate. Both data sets contain 32767 approximation coefficients. The Phantom data set is rendered at 11 frames per second by TWS and the CT head data set at 8 frames per second on a Pentium II 400 MHz processor. The same frame rates are reached by WS using the first 7100 coefficients of the Phantom data set and the first 7200 of the CT head data set. The Phantom data set indicates that WS gives undesirable results, because only an outer shell of the data is shown (Fig. 3(c)). In an interactive session, for instance, the objects inside the ellipsoid appear suddenly when interaction is ceased. A similar effect can be seen in the CT head data (Fig. 3(d)), where large parts of the soft tissue are missing in the low resolution image.
can be controlled by the user, who can define the amount of coefficients that is used as a first coarse representation.
2.4
Comparison
We compare image quality of two-stage wavelet splatting (TWS), which uses a hierarchical ordering of the wavelet coefficients, and network targeted wavelet splatting (WS), which uses a global ordering. We focus in particular on the low resolution images computed during user interaction. The final images, i.e. for which all wavelet coefficients are used, are the same. We will use two example data sets, a Phantom and CT data set. The Phantom data set has 8 bits per voxel, and was generated from a mathematical description of ellipsoids. It is a 3-D variant of the Shepp and Logan head phantom [3], which is used to assess the quality of tomographic reconstruction algorithms. The CT head data has 16 bits per voxel. Both data sets contain 128 × 128 × 128 voxels. For WS it is difficult to determine the minimum number of coefficients necessary to generate a low resolution image which is useful. The final sorting and merging removes the hierarchical ordering provided by the wavelet decomposition. During the rendering phase, therefore, it is impossible to speak about an approximation at a certain reconstruction level. Since the low resolution image always involves a mixture of approximation coefficients cM k and detail coefficients dj,τ , interpretation can become difficult. An example k is shown in Fig. 2. We used a two-level wavelet decomposition with the Haar wavelet. The number of approximation coefficients for the Phantom data set is 11296 after removal of the coefficients that are zero. Figure. 2(a) shows an image obtained by TWS using the approximation coefficients only, and Fig. 2(b) shows an image obtained by WS using the first 11296 wavelet coefficients. The effect shown in Fig. 2(b) is undesirable, since the object appears to be partially empty. The effect disappears by taking 1000 coefficients more.
(a) TWS
(a) 32767
(b) 32767
(c) 7100
(d) 7200
Figure 3. Low resolution renderings by TWS (top row) and WS (bottom row). (a), (c): Phantom data; (b), (d): CT head data.
Although WS suffers from artefacts in approximation images, it produces high-resolution images with less coefficients than TWS. This is an important advantage of the global ordering of the coefficients. An example is shown in Fig. 4(a) and Fig. 4(b) for the Phantom data and the CT head data, respectively. When the number of coefficients used is increased to 32767, the total number of approximation coefficients used above by TWS, the resulting images show more detail than those in Fig. 3(a) and Fig. 3(b).
(b) WS
Figure 2. Low resolution image renderings.
3
Figure 3 shows a comparison between TWS and WS for low resolution images computed for a fixed frame rate. We used a two-level wavelet decomposition with the linear Bspline wavelet. Since TWS computes low resolution im-
Hierarchical Wavelet Splatting
We can now introduce a new variant called hierarchical wavelet splatting (HWS), which combines the strengths of both TWS and WS. Instead of sorting and merging approx165
(a) 32767
(a) 82767
(b) 32767
Figure 4. Renderings by WS.
Figure 5. (a) Partial reconstruction using only 4% of the coefficients. (b) Full reconstruction.
imation and detail coefficients like in WS, HWS generates two sequences of coefficients: a sequence containing only approximation coefficients and another sequence containing all detail coefficients. Since the approximation coefficients cM k are all of the same decomposition level, we can use twostage splatting to increase rendering speed. The sequence containing the detail coefficients is sorted in descending order, as in ordinary WS. Both sequences can be compressed by deltacoding, normalization, and quantization. During user interaction, only the sequence containing the approximation coefficients is used. When interaction ceases, the image is refined incrementally with the detail coefficients.
4
(b) 2023421
5
Discussion
We formulated a new variant of wavelet splatting, called hierarchical wavelet splatting. Image quality for low resolution images is higher in comparison to WS, since HWS uses all approximation coefficients to generate the image. In contrast, WS uses a mixture of approximation and detail coefficients, which leads to images that are difficult to interpret when a small number of coefficients is used. Since HWS uses only approximation coefficients to compute low resolution images, it can make use of two-stage splatting to increase rendering speed. Although HWS has less freedom to choose the number of coefficients used for rendering, it is faster than WS for similar image quality.
Experimental results
We applied HWS and WS to the CT head data set to investigate their performance and visual quality. A twolevel wavelet transform with the linear B-spline wavelet was used. Table 1 shows cumulative rendering times (in msec) of HWS and WS on a Pentium II 400 MHz processor. The first row shows the rendering time of a low resolution image. The second row shows the time after which the relative L2 norm (mean squared error) of the difference between the partial reconstruction and the image at full resolution is less than 0.0001. Both methods reach this point using 82767 coefficients. Since HWS uses two-stage splatting when computing low resolution images, rendering time is much shorter.
References [1] R. A. DeVore, B. Jawerth, and B. J. Lucier. Image compression through wavelet transform coding. IEEE Transactions on Information Theory, 38(2):719–746, 1992. [2] R. A. Drebin, L. Carpenter, and P. Hanrahan. Volume rendering. Computer Graphics (SIGGRAPH ’88 proceedings), 22(4):65–74, 1988. [3] A. C. Kak and M. Slaney. Principles of Computerized Tomographic Imaging. IEEE Press, New York, 1988. [4] L. Lippert and M. H. Gross. Fast wavelet based volume rendering by accumulation of transparent texture maps. Computer Graphics Forum, 14(3):431–443, 1995. [5] L. Lippert, M. H. Gross, and C. Kurmann. Compression domain volume rendering for distributed environments. Computer Graphics Forum, 16(3):96–107, 1997. [6] T. Malzbender. Fourier volume rendering. ACM Transactions on Graphics, 12(3):233–250, 1993. [7] J. Wang and H. K. Huang. Medical image compression by using three-dimensional wavelet transformation. IEEE Transactions on Medical Imaging, 15(4):547–554, 1996. [8] M. A. Westenberg and J. B. T. M. Roerdink. X-ray volume rendering through two-stage splatting. Technical Report 99–9–11, Institute for Mathematics and Computing Science, 1999. To appear in Machine Graphics & Vision. [9] L. A. Westover. Footprint evaluation for volume rendering. Computer Graphics, 24(4):367–376, 1990.
Table 1. Cumulative rendering times (msec). HWS WS low resolution (32767) 63 275 L2 < 0.0001 (82767) 399 582
Figure 5(a) shows an image rendered by HWS using only 4% of the wavelet coefficients, and Fig. 5(b) shows the full reconstruction. Differences between these images are hardly distinguishable, providing an extra motivation for the use of wavelets. 166