minor planet observing is performed around full Moon, when regular survey .... Sky Ñats are being taken in twilight several times a year; however, they were not ...
THE ASTRONOMICAL JOURNAL, 120 : 2131È2147, 2000 October ( 2000. The American Astronomical Society. All rights reserved. Printed in U.S.A.
THE FIRST US NAVAL OBSERVATORY CCD ASTROGRAPH CATALOG N. ZACHARIAS, S. E. URBAN, M. I. ZACHARIAS,1 D. M. HALL, G. L. WYCOFF, T. J. RAFFERTY, M. E. GERMAIN,2 E. R. HOLDENRIED, J. W. POHLMAN, F. S. GAUSS, D. G. MONET,2 AND L. WINTER1 US Naval Observatory, 3450 Massachusetts Avenue NW, Washington, DC 20392 ; nz=pisces.usno.navy.mil Received 2000 April 20 ; accepted 2000 June 27
ABSTRACT The USNO CCD Astrograph (UCA) started an astrometric survey in 1998 February at Cerro Tololo, Chile. This Ðrst, preliminary catalog (UCAC1) includes data taken up to 1999 November with about 80% of the Southern Hemisphere covered. Observing continues, and full sky coverage is expected by mid-2003 after moving the instrument to a Northern Hemisphere site in early 2001. The survey is performed in a single bandpass (579È642 nm), a twofold overlap pattern of Ðelds, and with a long and a short exposure on each Ðeld. Stars in the magnitude range 10È14 have positional precisions of ¹20 mas. At the limiting magnitude of R B 16 mag, the positional precision is 70 mas. The UCAC aims at a density (stars per square degree) larger than that of the Guide Star Catalog (GSC) with a positional accuracy similar to Tycho. The UCAC program is a major step toward a high-precision densiÐcation of the optical reference frame in the postÈHipparcos era, and the Ðrst stage, the UCAC1 contains over 27 million stars. Preliminary proper motions are included, which were derived from Tycho-2, Hipparcos, and ground-based transit circle and photographic surveys for the bright stars (V ¹ 12.5 mag) and the USNO A2.0 for the fainter stars. The accuracy of the proper motions varies widely, from 1 to over 15 mas yr~1. The UCAC1 is available on CD-ROM from the US Naval Observatory. Key words : astrometry È catalogs È Galaxy : kinematics and dynamics È surveys 1.
INTRODUCTION
1998 ; Ra†erty 1999 ; Zacharias, Ra†erty, & Zacharias 2000) ; however, this is the Ðrst detailed paper. The project history and the observations are described in °° 2 and 3, respectively, followed by a detailed account of the reduction procedures for the positions and proper motions. Results, presented in °° 6È8, are discussed in ° 9, and the catalog is explained in ° 10.
The US Naval Observatory CCD Astrograph Catalog (UCAC) project is a new observational program. Survey observations started in 1998 February in the Southern Hemisphere and are still ongoing. Because of the signiÐcant improvement of even these Ðrst results over publicly available data, it was decided to publish a preliminary, incomplete catalog at this stage. Positions of 27 million stars, covering about 80% of the Southern Hemisphere, are available together with preliminary proper motions and approximate red magnitudes. The catalog covers the magnitude range of about 8È16 with an average positional precision of 31 mas per coordinate at a mean epoch of B1999.0. Most bright stars (R ¹ 8.0 mag) and problem stars are omitted in this release, and a simpliÐed reduction technique was adopted. UCAC1 is only about 10% as dense as the USNO A2.0 catalog (Monet 1999). However, the UCAC1 positions are about a factor of 5 more precise than those of the A2.0. UCAC1 has a density (number of stars per square degree) about a factor of 2 larger than the Guide Star Catalog (GSC) (Lasker et al. 1990). The positional accuracy of UCAC1 is an order of magnitude better than that of GSC and similar to Tycho (ESA 1997). The UCAC1 is on the International Celestial Reference System (ICRS), while the GSC is on the FK5 system, following its zonal systematic errors. The majority of stars (V º 10.5 mag) in the new Tycho-2 catalog (HÔg et al. 2000a) have positions less precise than in UCAC1 at current epochs and in the area covered so far. However, systematic errors in Tycho-2 are likely smaller than in UCAC1. Status reports on the UCAC project have been given in the past (Zacharias, Germain, & Ra†erty 1997 ; Urban
2.
PROJECT HISTORY
The Twin Astrograph of the US Naval Observatory (USNO) and its Boller & Chivens mount were constructed in 1970. It has 2 tubes with 2 lenses (originally blue and yellow) of 200 mm aperture (f/10), designed for wide-Ðeld photographic astrometry. A separate guide scope was attached. Between 1977 and early 1986 this instrument made the observations for the Twin Astrographic Catalog (Zacharias & Zacharias 1999a) from its Washington DC location. Between 1986 and 1991 the instrument was stationed at the Black Birch Astrometric Observatory (BBAO) in New Zealand before it returned to Washington, DC. At BBAO, selected Ðelds for the radioÈoptical extragalactic reference frame link were observed (Zacharias et al. 1999). In 1993 a new, 5-element lens (Vukobratovich et al. 1990), corrected for the red spectral bandpass (550È710 nm), was installed, replacing the blue lens. This new lens was made by the University of Arizona Optical Science Laboratory. Designed for photographic plates, the lens provides a 9¡ diameter, Ñat-Ðeld of view at a focal length of 2.0 m with a scale of 100A mm~1. The original, visual-bandpassÈ corrected lens of the same focal length remained in the second tube of the astrograph. Originally, a complete astrometric sky survey down to 14th magnitude was envisioned by using photographic plates for both the red and visual bandpasses. The idea of this project can be traced back to the ““ AGK4 ÏÏ proposal (de Vegt 1979). Aiming at B50 mas accuracy it was the logical next step for the densiÐcation of the optical reference frame (Zacharias 1998) after a successful HipparcosÈTycho mission (ESA
ÈÈÈÈÈÈÈÈÈÈÈÈÈÈÈ 1 Also with Universities Space Research Association. 2 At USNO, Flagsta†, AZ
2131
2132
ZACHARIAS ET AL. TABLE 1 TIME LINE Date 1995 1996 1997 1997 1997 1998 1998 1998 1998 1998 1999 2000 2001 2003
............... Jan . . . . . . . . . . . Jan . . . . . . . . . . . Mar 6 . . . . . . . Apr . . . . . . . . . . Jan 4 . . . . . . . . Jan 10 . . . . . . . Feb 13 . . . . . . May 27 . . . . . . Sep 15 . . . . . . . Nov 15 . . . . . . Mar . . . . . . . . . Mar . . . . . . . . . Jun . . . . . . . . . .
Activity 1k camera, proof of concept Initial plan, budgeting 4k camera arrives First light at Washington, DC Comparison with Tycho data Start assembling at CTIO First light at CTIO Start survey observing 10% Southern Hemisphere complete 25% Southern Hemisphere complete 80% Southern Hemisphere complete Release of Ðrst catalog Concluding observing at CTIO Expected full sky coverage
1997). However, the risk of a discontinuation of astronomical emulsions and the great increase in costs of microÑat photographic plates put this project on hold. In 1995 an MPP-type charge-coupled device (CCD) was acquired by USNO. This 1k ] 1.5k Kodak CCD has a small pixel size (9 km) and can be operated with simple thermoelectric cooling. The new camera was used at the red lens of the USNO Twin astrograph. A feasibility study (Zacharias 1997) revealed extraordinarily good results, 15 mas positional precision from frame-to-frame transformations. Shortly thereafter the US Naval Observatory CCD Astrograph (UCAC) project was planned and initiated (Gauss et al. 1996 ; Zacharias et al. 1997). In the early days the project was called UCAC-S, with ““ S ÏÏ meaning south, as the original plan called for an observing program on the Southern Hemisphere only, the section of the sky routinely in need of better data as compared to the Northern Hemisphere. Owing to the success of the project so far, a full-sky coverage of UCAC using the same telescope is now the goal. A large-format camera with a Kodak 4k ] 4k CCD of a design similar to the 1k chip was obtained from Spectral
Vol. 120
Instruments, Tucson, AZ. An interference Ðlter (Andover Corporation) of high optical quality substitutes for the CCD camera window. The bandpass (579È642 nm) was chosen to avoid strong emission lines, particularly Ha, to take advantage of the overall quantum efficiency of the system, and to be narrow enough to minimize di†erential color refraction. During 1996 and 1997 the instrument was modiÐed and tested to allow automated operation of the camera, the telescope motion, guiding, and dome rotation. An agreement for use of an available dome was reached with the Cerro Tololo Inter-American Observatory (CTIO), Chile, and the instrument was disassembled at Washington, DC and shipped to CTIO in 1997 December. A timeline of the project is given in Table 1. It took only 7 days in 1998 January to assemble the instrument out of the shipping boxes, to modify the dome signiÐcantly with incredible support by the CTIO sta†, and to have Ðrst light. An additional 4 weeks were spent on testing and calibrating. On 1998 February 13, the Ðrst survey Ðelds were taken. 3.
OBSERVATIONS
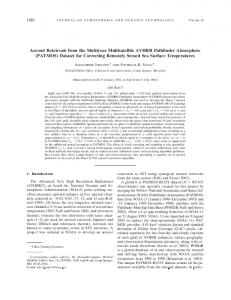
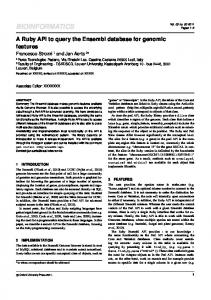
For the UCAC1 release, observations are included from the beginning of the survey, 1998 February 13/14, through the night of 1999 November 7/8. Only regular survey Ðelds are included. The sky coverage of these 32,515 Ðelds with CCD data of acceptable quality is shown in Figure 1. 3.1. Instrument All observations for the positions presented in UCAC1 were obtained with the US Naval Observatory Twin Astrograph, located at CTIO. Parameters of the telescope and the camera are summarized in Tables 2 and 3, respectively. The telescope is actively guided, using an ST-4 (SBIG) autoguider CCD at the visual-corrected lens, with a Barlow-lens added. The guider can move on an x, y stage in its B2¡ wide Ðeld of view. The 4k CCD camera is mounted at the red-lens focal plane, centered on the optical axis. The camera utilizes only
FIG. 1.ÈUCAC1 survey Ðelds observed between 1998 February and 1999 November. This Aito† equal-area projection uses equatorial coordinates.
No. 4, 2000
FIRST USNO CCD ASTROGRAPH CATALOG TABLE 2 PARAMETERS OF THE RED LENS OPTICS Parameter
Value
Clear aperture . . . . . . . . . . . . . . . . . . . . . Focal length . . . . . . . . . . . . . . . . . . . . . . . . Plate scale . . . . . . . . . . . . . . . . . . . . . . . . . . Number of lens elements . . . . . . . . . Spectral bandpass of lens . . . . . . . . . Airy disk diameter (610 nm) . . . . . . Usable Ñat Ðeld of view . . . . . . . . . . .
206 mm 2057 mm 100A mm~1 5 550È710 nm 15 km B9¡
a fraction of the Ðeld of view available to the lens, which gives very uniform, high-quality imaging all over the CCD area. The biggest problem with the 4k camera is its relatively low charge transfer efficiency (CTE) (Holst 1996). An adjustment to the last-gate voltage and the clock frequency and raising the operating temperature to [18¡C improved the CTE and still kept the dark current and signal-to-noise ratio at an acceptable level. For data acquisition and archiving, 4 computers are on site. An embedded 386 Single Board Computer (SBC) is used to control the dome, guider and telescope itself. PC1, a 200 MHz Pentium with 256 Mbyte memory, is used to interface with the SBC, to operate the 4k CCD camera, and can be used for pixel data reductions. The interface is graphical, based on the Microsoft Foundation Class library. A second Pentium PC (64 Mbyte memory) is used to write CD-ROMs. An HP workstation (256 Mbyte memory) is used for the on-line reductions, image display, pixel data reduction, and backup to 8 mm Exabyte tapes. 3.2. Operation From the observing list of the night, PC1 selects a new Ðeld, based on the current sidereal time, calculated from Universal Time (UT), which is fed into the system from a GPS receiver. Sequentially, the telescopeÏs right ascension and declination are set under PC control. Next the dome is rotated and the x, y stage of the guider is set according to preselected and calculated positions for each Ðeld. An ST-4 exposure is taken to verify the availability of a suitable guide star. If the telescope pointing is not within the tolerance of about 30A, the telescope is automatically moved to center the guide star using a feedback from the ST-4. Then the system is automatically switched into guide mode. After 20 s of guiding, the shutter of the camera opens to start the TABLE 3 PARAMETERS OF THE CCD CAMERA Parameter
Value
Number of pixels . . . . . . . . . . . . Field of view . . . . . . . . . . . . . . . . . . Pixel size . . . . . . . . . . . . . . . . . . . . . . Pixel scale . . . . . . . . . . . . . . . . . . . . . Spectral bandpass used . . . . . . Filter replaces window . . . . . . Readout . . . . . . . . . . . . . . . . . . . . . . . Readout noise . . . . . . . . . . . . . . . . Full well capacity . . . . . . . . . . . . Gain setting . . . . . . . . . . . . . . . . . . Operating temperature . . . . . . Limiting magnitude . . . . . . . . . .
4096 ] 4096 61@ ] 61@ 9.0 km 0A. 905 pixel~1 579È642 nm j /4 quality 14 bit 13 e~ 85,000 e~ 5.65 e~ ADU~1 B[18C B16.0, 2 minutes
2133
long exposure. Its duration, 100È150 s, depends on atmospheric conditions and zenith distance. At the end of the exposure a 17 s long readout with direct memory access (DMA) and a B5 s write to disk complete the transfer of the compressed (16 Mbyte) raw frame to PC1. Without interruption in guiding, the short exposure of one-Ðfth the duration of the long exposure is started. After this pair of frames has been taken on the same Ðeld, the cycle begins again with the selection of a new Ðeld. In parallel the raw data are transferred to the workstation, where the on-line reduction starts to provide quality control statistics (see ° 3.6). An observer is present to open the dome, initiate the automatic observing sequence, follow the progress on the PC console, and interact if required ; e.g., in case of clouds or when a change of parameters is required. The complex lens and temperature gradients make a frequent check on the focus necessary. With a dedicated automatic routine 2 halves of a 4-hole Hartman screen are rotated in front of the lens, a focus star of about 5th magnitude is acquired, and two intra- and two extrafocal frames of 10 s exposure time are obtained. The best focus is calculated and set. A complete focus sequence takes about 5 minutes. If a plausible focus is obtained, the operator continues with the regular observing. The precision of this focus measurement is on the order of 0.02 mm, better than the depth of focus requires. Depending on the weather conditions throughout the night, a focus is measured every 1È3 hr. The observing throughput is typically 24 frames (12 Ðelds) per hour. 3.3. Schedule With a Ðeld of view of 61@, a twofold overlap pattern (center in corner) was adopted with a grid step size of 0¡.5. The nominal survey pattern uses International Celestial Reference Frame (ICRF) coordinates, which are compliant with J2000 coordinates. No frames centered on the South Pole were taken. Instead, the Ðrst zone is at declination [89¡.5, with zones following in 0¡.5 steps. Table 4 gives details about the survey pattern. A sufficient number of Ðelds have been selected at each declination to completely cover all areas along right ascension (R.A.). For adjacent bands of declination with the same number of Ðelds along R.A., the regular center-in-corner pattern could be adopted. Whenever the number of Ðelds along R.A. changes, the adjacent block of zones is shifted by a random fraction of the Ðeld size along R.A. Thus the Ðrst Ðeld is not always centered on exactly 0h. 0 (or 0¡.5) ; instead it is randomly between 0¡ and 1¡. This approach improves the rigidity in a future block adjustment of the data. Regular survey Ðelds are usually observed within 0h. 2 of the meridian. Exceptions are made around the Moon, when the allowed hour angle range is extended to 0h. 6. Owing to the narrow bandpass and relatively short exposure times, only about 10% of the available hours per month are lost due to the Moon. Observations are also performed in nonphotometric conditions. The requirement is acceptable seeing and average transparency to reach a limiting magnitude of R B 15.7 mag, while most long exposures reach 16.0 mag. UThe limiting magnitude is deÐned as the magnitude at which the formal Ðt error of a single observation reaches 0.1 pixel or 90 mas. It varies slightly as a function of x, y on the CCD owing to dark current properties. With the exception of Pluto, all major planets, and minor planets brighter than 13 mag, are being avoided. Occasionally fainter minor planets will show up on UCAC
2134
ZACHARIAS ET AL.
Vol. 120
TABLE 4
TABLE 5
SURVEY ZONE PATTERN
CALIBRATION FIELDS
Zone Number
Declination of Zones
Number of Fields along R.A.
1 ............... 2 ............... 3È4 . . . . . . . . . . . . 5È6 . . . . . . . . . . . . 7È9 . . . . . . . . . . . . 10È12 . . . . . . . . . 13È15 . . . . . . . . . 16È18 . . . . . . . . . 19È22 . . . . . . . . . 23È26 . . . . . . . . . 27È30 . . . . . . . . . 31È34 . . . . . . . . . 35È38 . . . . . . . . . 39È42 . . . . . . . . . 43È47 . . . . . . . . . 48È57 . . . . . . . . . 53È57 . . . . . . . . . 58È62 . . . . . . . . . 63È67 . . . . . . . . . 68È72 . . . . . . . . . 73È77 . . . . . . . . . 78È83 . . . . . . . . . 84È89 . . . . . . . . . 90È95 . . . . . . . . . 96È101 . . . . . . . . 102È108 . . . . . . . 109È115 . . . . . . . 116È122 . . . . . . . 123È130 . . . . . . . 131È138 . . . . . . . 139È146 . . . . . . . 147È155 . . . . . . . 156È164 . . . . . . . 165È180 . . . . . . .
[89.5 [89.0 [88.5 to [88.0 [87.5 to [87.0 [86.5 to [85.5 [85.0 to [84.0 [83.5 to [82.5 [82.0 to [81.0 [80.5 to [79.0 [78.5 to [77.0 [76.5 to [75.0 [74.5 to [73.0 [72.5 to [71.0 [70.5 to [69.0 [68.5 to [66.5 [66.0 to [64.0 [63.5 to [61.5 [61.0 to [59.0 [58.5 to [56.5 [56.0 to [54.0 [53.5 to [51.5 [51.0 to [48.5 [48.0 to [45.5 [45.0 to [42.5 [42.0 to [39.5 [39.0 to [36.0 [35.5 to [32.5 [32.0 to [29.0 [28.5 to [25.0 [24.5 to [21.0 [20.5 to [17.0 [16.5 to [12.5 [12.0 to [ 8.0 [ 7.5 to 0.0
8 11 17 24 33 42 52 61 73 86 98 110 122 133 148 162 176 190 203 216 228 242 256 269 281 295 307 318 329 338 346 353 358 360
frames. In this preliminary catalog no attempt has been made to identify such objects. 3.4. Fields around Bright Stars Fields around stars of magnitude V ¹ 5 mag are being observed with a set of 15 exposures of 1 or 2 s duration. A smaller CCD frame area is used to speed up the readout process. Frames are combined pixel-by-pixel and stored as FITS 2-byte integer Ðles, dropping the least signiÐcant bits. This procedure allows for the detection of close companion stars by reducing the overexposure e†ects of the bright, central star on the CCD. The bright stars are generally saturated, and no reliable position can be extracted. The goal here is to obtain a more complete catalog toward fainter magnitudes, including areas in the sky that are traditionally not accessible by Schmidt plates. For UCAC1, no such bright star Ðeld short exposures were used. 3.5. Special Fields In addition to the regular survey Ðelds a total of 26 calibration Ðelds are being observed typically 3 times a year each with a 3 ] 3 overlap pattern and 150 s exposure time. The Ðelds are listed in Table 5. Most of the calibration Ðelds contain an extragalactic reference frame source (Ma & Feissel 1997 ; Ma et al. 1998 ; Zacharias et al. 1999) and are at low galactic latitudes in order to provide a high star
0336[019 0458[020 0646[306 0717]000 0743[006 0826[373 0906]015 0925[203 1101[536
1116[462 1349[439 1451[375 1656]053 1657[261 Galactic Center 1758[651 1850]000 1937[101
1954[388 2059]034 HDF[S 2254]024 NGC 2244 NGC 2548 NGC 3532 IC 4756
density. Also included are 4 open clusters, the center of the Milky Way, the Hubble Deep Field South (HDF-S), and two Ðelds (0717]000, 1850]000) overlapping with the FASTT (Stone, Pier, & Monet 1999) data. About once a month at least one calibration Ðeld is observed with the telescope being alternatively on the west and then east side of the pier. These ““ Ñipping ÏÏ observations allow a calibration of some systematic errors, in particular those related to the poor CTE (see ° 4.4.1). As part of the program to link UCAC data to the extragalactic reference system, observations are performed about 4 times a year at the CTIO 0.9 m reÑector. Optical counterparts of radio sources are imaged on a 2k CCD in an B11@ Ðeld of view using a customized Ðlter with the same bandpass as the astrograph. Simultaneously (within about a week) the same Ðelds are observed at the astrograph, taking short and long (200 s) exposures with the telescope being alternately on the west and east side of the pier. In addition, the central areas of the optically faintest of those sources are being observed at the 1.6 m LNA telescope, Brazil (AssaÐn et al. 2000). Minor planets are being observed with the astrograph as well. A list is provided by the USNO AA department for objects of interest for mass determination. Most of the minor planet observing is performed around full Moon, when regular survey observing is restricted. 3.6. Quality Control While the telescope is moving to the next Ðeld, the longand short-exposure frames of the previous Ðeld arrive at the HP workstation. New frames are automatically reduced with an abbreviated reduction scheme, omitting the Ðt of most detected images. However, all bright stars as well as a sample of stars over all magnitudes are being processed in this on-line reduction. In addition, a match with the Tycho stars is made, providing photometric calibration as well as actual frame centers in equatorial coordinates. About 2 minutes after the frames are taken, status lines are displayed at the workstation monitor for the last 12 frames. All relevant quality control data are listed, including saturation and limiting magnitude, o†set of frame center with respect to the nominal survey pattern, average full width at halfmaximum (FWHM) of the stellar image proÐles, mean image elongation, and background level. These data allow the observer to judge the sky condition, status of the telescope focus, Ðeld centering, and guiding, in order to take action if required. During the daytime a complete reduction of the frames is performed, and similar quality control statistics are derived. Every afternoon, the observing schedule program looks at the entire observing history including those quality control
No. 4, 2000
FIRST USNO CCD ASTROGRAPH CATALOG
output Ðles. Frames are rejected for limiting magnitude, Ðeld centering, mean image elongation, mean image proÐle Ðt precision, high background level, and hardware problems such as shutter failure (see ° 3.8). Two slightly di†erent tolerances are adopted for frames taken in the pole area (d ¹ [77¡.5) and the rest of the survey. This was required owing to the inferior quality of the data at large zenith distances and the fact that tracking and guiding is much more difficult close to the pole. In any case the tolerances are very tight, e.g., if images are elongated by more than 11% (average of a frame), the frame is rejected. On average 10% of all frames taken are rejected. If an accepted long and short exposure on a Ðeld are available, the Ðeld is no longer put on the observing list. Otherwise both a long and a short exposure are scheduled for observing. Thus sometimes there are more than 2 good frames per Ðeld taken. 3.7. Initial Calibration In the testing and commissioning phase between 1998 January 10 and February 13, a total of 690 calibration frames were taken. The camera was mounted at the back end of the telescope in a 90¡ rotated position (B) with the x-axis parallel to declination. Later the camera was moved into its standard position (A) with the x-axis parallel to right ascension. In both camera orientations, observations were made with the telescope being alternately on the east and west side of the pier in order to obtain CCD frames that are rotated by 180¡ with respect to the sky. For each camera position, the tilt of the CCD with respect to the telescopeÏs focal plane was adjusted using a procedure similar to the one described in the AGK2 project (Schorr & Kohlschutter 1951). The adjustment could be made to within about 0¡.05 ; thus, no plate tilt parameters were required in the astrometric reductions for the UCAC1. The construction of the backplate of the telescope and the camera mounting was performed by the USNO instrument shop to such high precision that the alignment of the CCD with respect to equatorial coordinates in the sky is o† by less than 0¡.2. Thus, the cross-correlation between the x-axis and declination is negligible. 3.8. Problems About once per night the telescope interface crashes, and a reboot of PC1, running Windows 95, is required. Several times a night, the direct memory access (DMA) of the CCD camera to PC1 has a timeout error. When this happens the frame is automatically reobserved immediately. An occasional hang-up of the ftp from PC1 to the workstation is resolved by manual interaction of the observer. The readout of the focus and temperature probes sometimes gets corrupted. Therefore all observing log Ðles, generated out of the FITS headers of the raw data, are manually checked and edited. The dome rotation sometimes fails, necessitating a reboot of the single board computer. Because a telescope operator needs to be present anyway, the level of hardware and interface performance was considered sufficient, enabling a timely start of the project. This strategy has proved itself. In the entire 2 yr of operation so far, fewer than 10 nights were lost owing to instrumental problems. An increase of the current 95% efficiency in observing to above 99% would have cost at least another year of instrumental improvements. The Ðrst night lost due to instrumental problems occurred after a full year of operation, when the dome rota-
2135
tion failed. In 1999 April, the cooling of the camera failed, and the instrument was down for 5 nights until the electronics were Ðxed. From 1998 December 1998 until 1999 August, sometimes the mechanical shutter failed to close (B20% of frames), causing readout streaks of bright stars. The problem was discovered accidentally in 1999 May. It was shown that faint streaks of medium bright stars can be handled by software. However, streaks of about 50 or more counts from very bright stars can not be removed completely by software. The amplitude of the random scintillation (brightness variations) of those streaks is too large, a†ecting stellar images of faint stars that happen to lie along the path of the streak. A list of about 500 Ðelds was scheduled for reobserving. A new shutter installed in 1999 August often failed to open. The refurbished old shutter was installed in 1999 September, and the instrument has been operating Ñawlessly since then. These failures would have had considerably more impact without the expertise and cooperation of the CTIO sta†. 4.
DERIVING POSITIONS
Details about the data structure and computer hardware have been presented elsewhere (Zacharias & Zacharias 1999b). Here we will outline the CCD frame reduction process and describe the results leading to the catalog. 4.1. Raw Data Reduction Raw data frames are saved to disk with a FITS header and record structure ; however, the pixel data are compressed. The idea is to store only the di†erence in pixel counts between adjacent pixels in a 1 byte integer instead of the 2 byte integer per pixel. The additional computational load on the CPU is more than compensated by the reduced I/O time of the Ðle size, which is basically cut in half. Thus a 4094 ] 4094 pixel frame with 14 bit dynamic range results in a 16 Mbyte Ðle. This also gives a signiÐcant advantage for archiving the raw data (2 copies on tape, 1 copy on CD-ROM). The 4k Kodak CCD is of high cosmetic quality without any column defects and no dead pixels. However, there is a signiÐcant number of hot pixels and with the CCD operated at a relatively high temperature of [18¡C to increase the charge transfer efficiency (CTE) (see ° 4.4.1), dark current correction is essential. About once a month a set of B45 darks for each exposure time is taken at night when the full Moon interferes or when it is cloudy. A combined dark per set is obtained from an unweighted mean of individual pixel counts over all acceptable dark frames excluding the lowest and highest 3 values for each pixel. The combined darks are subtracted from the raw frames. The properties of the darks vary as a function of ambient temperature and vacuum pressure inside the CCD Dewar, even though the CCD temperature is kept constant to within 0¡.1C. Even after selecting the most appropriate, combined dark for a given frame, a pattern in the background is seen mainly as a gradient of a few counts along the x-axis. This is corrected by adopting a linear function to Ñatten the background. Sky Ñats are being taken in twilight several times a year ; however, they were not applied for the current catalog. The Kodak CCD is intrinsically very Ñat, and no signature of the optics is observed. A signiÐcant part of the CCD area (at low x-values) shows a larger noise than the rest of the chip,
2136
ZACHARIAS ET AL.
resulting in more hot pixels above a given threshold and a slightly (B0.2 mag) reduced limiting magnitude. 4.2. Image ProÐle Fits Detection of images of celestial objects was performed on the processed CCD frames (see ° 4.1). A single average background scatter, p , is obtained from a histogram of the bgr pixel data. Assuming a Ñat background, a threshold is set to 3.0 p above the background to create a binary image. bgr Whenever 3 clustered pixels are above the threshold, an object is considered detected. An area of about 10 ] 10 pixels around the detected objects (larger for brighter objects) is used from the processed CCD frame for the twoimage proÐle Ðts per object. The Ðrst uses a spherically symmetric two-dimensional Gaussian proÐle, the second an elliptical Gaussian proÐle including parameters for the ratio of the axes (elongation) and their orientation. Only the elongation and orientation parameters from the elliptical Ðt are used ; the center position, amplitude, proÐle width, and background level are taken from the spherically symmetric model. All image proÐle Ðt results were archived to tape and CD-ROMs. 4.3. Reference Stars A reference star catalog was constructed based on the Hipparcos and Tycho Catalogues (ESA 1997) and the ACT (Urban, Corbin, & Wyco† 1998). If a star is in the Hipparcos Catalogue, its position and proper motion was adopted. For most of the remaining stars, the ACT proper motions were adopted along with the T ycho-1 \ ACT position. In case the proper-motion error of an ACT star exceeded that of the Tycho-1 Catalogue by a factor of 1.2, the Tycho-1 proper motion was taken instead. Normally, only stars Ñagged in the Hipparcos and Tycho Catalogues as astrometrically suitable were used in the UCAC1 reductions. All stars were sorted by declination and put in an unformatted direct access Ðle, indexed by a running number. Reference stars were identiÐed with the x, y data on a frame-by-frame basis at the time of the daily quality control procedure utilizing the reference starsÏ position and proper motion as well as the approximately known CCD frame center and mapping model. 4.4. Astrometric Reduction of CCD Frames Each frame, the long as well as the short exposures, was reduced individually, typically utilizing between 10 and 40 reference stars. Long-exposure frames have fewer usable reference stars due to saturation at about magnitude 10 versus 8 for the short exposures. For future reductions, the short and long exposures will be combined before linking to reference stars. An initial simple test of combining the exposures did not give acceptable results and a detailed investigation is in progress. A total of 79,931 CCD frames within the UCAC1 area have acceptable quality. For 79,686 CCD frames, successful ““ plate ÏÏ solutions were obtained. For 1629 frames, the regular solution failed owing to a lack of reference stars, and an alternative solution (see ° 4.4.5) was attempted. For 245 frames, both astrometric reductions failed, mainly because of 3 or fewer available reference stars. Thus there will be some holes, mainly in the long-exposure coverage in Milky Way areas with extended dark clouds. All ““ problem cases,ÏÏ entire frames as well as individual stars, have been omitted
Vol. 120
from this preliminary catalog. The Ðnal catalog will have no holes. Corrections for systematic errors were derived from test reductions iteratively, starting with the biggest e†ect. After applying preliminary corrections for various e†ects, each systematic error was investigated again to improve the model. 4.4.1. Correcting x,y for the CT E E†ect
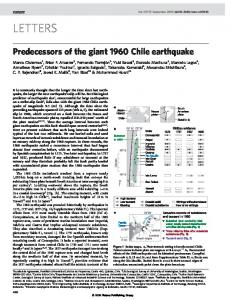
By far the biggest systematic error in the raw x, y data originates from a relatively low charge transfer efficiency (CTE) of our CCD. Image centers are shifted proportional to the x-value, i.e., along the fast readout (Holst 1996). Unfortunately, this e†ect also depends on the magnitude of the star, causing a coma-like error. The astrograph can rotate the CCD camera by 180¡ with respect to the sky by observing on the opposite side of the pier (Ñipped telescope position). A comparison of the raw x, y data of 2 otherwise similar CCD frames, with 1 frame obtained on either side of the pier, reduces the xdependency of this e†ect to a constant, leaving only the magnitude dependency. The only assumption made here is that the e†ect is linear in x. No assumptions are made for the dependency on magnitude. Figure 2 shows an example. The raw instrumental magnitude is used here, which is scaled to 10 mag being the saturation limit by deÐnition, regardless of the length of the exposure. A linear model was
FIG. 2.ÈResiduals from a transformation of 7 pairs of CCD frames per exposure time obtained from Ñipping the telescope. These raw data show the sum of the CTE e†ect from the direct and Ñipped CCD frames. The Ðgure on top is for 20 s exposure time, while the bottom one is for 100 s. Each point is the average of 100 residuals.
No. 4, 2000
FIRST USNO CCD ASTROGRAPH CATALOG
2137
used in weighted, least-squares transformations of the x, y data, after applying corrections for systematic errors depending on the amplitude of the image proÐle (see ° 4.4.2). Several frame pairs were used for each exposure time. The residuals were sorted by raw instrumental magnitude and averaged, 100 per dot. Figure 2 shows the sum of the systematic errors from the direct and Ñipped frames. The e†ect is as large as ^70 mas for a single CCD frame. For this preliminary reduction, a linear model with respect to magnitude was adopted for the corrections *x owing to the CTE e†ect, *x \ cx(m [ m ) 0 with x in original pixel units (0È4094) and m in raw instrumental magnitudes. A value of m \ 13.0 was adopted for a 0 mean magnitude, and the slope parameter c is in the range of 6.3È10.0 ] 10~6 mag~1. An average slope parameter was derived for each exposure time separately, utilizing several hundred calibration frames taken over the period covered by the UCAC1 observations. An epoch-dependent e†ect has been found recently. Also, the adopted linearity with magnitude is only an approximation. These reÐnements were not included in the current reductions. A more detailed investigation of this and other systematic errors in the UCAC data is in progress. 4.4.2. Correcting x,y as a Function of Amplitude
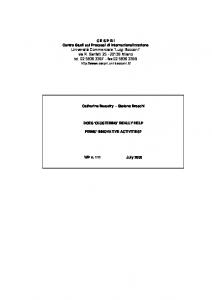
The following systematic error investigations are based on analyzing residuals with respect to reference stars only. The CCD frames have been obtained with the telescope being only in the ““ direct ÏÏ orientation, i.e., west of the pier. All data are corrected for the CTE e†ect as outlined in the previous section before reduction continued. Heavily saturated images of bright stars are automatically excluded because no successful image proÐle Ðt could be obtained. For images close to saturation, a signiÐcant, systematic, position o†set was found, as shown in Figure 3. Using a look-up table with linear interpolation, corrections were applied to the y-coordinate (declination) only, for the stellar image proÐle amplitude range of 12,000È25,000 counts. Nominal saturation (full well capacity) occurs at an amplitude of B15,000 counts (ADU). In the standard astrometric reductions for this catalog, images with an amplitude exceeding 14,500 were excluded. A future, proper handling of the astrometry of images close to saturation (B8 and 10 mag for the short and long exposures, respectively) will certainly involve parameters such as the subpixel fraction of the image center position as well as the proÐle width. 4.4.3. Pixel Phase Systematic Errors
After corrections for the CTE and amplitude e†ects were applied, a test reduction including all B79,000 frames of the UCAC1 data set was performed. Figure 4 shows the residuals (with respect to reference stars) of this reduction versus the fraction of the image center pixel position (sometimes called phase, or subpixel). Clearly a wave pattern is seen with an amplitude of B12 mas. First-order Fourier terms were Ðtted to this pattern, and corrections applied in the Ðnal reduction. 4.4.4. Field Distortions
Optical Ðeld angle distortions are very small with this dedicated astrometric instrument. For the lens itself, the third-order term is about 0A. 05 deg~3. Some e†ects are
FIG. 3.ÈResiduals vs. amplitude of the image proÐles after correcting for the CTE e†ect. Each point represents the mean of 500 residuals. Results of a test run over 10,000 frames are shown. Saturation (full well capacity) is reached at 15,000 counts.
expected from the Ðlter in front of the CCD. Residuals from a test reduction were binned in the x, y plane. Vectors up to 20 mas in length are found, with the average systematic error per coordinate being in the order of 5 mas (see Fig. 5). The Ðeld distortion pattern has been applied to the x, y data prior to the Ðnal reduction run. 4.4.5. Functional Model
A linear model has been adopted to map the x, y data to tangential coordinates (m, g) in a standard astrometric ““ plate ÏÏ reduction : m \ ax ] by ] c ] ex ] fy g \ [bx ] ay ] d ] fx [ ey . Parameters aÈd represent the orthogonal part of the model. No corrections for apparent places or refraction were applied, which is justiÐed owing to the small Ðeld of view and the preliminary nature of these reductions. Corrections of the x, y data were applied for e†ects of pixel fraction, amplitudes close to saturation, CTE and optical Ðeld distortions, in this order, prior to the least-squares adjustment to the reference stars. For the standard astrometric reduction, only reference stars Ñagged as suitable in the Hipparcos and Tycho Catalogues were used, thus excluding all known and suspected double stars. Images with an amplitude above 14,500 counts were rejected. If the standard reduction failed, an
2138
ZACHARIAS ET AL.
Vol. 120
alternate solution was attempted, allowing all available reference stars and excluding images only if their amplitude is above 25,000 counts. 4.4.6. Stochastic Model
A standard least-squares reduction was performed for each individual CCD frame. Weights were derived including the formal errors of individual reference star positions at the epoch of the CCD observation, the formal errors of the x, y image position Ðts, and a contribution from the atmospheric turbulence, p , atm p \ 200 mas t~1@2 , atm with t being the exposure time of the frame in seconds. For the alternate solution, an additional formal, standard error of 60 mas was added (rms) for images with an amplitude above 14,500 counts. If the reduction sigma exceeded 1.5 times the unit weight p, the observation equation with the largest residual was rejected, and the reduction was repeated. Observation equations with residuals exceeding 3 p were excluded as well. 5.
FIG. 4.ÈResiduals vs. pixel fraction (phase) of image proÐle center coordinates. Each point represents the mean of 2000 residuals. The full set of over 79,000 CCD frames were used in a test reduction.
FIG. 5.ÈOptical Ðeld angle distortion pattern. The scale of the residual vectors is 5000, and the largest vector is about 20 mas long.
POSITIONS
5.1. Reduction Results The successful astrometric reduction of the 79,686 CCD frames produced residuals for 2.35 million reference star images and 136 million individual positions with their formal errors. The average standard error of unit weight of a CCD frame reduction as described above is 50 and 54 mas for the long and short exposures, respectively. The average number of reference stars used per frame is 17 and 23 for the long and short exposures, respectively, while the largest number is 101 and 137, respectively. Analyzing the 6 adjustment parameters computed for each frame gives the following. The assumed, average scale of 0A. 905 pixel~1 is conÐrmed to within 0.05%. The mean rotation term between the x, y measures and the tangential coordinates is 0¡.013. The average standard error on a zeropoint coordinate of a single CCD frame as a whole with respect to the reference frame is p \ 18.0 mas, p \ 17.6 mas for the short exposures and p0x \ 23.4 mas, p0y \ 22.1 0x nonorthogonal, 0y linear mas for the long exposures. The terms in the reduction model (di†erence of scale along x and y and the nonorthogonality of axes) are only weakly signiÐcant. The scatter, obtained from the distribution of those parameters is only about a factor of 4 larger than the mean formal errors obtained from the individual parameter estimation. 5.2. Analysis of the Residuals Residuals (with respect to reference stars) of test reductions were analyzed to derive corrections for the x, y data and to decide on the functional model (see ° 4.4.5). Here we present an analysis of the Ðnal astrometric solution for the UCAC1. For all Ðgures to follow, a large binning number was used to average out random errors and highlight the small systematic errors present in our data. Figure 6 shows the residuals for the x- and y-coordinates as a function of magnitude. Systematic errors are small (10 mas) but signiÐcant. For this preliminary catalog, no corrections for this magnitude equation were applied (see ° 9.2). Figure 7 shows the result for a possible coma-term. The residuals are plotted versus the product of magnitude and coordinate. Magnitude and coordinate are measured with
No. 4, 2000
FIRST USNO CCD ASTROGRAPH CATALOG
FIG. 6.ÈResiduals of the Ðnal UCAC1 reduction as a function of magnitude. Each point shows the mean of 2000 residuals.
respect to the center of the distribution. Again, systematic errors are mostly 10 mas or below. Figure 8 shows the radial and tangential residuals as a function of the distance from the frame center. A remaining, small third-order optical distortion term is visible in the radial component, leaving an uncorrected systematic error of typically 5 mas in these preliminary reductions. 5.3. Mean Positions Individual positions were matched adopting a 1A. 0 tolerance per coordinate to identify images belonging to the same star. Weighted mean positions were derived from the individual positions. Error estimates for the weighting include the image proÐle Ðt precision, the contribution from the error propagation from the m, g-coordinates due to the reduction model, and a global component as a function of exposure time for the atmospheric turbulence (see ° 4.4.6). All these errors are formal, standard errors. Overexposed stars and other problem cases sometimes cause multiple entries for the same star to appear in the initial mean position catalog. In cases of multiple entries within 3A. 0 per coordinate, all entries were rejected, and no mean position is given in the catalog presented here. Most binary stars with blended components were already excluded on individual frames owing to unsuccessful image proÐle Ðts. The presented catalog contains only stars with at least 2 images and formal, mean position errors not exceeding 200 mas in either coordinate. Positional errors given in the
2139
FIG. 7.ÈComa terms : residuals of the Ðnal UCAC1 reduction as a function of the product of magnitude and linear coordinate. Each point shows the mean of 2000 residuals.
catalog are derived from the scatter of the weighted individual images. Most star positions are based on only a few (often two) images ; see Figure 13 below. Thus the derived errors for individual stars are not reliable. The distribution of the internal position errors is shown in Figure 9 (top). The average internal position error for all UCAC1 stars is 31 mas per coordinate. Note that positions for Hipparcos and Tycho stars in UCAC1 are based on the astrograph observations. Those positions are certainly correlated with the reference catalog positions ; however, neither Tycho-2 nor Hipparcos positions were copied into the UCAC1. The position part of UCAC1 is strictly an observational catalog. 6.
PROPER MOTIONS
The proper motions in the UCAC1 were derived by combining the UCAC1 positions with those from other catalogs. In general, the proper motions come in 2 groups, primarily based on observing histories. The Ðrst group contains about 25 million stars that are generally faint (B12.5 mag and fainter). These have proper motions from a combination with only the USNO A2.0 catalog (Monet 1998). Observing histories of these stars are generally poor ; that is, there are few if any astrometric quality observations other than what is found in the A2.0. The second group is the brighter 2 million stars whose proper motions were computed by combining the UCAC1 positions with those from earlier transit circle and photographic programs other than
2140
ZACHARIAS ET AL.
FIG. 8.ÈRadial (top) and tangential (bottom) residuals of the Ðnal UCAC1 reduction as a function of distance from the CCD frame center (radius). Each point shows the mean of 2000 residuals.
the USNO A2.0. Observing histories of these stars are generally good, often spanning a century or more, including new reductions of the Astrographic Catalogue (AC) (Urban et al. 2000). 6.1. IdentiÐcation of Stars in Other Catalogs In order to produce proper motions, the UCAC stars had to be found in older catalogs. The USNO A2.0, Tycho-2, and AC 2000 catalogs were used. In each case, a positional search was utilized. Once the cross-reference to the Tycho-2 was established, it also provided access to most of the other B140 ground-based catalogs utilized for the proper-motion determinations. For the USNO A2.0, a catalog without proper motions, an area with a radius of 12A around each UCAC star was searched for a corresponding entry. In order to avoid accidental matches with stars too faint to be in UCAC1, a subset of the A2.0 catalog was created with a limiting red magnitude of 16.5. If only one corresponding entry was found, it was deemed a match. If more than one A2.0 entry was found, a ratio of the distances between the UCAC and the two closest A2.0 positions was computed. If this ratio was at or below 0.5, meaning one star was twice as close as the other, then the closest one was considered a match. Those systems failing this ratio test have been excluded from the catalog at this time. Additionally, stars in the new Tycho-2 Catalogue (HÔg et al. 2000a) were matched with the UCAC. Since proper motions are available, the Tycho-2 stars were moved to the
Vol. 120
FIG. 9.ÈDistribution of internal standard error of position (top) and proper motion (bottom) of UCAC1 stars. Results for the declination coordinate are shown here ; for right ascension, the plots look similar. The bimodal distribution of the proper-motion errors is caused by the observing history.
UCAC epochs, and the search area surrounding each UCAC star was reduced to 3A. Once a Tycho-2 match was found, then a cross-identiÐcation between 144 other catalogs could easily be made utilizing the work USNO performed in producing the Tycho-2 proper motions. Stars that are not in Tycho-2 but are found in the AC 2000 version 2 (Urban et al. 2000) were also investigated. Again, no proper motions exist, so the search radius was increased to 24A to allow for the large epoch di†erence between the catalogs. Ratio tests were utilized, if needed, for both the Tycho-2 and AC 2000 matching. 6.2. Computation of Proper Motions and T heir Standard Errors The technique employed for computing the proper motions of the UCAC1 is identical to that used for the Tycho-2 motions and is based on the method used for the construction of the AGK3R proper motions (Corbin 1973). First a conversion from equatorial coordinates (a, d) to directional unit vectors (x, y, z) is made. A weighted mean epoch for each unit vector is computed for each star (x6 , y6 , z6 ), as is the time derivative of each (x5 , y5 , z5 ). The proper motion in right ascension and declination can be computed as (y5 x6 [ x5 y6 ) k \ a (1 [ z6 2)
No. 4, 2000
FIRST USNO CCD ASTROGRAPH CATALOG z5 k \ . d J(1 [ z6 2)
For a detailed description of this method, including putting all catalogs used on the system deÐned by Hipparcos, see HÔg et al. (2000b). Two techniques were initially used to determine the standard errors associated with each proper motion : the scatter method based on how well the individual catalog positions match the computed proper motion, and the model method based on a priori estimates of positional accuracies. Details can be found elsewhere (HÔg et al. 2000b). The estimated errors of the UCAC1 positions, needed for proper weighting and model method proper-motion error estimates, were taken directly from the catalog unless the values were below 15 mas. In these cases, 15 mas was used. A value of 200 mas was used for all A2.0 catalog positions. In actuality, the true A2.0 accuracies probably di†er signiÐcantly from this value and are likely dependent on many factors. In the cases where proper motions are computed from only 2 catalog positions, only the model method technique is valid, and, therefore, its resulting values are what is published in the UCAC1. In cases in which three or more catalog positions are used, both methods were employed, and in each case the larger value is published for the error of the proper motion. The UCAC stars that were found in Tycho-2 are, in general, stars with the lowest standard errors in proper motion, typically 1È3 mas yr~1. The proper motions were computed using the UCAC positions, Tycho-2 positions, Hipparcos positions, and all 143 ground-based catalogs that make up the Tycho-2 proper motions. Those stars found only in the AC 2000 (Urban et al. 2000) have standard errors of proper motions generally in the 3È5 mas yr~1 range. Although the positional accuracies of the AC 2000 are not much di†erent than those of the A2.0, the large epoch span between the AC 2000 and the UCAC increases the proper-motion accuracy. Positional estimates of the AC 2000 observations are a function of AC zone and magnitude ; see also (Eichhorn 1974). Those stars found only in the A2.0 have the highest standard errors of proper motion, mostly owing to the small epoch span between the UCAC observations and those of the Schmidt surveys making up the A2.0. These errors are typically in the 9È15 mas yr~1 range and can be as large as 35 mas yr~1. The errors in the proper motions for these stars vary signiÐcantly from plate to plate depending on their epoch. The bimodal distribution of the formal errors of the proper motions is shown in Figure 9 (bottom). The distribution is bimodal for 2 reasons. First, the proper motions for the bright and faint stars were calculated from very di†erent Ðrst-epoch data as discussed above. Second, the Ðrst epoch used in the A2.0 catalog itself varies signiÐcantly. The positions for the A2.0 catalog were determined from the means of the measures of the red and blue plates from the POSS-I, SERC-J, and ESO-R Schmidt Camera surveys (van Altena 2000). The red and blue plates from the Northern Hemisphere POSS-I survey were taken between 1950 and 1958, whereas the Southern Hemisphere blue plates from SERC-J were taken between 1974 and 1989 and the southern red plates from ESO-R were taken between 1984 and 1995. Most of the proper motions of the fainter stars from the
2141
UCAC1 were determined using the A2.0 SERC-J/ESO-R positions, with a mean epoch di†erence of only 17 yr resulting in the large distribution around 11 mas yr~1. Part of the northernmost section of the UCAC1 used POSS-I positions, resulting in some of the fainter stars having proper motions errors around 4È 5 mas yr~1. All stars with high proper motions (º200 mas yr~1) have been excluded from this preliminary catalog if they are based on only 2 catalog positions. Most of these candidates have been found to be wrong matches between the astrograph observations and the A2.0 catalog. High propermotion stars involving more than two catalogs, thus mainly Tycho-2 and AC stars, are included in UCAC1. 7.
PHOTOMETRY
An internal magnitude is derived solely from the Ðt amplitude. For each individual frame the zero point of the instrumental magnitudes and the slope with respect to B[V color are adjusted with Tycho-1 photometry. To Ðrst approximation, the UCAC magnitudes, R , are related to U the UBV R system by R B V [ 0.35(B [ V ) B V [ 0.5(V [ R) . U As expected, the R magnitudes are between V and R. U A comparison with open cluster photometry revealed a systematic o†set in the instrumental magnitudes at the bright and faint end, caused by the inadequacy of the Gaussian image proÐle model. Empirical corrections were applied for the magnitudes given in the catalog. Magnitudes in UCAC1 are expected to be good to ^0.3 mag. At bright magnitudes, near saturation, as well as for faint stars near the detection limit, the errors can be signiÐcantly larger. The relative photometric error over small areas and a medium-magnitude range will be signiÐcantly smaller than 0.3 mag in most cases. UCAC1 is not a photometric catalog ; magnitudes are only provided as auxiliary data. Improvements are planned for future releases. 8.
EXTERNAL ASTROMETRIC COMPARISONS
The Yale Southern Proper Motion (SPM) data3 (Platais et al. 1998) is the only external, independent source of star positions comparable to the high accuracy of the UCAC1 in the area of the sky covered. The version 2.0 of the SPM is used here. It contains positions and proper motions for about 300,000 stars in the declination zone [48¡ ¹ d ¹ [22¡ covering the large magnitude range of 6È18 mag. The SPM proper motions are more uniform, reliable, and consistent than the preliminary UCAC1 proper motions, particularly for the fainter stars. Thus the SPM proper motions were used to bridge the di†erence of about 8 yr between the UCAC1 and SPM epochs. Figure 10 shows the position di†erences at the UCAC1 epoch as a function of SPM yellow (V ) magnitude. A nonlinear magnitude equation is visible for both coordinates with an amplitude of about 10 mas. Figure 11 displays the (SPM[UCAC1) position di†erences versus declination for the right ascension range of 10hÈ14h. Clearly a pattern matching the distance between SPM plate centers (5¡) is visible with an amplitude of about 20È40 mas. ÈÈÈÈÈÈÈÈÈÈÈÈÈÈÈ 3 http ://www.astro.yale.edu/spm/spm2cat/spm2.html.
2142
ZACHARIAS ET AL.
FIG. 10.ÈPosition di†erences (SPM[UCAC1) for all 186,000 stars in common, plotted vs. V magnitude. Each point is the mean of 500 residuals.
The di†erence in (SPM[UCAC1) proper motions is shown in Figure 12. For the brighter stars (V ¹ 12.5 mag) only small systematic di†erences (B0.5È1 mas yr~1) are found. Here the UCAC1 proper motions are based on Tycho-2 and AC stars. For the fainter stars, the A2.0 catalog was used for the UCAC1 proper motions, clearly showing a systematic error of about 5 mas yr~1 in both coordinates. If all this error is attributed to a magnitude equation in the Schmidt plate data used for the A2.0, an average systematic error of 50È100 mas results at the epoch of the Schmidt plates, which is plausible. A comparison of UCAC1 with Tycho-2 was made. A magnitude equation of ^10 mas over the range of 7.5 mag ¹ V ¹ 12.5 mag is found for both coordinates. Depending on magnitude, the externally observed errors are only 10%È50% larger than the sum of the formal errors of the UCAC1, Tycho-2 positions, and proper motions. The UCAC1 positions are more precise than those of the Tycho-2 catalog for the faint end (V º 10.5 mag), which contains the majority of Tycho-2 stars (in the area of the sky currently covered by UCAC data). Details are presented elsewhere (Zacharias et al. 2000). 9.
DISCUSSION
9.1. Mapping The observed standard error of unit weight of the CCD frame reductions (x, y with respect to reference stars) is consistent with the expected sum of errors from the image
Vol. 120
FIG. 11.ÈPosition di†erences (SPM[UCAC1) for 40,399 stars in the area of 10hÈ14h R.A. plotted vs. declination. Each point is the mean of 200 residuals.
proÐle Ðts, the reference star position uncertainties, and a component from the turbulence in the atmosphere, which is particularly signiÐcant for the short exposures. The good seeing at CTIO is very important in keeping that error small. The relatively large positional zero-point error of a CCD frame with respect to the reference frame suggests that a block adjustment of the data will be very beneÐcial, as will be the use of more reference stars, i.e., the Tycho-2 catalog. The only weakly signiÐcant, nonorthogonal linear terms in the mapping model suggest that a reduction with only 4 orthogonal terms could be tried after modeling e†ects from apparent places and refraction. If this turns out to be feasible, it would strengthen a block adjustment signiÐcantly. However, all other x, y data related systematic errors, in particular the magnitude-dependent errors would need to be solved on the level expected for the external accuracy of a future UCAC catalog. 9.2. Magnitude Equation Magnitude-dependent, systematic errors are the biggest problem with the UCAC1 astrometry. These are likely caused by residual e†ects of the relatively low CTE as well as the nonlinearity of the detector particularly near saturation. The largest remaining e†ect seen in the residuals is in the x-axis coma term (Fig. 7), which has an asymmetric tail at negative values up to almost 20 mas. The almost linear magnitude equation found in the UCAC1 residuals (mainly Tycho-1 stars, with ACT proper motions) does not continue
No. 4, 2000
FIRST USNO CCD ASTROGRAPH CATALOG
2143
position is very small and is believed to be corrected to within about 3 mas even in this preliminary catalog. 9.4. Proper Motions For the high-precision, bright stars (V ¹ 12.5 mag), a small but signiÐcant average di†erence of about 0.5 mas yr~1 is found between the UCAC1 and SPM 2.0 proper motions in declination, which needs to be investigated further. In addition the proper-motion di†erences for both coordinates slightly depend on magnitude (several 0.1 mas yr~1). This might not be signiÐcant because here we reach the limit of the external accuracies of both the SPM and UCAC1 data. The large di†erences found in the proper motions between UCAC1 and the SPM at fainter magnitudes could be traced back to a systematic position o†set in the A2.0 catalog. The southern Schmidt plates are a†ected, likely by magnitude equations. Here we only see the average e†ect over many plates in the common area. The magnitude equation of individual plates can be much larger and might even vary over the area of one Schmidt plate. This remains to be solved before systematically correct proper motions can be derived from Schmidt plate surveys. The given errors for proper motions of the faint stars are based on assumed mean errors of the USNO A2.0 positions of 200 mas per coordinate at its mean epoch. The true errors can vary signiÐcantly from this number, resulting in signiÐcantly smaller or larger formal errors for the proper motions than given in the UCAC1.
FIG. 12.ÈDi†erences in proper motions (SPM-UCAC1).
toward fainter magnitudes, as is indicated by the external comparison with the SPM data. Also, there were signiÐcant changes in the magnitude equation corrections between the AC star positions used in our reference star catalog versus the new reductions (Urban et al. 2000) made for the Tycho-2 project. This suggests that at least a signiÐcant part of the magnitude equation seen in our current UCAC1 reductions might be introduced by systematic errors in the ACT proper motions. On these grounds it was decided not to apply any pure magnitude terms to the UCAC1 x, y data for this preliminary catalog. 9.3. Subpixel E†ect The wave pattern in the residuals versus pixel fraction plot is caused by using an inappropriate Ðtting model (Winter 1996). The nonzero phase in the y-coordinate of this pattern can also be explained by the CCD architecture. Even the amplitude of 12 mas in this case was predicted by simulations (Winter 1996). This problem can be avoided entirely by using an empirical model, based on the pointspread function (PSF) of the entire detector system for the image proÐle Ðts (Winter 1999). A thorough analysis of PSF e†ects on astrometry with respect to undersampling, particular Hubble Space T elescope images, has recently been published (Anderson & King 2000). Software for PSF Ðtting was included in 1997 ; however, the entire reduction pipeline could not be updated in time for the routine analysis. A rereduction of all raw data is planned after all other planned reduction reÐnements are in place. The e†ect of the subpixel
9.5. Miscellaneous A comparison of UCAC1 with internal, preliminary4 2MASS (Skrutskie et al. 2000 ; Cutri et al. 2000) results conÐrmed the estimated formal errors of 2MASS positions to be on the 100È150 mas level. However, this is not a crucial test for most of the UCAC1 positions. A large fraction of UCAC1 stars could be matched uniquely with 2MASS ; thus, after completion of both projects, the merged data will prove to be of enormous importance, giving highly accurate astrometry and IR photometry. At the northern limit of this preliminary catalog, the overlap of Ðelds is only onefold, resulting in only 1 long and 1 short exposure for those areas. Because of the requirement to have at least two images per star to enter this catalog, all frames at the northern boundary only contribute stars to about magnitude 14.5, the limit of the short exposures. This explains the indent in the distribution of UCAC1 stars over magnitude as shown in Figure 13 below. 10.
THE CATALOG
10.1. General Properties A CD-ROM is available from the US Naval Observatory, containing the UCAC1. Please read the ““ readme.txt ÏÏ Ðle carefully, as it contains important information for the user, all of which cannot be repeated here. The major properties are summarized in Table 6. Positions and proper motions are presented for 27,425, 433 stars together with errors and approximate red magnitudes. The positions are on the ICRS, consistent with the J2000 system, and are given for the mean epoch of individÈÈÈÈÈÈÈÈÈÈÈÈÈÈÈ 4 http ://www.ipac.caltech.edu/2mass/releases/second/doc.explsup.html
2144
ZACHARIAS ET AL.
Vol. 120
TABLE 6 UCAC1 : FIRST PRELIMINARY CATALOG Property
Value/Explanation
Overlap pattern Ðelds . . . . . . . . Exposures per Ðeld . . . . . . . . . . . Exposure times . . . . . . . . . . . . . . . . Coverage . . . . . . . . . . . . . . . . . . . . . . . Epoch of observations . . . . . . . . Average density . . . . . . . . . . . . . . . Total . . . . . . . . . . . . . . . . . . . . . . . . . . . . Catalog precision . . . . . . . . . . . . .
Twofold center in corner One short, one long 20È150 s, guided d ¹ [21¡ to [ 6¡ \ f (a) 1998 FebÈ1999 Nov 1700 stars per square degree 27 million stars 20 mas, R \ 10È14 mag 70 mas, R \ 16 mag B1È 5 mas yr~1, AC, Tycho-2 B10È15 mas yr~1, USNO A2.0 79,686 ; successful solution 1.4TB compressed FITS 700 exabyte tapes 2300 CD-ROMs 6 GB compressed 1.8 GB ASCII
Error proper motions . . . . . . . . Number of CCD frames . . . . . . Raw data so far . . . . . . . . . . . . . . . Backup on . . . . . . . . . . . . . . . . . . . . . Detection output . . . . . . . . . . . . . . Astrometric catalog . . . . . . . . . . .
ual stars, as observed with the astrograph. This mean epoch is close to 1998.5 for the area around the South Pole and increase to about 1999.5 at the northern limit. The proper motions given are meant as an attachment for updating the UCAC1 positions to a recent epoch. The mean epoch of the combination of astrograph observations plus other catalogs used to obtain the proper motions is not given. The catalog is about 85% complete for the sky area it covers and within its range of magnitudes (B8È16 mag). A distribution of the UCAC1 entries by magnitude and number of images per star is shown in Figure 13. The internal standard errors of UCAC1 positions are plotted as a function of magnitude in Figure 14.
FIG. 13.ÈDistribution of magnitudes of UCAC1 stars (top) and number of images per star used for the UCAC1 catalog position (bottom).
10.2. Data Format The data are organized in declination zones of 0¡.5 width starting at the south celestial pole. Stars along a zone are sorted by right ascension. All 169 individual zone Ðles are archived in a compressed 574 Mbyte Ðle that needs to be unpacked by the user. After this step, plain ASCII Ðles are obtained that automatically adhere to the end of line convention used on a particular computer. The uncompressed data are 1.8 Gbyte total, while the largest individual zone Ðle is 19 Mbyte in size. Included on the CD-ROM are table-of-contentsÈtype summary and index Ðles as well as some utility software (Fortran 77) as an example of efficient access to the data. The software is not required to utilize the UCAC1 data. An example of the main catalog data is given in Table 7, while explanations of the contents and format are given in Table 8. All data are integer with at least one blank separating columns. There are no blank entries. The always positive south pole distance (SPD) is given. Declination is
FIG. 14.ÈFormal standard error of UCAC1 catalog positions as a function of magnitude.
TABLE 7 EXAMPLE OF THE MAIN UCAC1 DATA FILES RA
SPD
mag
sx
sy
no
ep
pmx
pmy
spx
spy
nc
1236845 4085292 5017477 7335326
1232368 292994 1421948 1552433
1591 1382 1577 1579
27 17 3 43
90 23 39 26
2 8 2 4
1566 1537 1570 1530
-117 -39 -629 477
-30 -15 174 270
118 117 117 119
128 118 119 118
2 2 2 2
No. 4, 2000
FIRST USNO CCD ASTROGRAPH CATALOG
2145
TABLE 8 EXPLANATION OF THE COLUMNS IN THE MAIN UCAC1 DATA FILES col
format
item
unit
1È10 11È20 21È25 26È29 30È33 34È36 37È41 42È48 49È55 56È59 60È63 64È66
I10 I10 I5 I4 I4 I3 I5 I7 I7 I4 I4 I3
RA SPD mag sx sy no ep pmx pmy spx spy nc
mas mas 1/100 mag mas mas 1/1000 yr 1/10 mas/yr 1/10 mas/yr 1/10 mas/yr 1/10 mas/yr
range of values 1154 57965 570 1 1 2 1121 -18759 -57756 6 5 2
obtained by subtracting 90¡ or 324,000,000 mas from the SPD value. 10.3. Galaxies A study was undertaken to see if some of the UCAC1 stars are actually galaxies. The UCAC1 reductions rely on Ðtting a spherical symmetric Gaussian proÐle to each object identiÐed ; thus compact, not strongly elongated galaxies are likely to show up in the catalog. Most catalogs of galaxies (at visual wavelengths) give positions that are not accurate enough to match automati-
FIG. 15.ÈDistribution of all SPM 2.0 galaxies (top) and those matched in UCAC1 (middle) as a function of V magnitude. The histogram at the bottom shows the distribution of the magnitude di†erences for the matched galaxies.
1295999821 304195851 1715 200 200 37 2852 65382 9936 347 310 26
explanation R.A. ICRS, epoch of observ. south pole distance, ... approximate magnitude (610 nm) std.error position, RA*cosDC std.error position, declination number of observations per star mean epoch - 1997 (astrogr.obs.) proper motion, RA*cosDC proper motion, declination std.error PM, RA*cosDC std.error PM, declination number of catalogs for PM
cally with UCAC1. One exception is the Yale SPM program (Platais et al. 1998 ; van Altena et al. 1999). In the SPM 2.0 catalog there are 34,716 galaxies and quasars with positions accurate to much better than 1A. The UCAC1 contains close to 10 million positions in the zone ([48¡ ¹ d ¹ [22¡) that overlaps the SPM 2.0 area. A total of 1142 unique matches were found between the SPM2 galaxies and the UCAC1, using a tolerance of 1A. 0. Figure 15 shows the histogram of all SPM galaxies and those matched with UCAC1 as a function of V magnitude (from SPM). Also given is the distribution of the magnitude di†erences for the matched galaxies. These preliminary
FIG. 16.ÈDistribution of proper motions and their errors of SPM galaxies found in UCAC1.
2146
ZACHARIAS ET AL.
results conÐrm that only a small number of galaxies (B10%) within the theoretically accessible magnitude range actually are present in UCAC1. Those galaxies are very likely compact and not strongly elongated. No Ñag for star/ galaxy separation is provided with this preliminary catalog. Figure 16 shows the distribution of UCAC1 proper motions and errors of the SPM galaxies found. The mean proper motion is around zero ; however, the observed scatter is larger than can be explained by the formal errors. Assuming the real proper motions of the galaxies to be zero means that the external errors for these fuzzy sources are signiÐcantly larger than the formal errors, which are derived from stellar images. 11.
CONCLUSIONS
The UCAC project provides a unique combination of a high-accuracy (B20 mas for 10È14 mag and 70 mas at 16 mag) and large-density (B2000 stars per square degree) star catalog. UCAC provides enough reference stars that narrow-Ðeld CCD images now can be directly linked to the International Celestial Reference System to high accuracy. Even the recently published Tycho-2 catalog has signiÐcantly inferior positional precision for stars of about magnitude 11 or fainter for areas covered in this UCAC1 release, mainly south of [15¡ declination. However, the systematic errors in Tycho-2 are likely to be smaller than in UCAC1. Figure 17 shows the location of catalogs commonly used for astrometry in positional accuracy versus density (stars per square degree) space ; UCAC Ðlls a gap in the lower right. Because proper motions are provided for all stars in UCAC1, positions can be updated to any current epoch application. Improved proper motions for the faint stars (not in Tycho-2) will soon become available utilizing the Southern and Northern Proper Motion (SPM and NPM) survey data, after which galactic kinematic studies with
FIG. 17.ÈLocation of catalogs for astrometry in the positional accuracy vs. density space. For the Tycho 2 and UCAC1 catalogs, the distribution as a function of magnitude is indicated.
Vol. 120
UCAC will become more meaningful. New scanning of all NPM plates has been completed by the USNO Precision Measuring Machine (PMM) in Flagsta†, and all applicable SPM plates will be scanned before the end of 2000. Proper motions for faint UCAC stars will then become independent of the Schmidt plate data, allowing a rigorous investigation of systematic errors of the Schmidt surveys. Deriving highly accurate positions of 17thÈ20th magnitude stars will then become possible, utilizing the existing Schmidt plate scans. The full potential of UCAC will not be developed until 2003, when it becomes an all-sky catalog and a complete new reduction of all data will have been performed. The new reductions will even further reduce the systematic errors and will aim at completeness to a certain magnitude, solving most of the ““ problem cases ÏÏ that have been omitted for this release. Combined with photometry obtained from other projects, like 2MASS, a valuable database for galactic studies will be produced. The UCAC also will provide the input catalog needed for the FAME (Johnston et al. 1999) space mission. Special thanks go to our astrograph observers, in particular D. Castillo and M. Martinez, who vigorously acquire data for this project night after night. We are grateful to the CTIO sta†, in particular O. Saa and the director M. Smith, as well as K. Seidelman (USNO) for negotiating the MOU. CTIO is operated by NOAO/AURA and supported by the National Science Foundation (NSF). Spectral Instruments, in particular G. Sims, are thanked for their outstanding support regarding our 4k CCD camera. A. Landoldt is thanked for providing photometry for selected stars in some of our calibration Ðelds. J. Hughes,5 Chr. de Vegt, and T. Corbin are thanked for their e†ort in getting a new lens for the astrograph as well as getting this project started and supported. The sta† of the USNO instrument shop, in particular G. Wieder, is thanked for their terriÐc job and F. Harris (USNO Flagsta†) is thanked for advice on CCD electronics. We would like to thank B. Gray from project Pluto for building a special feature into his Guide software which enabled us to avoid bright minor planets in the observing schedule. More information on the UCAC project and data release is available.6 A CD-ROM with the UCAC1 is available upon request.7
ÈÈÈÈÈÈÈÈÈÈÈÈÈÈÈ 5 Deceased. 6 http ://ad.usno.navy/mil/ucac 7 nz=pisces.usno.navy.mil.
REFERENCES Anderson, J., & King, I. R. 2000, PASP, in press AssaÐn, M., Zacharias, N., Andrei, A. H., & Martins, R. V. 2000, in IAU Colloq. 180, Towards Models and Constants for Sub-Microarcsecond Astrometry, ed. K. J. Johnston, D. D. McCarthy, B. J. Luzum, & G. H. Kaplan (Washington, DC : US Naval Obs.), 68 Corbin, T. E. 1977, Ph.D. thesis, Leander McCormick Obs., Univ. of Virginia Cutri, R. M., et al. 2000, Explanatory Supplement to the 2 MASS Second Incremental Data Release
de Vegt, C. 1979, in IAU Colloq. 48, Modern Astrometry, ed. F. V. Prochazka & R. H. Tucker (Vienna : Univ. Obs.), 527 Eichhorn, H. 1974, Astronomy of Star Positions (New York : Fred. Ungar) ESA. 1997, The Hipparcos and Tycho Catalogues (ESA SP-1200) (Noordwijk : ESA) Gauss, F. S., Zacharias, N., Ra†erty, T. J., Germain, M. E., Holdenried, E. R., Pohlman, J. W., & Zacharias, M. I. 1996, BAAS, 28, 1282 HÔg, E., et al. 2000a, A&A, 355, L27 ÈÈÈ. 2000b, A&A, 357, 367
No. 4, 2000
FIRST USNO CCD ASTROGRAPH CATALOG
Holst, G. C. 1996, CCDs Arrays, Cameras and Displays (Bellingham : SPIE Optical Engineering Press) Johnston, K. J., et al. 1999, Full-Sky Astrometric Mapping Explorer, FAME Concept Study Report (Washington : US Naval Obs.) Lasker, B. M., Stuch, C. R., McLean, B. J., Russell, J. L., Jenkner, H., & Shara, M. 1990, AJ, 99, 2019 Ma, C., & Feissel, M., ed. 1997, DeÐnition and Realization of the International Celestial Reference System by VLBI Astrometry of Extragalactic Objects (IERS Tech. Note 23) (Paris : IERS) Ma, C., et al. 1998, AJ, 116, 516 Monet, D. G. 1998, BAAS, 30, 4, 1427 ÈÈÈ. 1999, USNO A2.0 (CD-ROM) Platais, I., et al. 1998, AJ, 116, 2556 Ra†erty, T. J. 1999, in Treasure-Hunting in Astronomical Plate Archives, ed. P. Kroll, C. La Dous, & T. Brauer (Frankfurt : Harri Deutsch) Schorr, R., & Kohlschutter, A. 1951, AGK2 Catalog Introduction, Hamburg (Hamburg : Hamburger Stern wante) Skrutskie, M. F., et al. 2000, in The Impact of Large Scale Near-IR Sky Surveys, ed. F. Garzon et al. (Dordrecht : Kluwer), 25 Stone, R., Pier, J. R., & Monet, D. G. 1999, AJ, 118, 2488 Urban, S. E. 1998, in The Message of the AnglesÈAstrometry from 1798 to 1998, International Spring Meeting of the Astronomiche Gesellschaft, ed. P. Brosche, W. R. Dick, O. Schwarz, & R. Wielen (Frankfurt : Harri Deutsch), 147 Urban, S., Corbin, T. E., & Wyco†, G. L. 1998, AJ, 115, 2161
2147
Urban, S. E., Corbin, T. E., Wyco†, G. L., HÔg, E., Fabricius, C., & Makarov, V. V. 2000, in preparation van Altena, W. F. 2000, in AllenÏs Astrophysical Quantities, ed. A. N. Cox (4th ed. ; New York : Springer), 683 van Altena, W. F., Girard, T. M., Platais, I., Kozhurina-Platais, V., Ostheimer, J., Lopez, C. E., & Mendez, R. A. 1999, BAAS, 31, 1229 Vukobratovich, D., Valente, T., Shannon, R. R., Hooker, R., & Summer, R. E. 1992, Proc. SPIE, 1752, 245 Winter, L. 1996, Technical memo, Hamburg Obs. ÈÈÈ. 1999, Ph.D. thesis, Univ. of Hamburg Zacharias, N. 1997, AJ, 113, 1925 ÈÈÈ. 1998, Highlights Astron., 11A, 300 Zacharias, N., Germain, M. E., & Ra†erty, T. J. 1997, in Hipparcos Venice 97, ed. B. Battrick (ESA SP-402) (Noordwijk : ESA), 177 Zacharias, N., Ra†erty, T. J., & Zacharias, M. I. 2000, in ASP Conf. Ser., Astronomical Data Analysis Software and Systems 1999 Meeting (San Francisco : ASP), in press Zacharias, N., & Zacharias, M. I. 1999a, AJ, 118, 2503 ÈÈÈ. 1999b, in ASP Conf. Ser. 172, Astronomical Data Analysis Software and Systems VIII, ed. D. M. Mehringer, R. L. Plante, & D. A. Roberts (San Francisco : ASP), 345 Zacharias, N., Zacharias, M. I., Hall, D. M., Johnston, K. J., de Vegt, C., & Winter, L. 1999, AJ, 118, 2511 Zacharias, N., Zacharias, M. I., Urban, S. E., & HÔg, E. 2000, AJ, 120, 1148