ON A NEURAL NETWORK THAT PERFORMS AN ENHANCED NEAREST-NEIGHBOR MATCHING
Gilles Labonté Department of Mathematics and Computer Science Royal Military College of Canada Kingston, Ontario, Canada,
This research was financed in part by a grant from the Academic Research Program of the Department of National Defense of Canada.
Requests for reprints should be sent to Gilles Labonté, Department of Mathematics and Computer Science, Royal Military College of Canada, Kingston, Ontario, Canada K7K 7B4. Email:
[email protected]
Running Title: A Neural Network for Point Image Matching
1
ON A NEURAL NETWORK THAT PERFORMS AN ENHANCED NEAREST-NEIGHBOR MATCHING
ABSTRACT We review some of the main methods of solution of the image matching problem in Particle-Tracking Velocimetry (PTV). This is a technique of Experimental Fluid Dynamics for determining the velocity fields of moving fluids. This problem is a two-dimensional random-points matching problem that constitutes a prototypal problem, analogous to the one-dimensional matching problem for Julesz [1] random-dot stereograms. Our study bears on a particular method of solution, namely the neural network algorithm proposed by Labonté [2,3]. Our interest in this neural network comes from the fact that it has been shown to out-perform the best matching methods in PTV, and the belief that it is actually a method applicable to many other instances of the correspondence problem. We obtain many new results concerning the nature of this algorithm. The main one of which consists in showing how this neural network functions as an enhancer for nearest-neighbor particle image matching. We calculate its complexity and produce two different types of learning curves for it. We exhibit the fact that the RMS error of the neural network decreases at least exponentially with the number of cycles of the neural network. The neural network constructs a self-organized map (SOM), which corresponds to distorting back the two photos until they merge into a single one. We explain how this distortion is driven, under
2
the network dynamics, by the few good nearest-neighbors (sometimes as few as 20%) that exist initially. These are able to pull with them the neighboring images, toward their matching partners. We report the results of measurements that corroborate our analysis of this process.
Keywords: Correspondence, Displacement field, Self-organized mapping, Nearest-Neighbor Algorithm, Particle-Tracking Velocimetry, Particle-Image Velocimetry.
3
1. Introduction
1.1 On the matching problem Day to day instances of matching range from very concrete ones, such as finding the unique piece of a jigsaw puzzle that will match a particular hole in the puzzle being laid out, finding a word pattern in a database that match a given query, finding in one's memory the prototype representation of a perceived object, finding a partner with whom to spend one's life,…to more abstract ones such as determining which reaction corresponds best to particular circumstances in life. In order to solve a matching problem by a mathematical algorithm, one must be able to represent it in mathematical terms. This is often very difficult to do and the quality of the matches depends on which features of the objects are represented by mathematical objects to be matched as well as which similarity measure is used to compute acceptable or optimal matches. Often, the cost of matches is measured with a distance function. When this is the case, the matching process is called a nearest-neighbor algorithm.
An important class of matching problems involves images. These are met in many branches of science as the following incomplete list of examples illustrates. Classification of the traces of high energy particles in bubble chambers (see Hough [4] ). Medical diagnostic (see Cootes et al. [5]). Stereo vision (see Mar [6]). Photogrammetry and remote sensing (see Heipke [7]). Analysis of motion and structure from different photographs of a scene (see
4
Huang and Netravali [8]). Particle Image Velocimetry, which is a method used to determine the velocity fields in moving fluids (see Adrian [9]) by matching the images of small particles suspended in the fluid, in two consecutive photographs.
However different these applications are, many solution techniques are applicable to most of them. Matching algorithms can be separated in two classes (see for example Heipke [7]), according to what features they match. In one class are those methods that match "microscopic" features. These can be simply discrete points as in Julesz [1] random-dot stereograms or in Particle-Tracking Velocimetry. They could also be arrays of the gray values of the pixels in patches of the images. In such cases one would talk about area based matching (ABM). In the other class are methods that match extracted "macroscopic" features of the images, such as edges, lines, corners, geometric objects together with some topological relations between them… In this case, one talks about feature based matching (FBM). The methods used for FBM require more insight into the nature of the problems than those used for ABM, in order to decide which features are meaningful to consider. A more elaborate preprocessing stage, in which the features are extracted from both images, is an intrinsic part of the FBM methods. On the other hand, ABM usually requires minimal preprocessing. For FBM, the "macroscopic" features are usually sparse so that exhaustive searches can be carried out. Among the methods used are relaxation labeling (Barnard and Thompson [10], simulated annealing (Barnard [11], and dynamic programming (Kölbl et al. [12]).
5
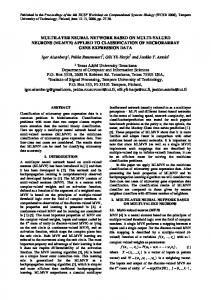
1.2 On the cross-correlation algorithm By far the most widely used image matching method for ABM is cross correlation (see, for example, Sharp et al. [13], Kreiling [14], Hannah [15]). According to it, a match is sought for a patch of the first image within some plausible larger patch or window in the second image. A copy of the first patch is used as a template that is shifted pixel by pixel across the latter patch (see Figure 1). At each position, a measure of the match between this template and the underlying part of the second image is calculated. This measure, called the cross correlation coefficient ρ, is defined as follows. Let i=1..M be an arbitrary numbering of the pixels in the template patch from the first image. The gray level value at these pixels (or the difference between this value and the average gray level of all pixels in the patch) can be considered as the components of a Mdimensional vector v1 . Let v i2 for i=1,…,K be the similarly defined vectors for the K potential matching patches in the second image. Let w1 denote the normalized vectors
v1 v
1
and w i2 denote the similarly defined normalized vectors with the v i2
for i=1,…,K. The cross correlation coefficient is then defined as ρi = w 1 ⋅ w i2 , its numerator being the scalar product of the two vectors. The best match is that at which ρi is maximum. Note that, in general, there can be more than one such position so that the match can be ambiguous.
6
The cross correlation algorithm is actually a nearest-neighbor algorithm. Indeed, the cross correlation coefficient ρi is simply the cosine of the angle between the two unit vectors w1 and w i2 . Therefore, ρi is maximum if and only if the distance || w1 - w i2 || is minimum, that is if the vector w i2 is the closest neighbor to the vector w1 in the set { w i2 :i=1,…,K} because w 1 − w i2
2
= 2 (1 − ρ i ) . The cross correlation algorithm is thus a nearest-
neighbor algorithm on the unit sphere in the M-dimensional vector space, where the components of the vectors are the normalized gray levels of the pixels in the image patches.
Other measures of similarity of the patches can be used instead of the cross-correlation coefficient, as for example, the sum of the absolute differences between corresponding pixels or the sum of the squares of these differences. These two algorithms are also nearest-neighbor algorithms that match the gray level vectors v themselves instead of the normalized vectors w used in cross correlation. The first one of these algorithm uses the distance function D(v1,v2) = M
∑v i =1
1 i
− v i2 while the second one uses the Euclidean distance.
1.3 PTV matching as prototypal problem Particle-Tracking Velocimetry serves mainly to analyze fluid motions that can be considered two-dimensional (an excellent description of it has been given by Adrian [9]). Identical small tracer particles are injected at random positions in
7
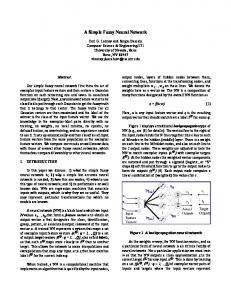
a moving fluid, which is illuminated by a thin sheet of light, parallel to its plane of motion. Two successive photographs are then taken of the same region of the fluid, at times t and t+∆t, from a direction at 900 to the light sheet. These two pictures look as shown in Figure 2. The crucial step, in this technique, is determining which images in these pictures represent the same particles. Once this is achieved, the distance ∆D between the images of matched pairs can be measured, and the average velocity of the particle they represent obtained as the ratio ∆D/∆t. If ∆t is taken small enough, the particle displacements will also be small, and a simple nearest-neighbor particle image matching between the two pictures will solve the correspondence problem. However, it is advantageous to have ∆t and ∆D as large as possible, for the error in the calculated velocity to be as small as possible. Whence the need for better algorithms than nearestneighbor particle matching. A further complication, that has to be dealt with in matching, is that some particle images appear in one picture and not in the other one. These correspond to particles that have either moved in or out of the light sheet during ∆t, due to some small velocity component normal to it. A help in matching is provided by the estimate of the maximum in-plane displacement Dmax. The latter is usually readily obtainable from the flow conditions.
PTV matching problem should be considered as having the same importance as matching the Julesz [1] random-dot stereograms in stereo vision analysis. Indeed, both provide a lower level possible instance or prototype, where the tokens to be matched are simply randomly distributed points. The
8
main difference between the two is that the matching problem of PTV is twodimensional while that of the Julesz stereogram is one-dimensional, due to the epipolar constraint.
1.4 Some algorithms of PTV The most important matching methods for PTV, which existed by 1991, are mentioned in the review article by Adrian [9]. Among the better known algorithms are the following ones.
Nearest neighbor particle image matching. The particle image in the second picture that matches a given one in the first picture is the one that is closest to it when the two images are superposed. Of course, this yields correct results only when most of the particle displacements are smaller than the average distance between the particles. Although it is usually experimentally feasible to reduce ∆t enough to satisfy this condition, it is not always desirable to do so because small displacements also lead to low accuracy of the calculated displacement field.
Global cross-correlation. Frieden and Zoltani [16] have proposed a method based on crosscorrelation of the two complete PTV photos. In a preprocessing stage the geometric center of particle images are found and disks of identical size are placed at these points. The global cross-correlation coefficient of the resulting
9
two modified pictures is then calculated. Its global maximum occurs at the lag at which the largest number of particle disks overlap. The corresponding particles are interpreted as having moved as a single clump and are matched. The next highest maximum is then considered and its lag is again interpreted as the displacement of the particles whose disks contribute to it by their overlap. These particles are also considered to have moved as a single clump and are matched. This process is continued until all appreciable maxima of the cross-correlation coefficient have been considered. A final nearest-neighbor image matching then takes care of those particle disks that remain unassigned. The authors point out that their algorithm improves on nearest neighbor particle image matching, but also that "For proper use, particle movements should not exceed interparticle distances in image1. Also, the particle motion should tend to be locally correlated in spatial clumps…"
Cross correlation enhanced nearest-neighbor matching The algorithms of Perkins and Hunt [17] and of Uemura, Yamamoto and Ohmi [18] are based on cross-correlation of groups of particles followed by single particle pairing. Guezennec and Kiritsis [19] have proposed a two step algorithm based on similar principles. In a first step, the average particle displacement in a patch of the first picture, is obtained by cross correlation. The particle images in this patch of the first photo are then displaced by the corresponding lag. The second step consists in performing a nearest-neighbor particle image matching between the particles in the patch and those in the underlying patch in the
10
second photo. This technique produces much better results than nearest neighbor particle matching by itself.
Autocorrelation For high-image density PIV (Particle Image Velocimetry), when there are from about 500 to some thousands of particle images in each photo, the method suggested by Adrian [9] is autocorrelation. With such large number of particle images, the interparticle distances are small and, for the sake of more precision, two pictures are recorded as a double exposure on the same photo. The autocorrelation process works just as cross correlation, except that the scanning patch is used to scan its own photo. In this case, the highest peak in the correlation function will occur at zero displacement, corresponding to the images correlating with themselves. There will be another high peak at the mean particle displacement, when the first images of the particles correlate with their second images. An identical peak will occur, with the same but negative displacement, when the second images correlate with the first ones. As Adrian remarks, the displacement correlation peaks become smaller and less likely to be detected among the noise peaks, as the lengths of the displacements increase and this method then becomes unreliable. In PIV experiments the particles that enter or leave the light-sheet between the two photos can contribute appreciably to the noise peaks.
Statistical techniques
11
PIV experiments can also be based on a multiple exposure photograph obtained by having the laser produce consecutive pulses of light within a small time interval. It is then obviously easier to follow the particles because the displacements between their consecutive images are small. Furthermore, the tracks made up of these images can be long enough to provide good precision in the displacement measurements. A limit to the precision of such methods however is imposed by the fact that longer tracks will have more intersections with others making the identification of their member images more difficult.
Among the efficient methods that have been developed to identify the particle tracks is the statistical technique of Grant and Liu [20], which they call the particle image grouping method. According to this method, the track to which an image belongs is obtained by analyzing the scatter diagram of the position vectors of its 3 or 5 nearest-neighbor images. The particle images with coordinates within one standard deviation of the mean of this peak are considered as belonging to the same track. Note that there is a 180 0 directional ambiguity in the direction of the velocities obtained this way. In order to resolve this ambiguity, Grant and Liu [21] have proposed another method that uses very close pairs of dissimilar laser pulses, so that images of different size are produced in doublets. This technique provides an approximate direction in which to search for the next doublet (the nearest-neighbor image pair) on the same track.
12
Some neural network methods Recently, Hassan and Philip [22] have proposed using a neural network to identify the particle tracks. They consider photos of four consecutive exposures of the tracer particles. The maximum possible length for a track being known, the partners on a same track of a given particle are sought within a disk of this radius of it. This is done by first calculating the Hough [4] transform i.e. the sets of pairs (m, b) where m is the slope and b the intercept of the line segment joining any two particle images within this disk with the origin at its center. Groups of four particle on a same track are then recognized by the corresponding points (m, b) being closely grouped together, i.e. as being almost aligned on a same straight line. Hassan and Philip have proposed to use a Carpenter and Grossberg [22] ART2 (Adaptive Resonance Theory) neural network to recognize these clusters. This technique was compared to crosscorrelation and found to be slightly better, yielding for example a recognition rate of 84% compared to 76% for the former method. The most important degradation factor for its efficiency is the noise i.e. the particle images that do not appear in all four exposures due to a velocity component perpendicular to the light sheet.
Knaak, Roghlübber and Orglmeister [24] have proposed using a Hopfield [25] neural network to match particle images in two PTV photos by finding the absolute minimum of an energy function, which is defined so as to implement physical constraints characteristic of fluid flows. Although the results they report
13
are much better than simple nearest-neighbor particle image matching, they are inferior to those obtained by the other methods described hereafter.
Grant and Pan [26] use a self-organizing neural network of the type developed by Kohonen [27,28] to match two PTV pictures. Its neurons are arranged on a square two-dimensional lattice, one for each pixel in a square window of side equal to 2Dmax + 1, where Dmax is the maximum number of pixels between matches. This neural network works as a filter, with which the second PTV photo is scanned. When it is placed on the second photo, with its center at the position of a particle image in the first photo, it lets through only the particle image of the second photo that matches the former particle image. This neural network needs to be initialized with correctly (otherwise) matched particle image pairs within a certain continuous region of the fluid. Starting with this "knowledge", it will then adapt to the changes in the fluid flow, as it is displaced over the second photo away from this initial region, and recognize the new matching particle images. After testing their algorithm, its authors indicate that it substantially outperforms the many other methods with which they have worked and which they have themselves previously developed (see Grant and Liu [20]).
1.5 Image matching as mapping determination In many applications other than PTV, there is a need to match two sets of point patterns when it is known that the second one of which is obtained from the first one by a similarity transformation (i.e. a combination of a translation, a
14
rotation and a dilatation). In such cases, the solution of the matching problem is obtained by determining the similarity transformation itself (see for ex. Casasent and Psaltis [29]). This point of view may be extended to all matching problems, which are then viewed as the equivalent problem of finding the mathematical function M that maps one image onto the other one. The properties of this function will of course vary with the type of application considered. In PTV, the tracer particles move according to a differential equation of motion incorporating the laws of fluid mechanics. Thus, although the global pattern of particle images in the second photo will be distorted with respect to that in the first photo, this distortion process corresponds to a continuous mathematical mapping. By definition, a continuous mapping performs a topography preserving transformations.
A whole field of neural network research exists that deals precisely with such transformations. It is concerned with neural networks that can self-organize so as to produce a topography preserving transformations. Because of this, they are called Self-Organizing Map (SOM) neural networks. The initial sources for these ideas can be found in von der Malsburg [30], Willshaw and von der Malsburg [31] and Kohonen [27,28]. The most commonly used SOM algorithm is presently that of Kohonen. It has been applied to very many different types of problems. Chapter 9 of Kohonen [28] provides an essentially complete overview of the documented SOM literature, up to 1997, including a survey of its applications. See also the survey of Kaski, Kangas and Kohonen [32], which
15
lists by domains some 3343 scientific papers pertaining to the Kohonen SOM. The SOM algorithm forms a nonlinear projection from a data manifold, which is often high dimensional, onto another one, which is often of lower dimension. This projection is produced by the neural network through a self-organizing process. When samples of the data are presented to it, this neural network undergoes a competitive learning process in which the weights of its neurons are modified is such a way that neighboring data points will end up producing a maximum excitation in neighboring neurons. This correspondence between data points and maximum excited neurons constitute the mapping from the vector space of the data set onto that of the neural network structure.
One striking application of the SOM is to the organization of large document files. A scheme called WEBSOM has been developed by Kohonen [28] to do this. It performs a mapping from a 270-dimensional vector space in which the vectors represent documents, onto a 2-dimensional rectangular area, which ends up looking much like a common geographic map. The latter map then serves as a browser for the document database.
The motivation for using SOM neural networks to realize image mapping comes from the consideration that if a SOM can learn to produce such complex mappings as described above, it should easily succeed in reproducing mappings such as the one defined above for PTV. After all, the latter mapping is from a
16
simple 2-dimensional rectangular area onto the same area, and it is furthermore rather close to the identity mapping because ∆t is relatively small.
A SOM for the PTV mapping Labonté [2,3] has devised such a SOM neural network for PTV. It is composed of two sub-networks, one associated with each photo. Their neurons are situated and have initial weight vectors at the position of the particle images in the corresponding photo. Under the network dynamics, the sets of weight vectors of the two sub-networks move toward each other and coalesce. Weight vectors associated with matching particle images merge. Those corresponding to unmatchable images stand alone. The displacements of the particles are then simply the differences between the positions of the neurons that have matching weight vectors in the two sub-networks. If M1 and M2 denote the respective mappings that bring the initial weight vectors (= the position vectors of the particles) of the two sub-networks to their final value, then M1(x1) = M2(x2) , where x1 is the position vector of a particle in the first picture and x2 that of the matching particle in the second picture. The mapping M that transforms x1 into x2 is then simply M 2−1M1 where M 2−1 is some generalized inverse of M2. This application of the SOM algorithm has the very elegant feature that the structure of the neural network is an exact replica of the structure of the image to match.
A straightforward variation of this neural network algorithm consists in keeping fixed to their initial value the weight vectors of one of the two sub-
17
networks and letting the weight vectors of the other sub-network evolve toward the former vectors. The neural network would thus construct directly the whole mapping M, instead of constructing it as a product of two operators. Tests reported in the present paper indicate that the performances of both variations of the algorithm are comparable, with that of the former algorithm being somewhat superior.
A SOM for the optical flow mapping This idea of using a SOM neural network to transform the features of one image into those of the other one has also been examined by Kothari and Bellando [33,34] within the framework of optical flow identification. They use a SOM neural network with a small number N of neurons (of the order of 25), arranged in a regular 2-dimensional square lattice. The tests these authors report concern two pictures in which certain edge objects have been either translated, rotated or dilated. Their network undergoes two learning episodes. In the first one, which lasts for about 1000 cycles, it is fed as input the coordinate vectors of the edge points (of which there are 300 or more) of the edge objects contained in the first picture. Through the usual Kohonen learning process, the neuron weights converge to some final values represented by w 1i , i=1,…,N. A second learning episode that requires about 500 learning cycles, then follows. The network is then fed as input the coordinate vectors of the edge points of the second picture. The weights then converge to the values w i2 , i=1,…,N. The authors interpret the vector ( w i2 - w 1i ) for i=1,…,N, as the local displacements of
18
the point at w 1i in the first picture, and thus the mapping M is such that w i2 = M w 1i .
Differences between these two algorithms We note that whereas the algorithm of Labonté [2,3] has been tested extensively on matching problems where the two images where distorted one with respect to the other, that of Kothari and Bellando [33,34] has only been tested on matching objects that have undergone similarity transformations. Such transformations have the property of preserving the shape of all objects. Thus, it remains to be demonstrated that the latter algorithm will be equally successful with more general transformations in which the proportions of objects are modified, as is the case in PTV matching problems.
The most important difference between the two algorithms is the structure of the neural networks they use. While that of Labonté's network perfectly incorporates the geometry of the matching problem, that of Kothari and Bellando's network is of a regular square lattice. Because of this, the latter network will have weight vectors which, after convergence, will not be on edges (see Kothari and Bellando [34]), and even can lie between objects. These weight vectors represent "ghost" points, that are not object points, and the algorithm produces displacements for them as if they were actual object points that had moved.
19
A remarkable advantage of Labonté's algorithm over that of Kothari and Bellando is that the former requires only about 12 cycles to converge while the latter requires about 1500 cycles, that is about 100 times more cycles.
2. Objectives
The efficiency of the SOM algorithm that solves the PTV matching problem has been unequivocally demonstrated by the results of many tests reported in Labonté [3]. The latter article establishes also its superiority over other matching methods in PTV through extensive comparison tests with the algorithm of Grant and Pan [26], which was until then possibly the best matching algorithm for PTV. For this reason, we though it worthwhile to endeavor to gain some understanding of the processes by which this algorithm achieves its success. Any new result we could obtain could prove useful for improving its performances and developing other similar methods.
The direction of approach of our analysis was dictated by the fact that the nearest-neighbor algorithm is an inherent sub-process of the competitive learning mechanism in all SOM neural networks. Indeed, when an input vector is presented to the neural network, the neuron that wins the competition is that which has its weight vector closest to this input vector. This is why in our study, we looked closely at nearest-neighbor processes.
20
In this work, aside from our main results, we accessorily obtained three new results. One is the time complexity of this neural network algorithm. Another one follows from our efficiency comparison tests with the variation of the algorithm, in which only one of the two sub-networks evolves, (that we mentioned in the introduction). The third one is the justification for incrementing the learning parameter instead of decrementing it after each cycle of the algorithm.
In our study, we have measured the convergence rate of the neural network by following its RMS error as the solution progresses, thus obtaining a set of learning curves for it. We have also calculated another set of learning curves. These are obtained by following, during the solution process, the rate of change of the number of good matches produced by nearest-neighbor matching of the weight vectors from the two sub-networks. We note that such learning curves and the convergence rate had not been calculated before.
We have made also various other measurements of processes that occur during the solution process. These allow us to propose an explanation of the yet unknown mechanisms by which the neural network produces its solution. We finally present the results of tests that corroborate our analysis of the algorithm.
3. A SOM neural network for matching
21
Consider a neural network made up of two sub-networks, each of which has many neurons arranged in some regular pattern in a plane. These neurons are interconnected in such a way as to allow Kohonen competitions to be held within each sub-network separately. Each one of these sub-networks serves as a retina that receives the image of one of the two PTV pictures. This causes its neurons that are situated at the position of particle images to be stimulated into action, so that they can participate in the process that will solve the correspondence problem. When only these active neurons are shown, the two sub-networks will look exactly as the two maps in Figure 2. From now on, only these active neurons will be considered.
Let x 1i with i=1,…,N and x i2 with i=1,...,M denote respectively the position vectors of the particle images in the first and the second picture. These are then also the position vectors of the active neurons in the first and the second subnetwork respectively. Each neuron is endowed with a two-dimensional weight vector, denoted w 1i for neuron-i in the first sub-network, and w i2 for neuron-i in the second sub-network. The neural network algorithm can be stated as follows. Note that all the distances are Euclidean distances.
Step 1) Initialize the neural network by setting the weight vectors of its neurons equal to their own position coordinate vector.
22
Step 2) Present successively all the weight vectors w 1i , i=1,…,N of the neurons in the first sub-network, as input to the second sub-network (the order of presentation does not matter in the present algorithm). For each input:
i) Find, in the second sub-network, the weight vector that is the nearestneighbor to w 1i . (If more than one weight vector are at the same closest distance to w 1i , then select anyone of them). Let c denote the index of the neuron that has this weight vector. If w c2 − w 1i ≤ Dmax then neuron c qualifies as a winner, else there is no winner.
ii) If there is a winner, award it, and all of its neighbors within a distance R, a weight vector increment. For neuron-j, this increment is denoted ∆w 2j ( w 1i ) , or more simply ∆w 2j , and is given by the following equation. ∆ w 2j = αjc ( w 1i - w 2c )
where
α αjc = î 0
if neuron - j ∈ D c (R) otherwise
(1)
α being a positive constant, and Dc(R), the closed disk of radius R centered on neuron-c.
Remark that this weight increment is different from that normally used in Kohonen networks which is proportional to ( w 1i - w 2j ). The weight increment in Eq.(1) corresponds to a translation, while the usual Kohonen increment corresponds to a translation and a contraction. Remark further
23
that, at this point, the weight vector increments are simply accumulated (they can be added to each other) by the neurons as they are received, they are not yet added to the weight vector itself.
Step 3) Repeat step 2) with the roles of the two sub-networks interchanged.
Step 4) Compute the new weights for all neurons as w 1j → w 1j +
M
∑ ∆w
1 j
(w i2 )
for the weights in the first sub-network
2 j
(w 1i )
for those in the second sub-network. (2)
i =1
w 2j → w 2j +
N
∑ ∆w i =1
Step 5) Decrease the neighborhood radius R and increase the translation amplitude coefficient α, so as to keep the product αR constant (this feature is discussed in Appendix A). R can be decreased exponentially or linearly with equally good results.
Step 6) Repeat Step 2) to Step 5) until the winner neighborhood contains only the winner itself. At this point, the weight vectors of the neurons associated with matching images, in the two sub-networks, will have moved within a distance ε of each other. Those that correspond to images without matching partners will be left alone. The solution of the correspondence problem is then read by doing a final nearest-neighbor weight vector matching, looking for matches within a distance of ε.
24
In all of the tests we have conducted, the neural network was run for a predefined number Nc of cycles, of either 12 or 24. The neighborhood radius R was decreased linearly, according to R → R - β with β =
Rf are the initial and final values of R. We used R0 =
R0 − Rf , where R0 and Nc - 1
2 or
2 /2, Rf=0.01, α0 =
the initial value of α = 0.005/R0, and the final vector identification distance ε = 0.03.
4. Time complexity
In this section, we obtain an expression for the running time of the algorithm, in terms of the number of particles present in the two pictures, taking into account the steps of the algorithm that can readily be run in parallel.
The initialization of the neural network in Step 1) can be performed in parallel. Each neuron is assigned its position and weight vector, independently of the others. This therefore requires a constant time, which we denote T1.
In Step 2), the second sub-network reacts to the presentation of each input vector w 1i for i = 1,…,N. For each presentation, the reaction time is constant and we denote it T2. Indeed, w 1i can be sent in parallel to all neurons in
25
the disk of radius Dmax about the point w 1i . Each of these neurons then calculates the distance between its own weight vector and w 1i . Finding the minimum of these distances can be done in constant time (see for ex. Feldman and Ballard [35]). The winner neuron being known, the weight increment of each neuron in its neighborhood Dc(R) can be distributed in parallel and immediately added to the total weight vector increment of each neuron. This operation then requires a constant time. Thus Step 2) requires NT2 units of time.
Step 3) is analogous to Step 2) and thus requires MT2 units of time, since there are M inputs presented to the first sub-network.
In Step 4), each neuron of the two sub-networks modifies its weight vector by adding to it the total weight vector increment it has accumulated in Steps 2) and 3). This requires a constant time interval of T3 units. Note that when the weights vector increments are accumulated and added only at the end, as is done her, the algorithm is said to do "batch learning". The similar algorithm in which the weigh vectors would be already changed in Steps 2) and 3) is said to do "sequential learning".
In Step 5), a fixed number of parameters are updated, thus requiring a constant time interval of T4 units.
26
A complete cycle of the algorithm thus requires T1 + (N+M)T2 + T3 + T4 units of time. With the selected values for the parameters, all instances of problems considered are solved after at most 24 cycles of the algorithm. The time required to solve any problem is then k0 + (N+M)k1 where the constants k0 and k1 are respectively 24(T1 + T3+T4) and 24T2. This algorithm is therefore linear in the total number of particle images present in the two pictures.
5. The test problems
For our tests, we have constructed data corresponding to some representative fluid flows, for which the velocity field is known theoretically. Only such artificial data can be used for analyzing performances because of the need to know in advance the correct matches. We have considered two flows for an inviscid, incompressible fluid; one is in a 900 corner and the other one in a vortex (see Chapter 4 of Warsi [36]). Our third flow is that of a viscous fluid between two infinite parallel plates, with local eddies at the plates, which are simulated by giving the velocity a small random component. For each flow, we solved correspondence problems with particle image concentrations of 100 to 200 per photo, each photo being squared and of unit side. We have considered five proportions of unmatchable images, namely 0, 10, 20, 30 and 40 percent per photo. For the flow in a corner, Dmax=0.1, for the vortex flow, Dmax= 0.15 and for the viscous flow in a channel, Dmax =0.075.
27
The matching scores produced by the neural network are shown in Table 1. This table also shows the scores produced by the nearest-neighbor particle matching algorithm in solving the same problems. Our point in comparing the scores of the two algorithms is not to demonstrate this way the superiority of the neural network algorithm. This was done in Labonté [3], where it was compared to much more efficient algorithms than simple nearest-neighbor particle matching. It is rather because our purpose in this paper is to present the neural network algorithm as an enhanced version of nearest-neighbor particle matching. Table 1 thus illustrates by how much the latter matching process is actually enhanced. It shows that, on the average, the neural network produces 3.5 times more correct matches than the straightforward (i.e. without enhancement) nearest-neighbor particle matching algorithm. The improvement in the quality of the matching may still be better appreciated by looking at Figures 3 to 5, which show the displacement fields identified by the neural network, side by side with those identified by the nearest-neighbor particle matching algorithm.
6. A variation of this algorithm
A straightforward variation of the above algorithm is obtained by simply omitting Step 3 from the procedure described in Section 2. There would then be no weight vector change for the neurons associated with the first picture. The
28
weight vectors of the neurons associated with the second photo would then evolve toward the fixed weight vectors of the first network (which remain constant at the particle image positions during the whole solution process). There is an obvious variation of the latter algorithm in which the roles of the first and the second neural networks are interchanged. Table 2 shows results of some tests comparing the efficiency of the method, we call SOM2, in which the two neural networks evolve, and that, we call SOM1, in which only the second neural network evolves. Note that both methods gave perfect scores for all cases (not shown in Table 2 because of this) of flows in a corner with Dmax = 0.05, 0.1 and 0.15 and with photos having each 50, 100 and 200 particle images. As can be seen, both algorithms are very efficient but the algorithm where both networks evolve performs somewhat better. Because of this fact, only the latter algorithm will be hereafter considered.
7. Analysis of Convergence
Because we are using constructed data, we were able to monitor the rate at which the weight vectors that match are moving toward each other during the solution process. We have used two different measures of convergence to the solution of the matching problems. The first one is the number of good matches produced by the nearest-neighbor algorithm in matching weight vectors from the two sub-networks. It was run at the start and after cycle of the neural network
29
algorithm. Its success score gives a measure of the progress the neural network is making toward the solution. When the solution is reached, the matching weight vectors from the two sub-networks have coalesced and thus the nearestneighbor weight vector matching algorithm produces a perfect score.
As second measure of the convergence rate, we have calculated after each cycle the sum of the squares of the distances between the weight vectors from the two sub-networks that are known to match: E=
∑
w 1i − w 2j
2
,
(i, j) ∈ MP
where MP is the set of index pairs (i, j) of matching neurons. This parameter E is the square of the RMS (root mean square) error that is associated with the present state of this SOM neural network. The RMS error is a standard measure of performance of systems (such as neural networks in particular).
For all the problems we have solved, the behavior of these two measures of convergence were very consistent with that shown in Figure 6, which corresponds to the matching of pictures with 100 particle images, 80% of which are matchable. In the curves on the left hand side of Figure 6, the score of the nearest-neighbor particle matching algorithm is seen to be improved monotonically by the running of the neural network algorithm. Meanwhile, the curves on the right hand side indicate that the RMS error decreases exponentially or faster, (which can be seen by plotting the logarithm of E). A new interesting fact is made evident by these graphs, namely that, already after 6
30
cycles, nearest-neighbor matching would produce results close in quality to those obtained after 12 cycles. Thus, the neural network could be stopped after 6 cycles and a final nearest-neighbor weight vector matching done at this point.
We note that because they represent how the RMS error varies in the solution process, the curves on the right hand side of Figure 6 are actually the learning curves of the SOM neural network with respect to this measure. Meanwhile, the curves on the left hand side of Figure 6 are the learning curves with respect to the first measure of convergence we considered, namely the count of correct nearest-neighbor weight vector matches.
8. Analysis of the nearest-neighbor enhancement process
As in Step 2 of the algorithm, let neuron-c be the winner in one subnetwork, when the input is the weight vector of neuron-i from the other. We shall say that neurons c and i are "good nearest-neighbors" if they correspond to matching particle images. Otherwise, they shall be "wrong nearest-neighbors". Similarly, the direction of a weight vector translation will be said to be good or wrong according to whether or not it brings matching weight vectors closer to each other.
31
According to Eq. (2), at each cycle, the weight vector of neuron-i is incremented by the sum of all the translations it has been awarded by the winner neurons in the disk Di(R) centered on it. At the beginning, the number of good nearest-neighbors in this disk can be much lower than that of wrong nearestneighbors. In our examples, their proportion was typically 20 to 30% of all nearest-neighbors, as can be seen in Table 1, and visualized in Figures 3-5. However, the radius R of the disk Di(R) is then so large that the latter contains many neurons and statistical arguments can be invoked. Indeed, the weight translations that are not in good directions are quite random, and their resultant will tend to cancel out. This is a direct consequence of the fact that the distribution of tracer particles in the fluid is random and uniform. Meanwhile, those translations that it receives from the few good nearest-neighbors are coherent enough to add up to a resultant translation in a good direction. Weight vectors then globally move in a good direction, resulting in that the number of good nearest-neighbor matches will be larger in the next cycle.
Later on during the solution process, when the radius R has decreased appreciably, the disk Di(R) contains too few neurons for statistical averages to be meaningful. A second mode of action sets in. The translations contributed by the wrong nearest-neighbors do not cancel out. However, the number of good nearest-neighbors has by now increased so much over that of wrong nearestneighbors that their contribution dominates the weight vector increment for neuron-i. Correspondingly, the weight vectors are still moved in a good direction.
32
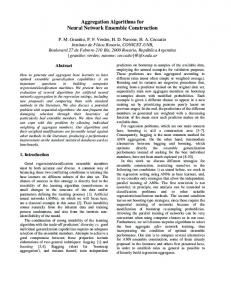
We have verified the accuracy of the above analysis by measuring these effects for a certain neuron-i in the network. At each cycle, we have calculated separately the sum of the weight increments that come only from the good nearest-neighbors and that of those that come only from the bad nearestneighbors. We found that the former sum is always in a good direction while the latter sum has always a value close to 0. Figure 7 shows the individual components of these two sums after one cycle of the algorithm. It illustrates strikingly the accuracy of the behavior we have just described.
9. Conclusion
Our aim of understanding the mechanisms involved in the SOM neural network proposed by Labonté [2,3], for the solution of the matching problem of PTV, has been attained. As accessory results in this study, we have obtained, in Section 4, the time complexity of the algorithm that we found to be linear in the total number of particle images in the two pictures to match. We have also shown that the variation of the algorithm, in which the weights are kept constant in one of the sub-networks, has comparable but slightly inferior efficiency than the original version. These results are shown in Table 2. The third one, in Appendix A, is a justification of why it is a good strategy to increase the
33
translation coefficient (i.e. the learning rate) α at each cycle, instead of decreasing it, as one may expect.
We have conducted tests with constructed data corresponding to three different fluid flows: a flow in a 900 corner, in a vortex and that of a viscous fluid in a channel. For each flow, we have considered pictures with 100 and 200 particles, and instances in which 0, 10, 20, 30 and 40 percent of the images had no matching partners. The fact that we knew in advance the correct matches for the particle images allowed us to measure many different features of the algorithm.
We have made two series of measurements of the rate of convergence of the algorithm. The first one consists in the sequence of the number of correct matches obtained by the nearest-neighbor algorithm, after each cycle of the algorithm. Our results are shown on the left hand side of Figure 6. They clearly indicate that this score increases essentially monotonically with the number of cycles of the neural network. The second series of measurements consists in the sequence of the RMS error of the neural network after each of its cycles. Our results are shown on the right hand side of Figure 6. They indicate that it decreases at least exponentially with the number of steps of the algorithm. This fact in itself is important for the future theoretical analysis of this algorithm, because there existed up to now no known theoretical reason for expecting this result. The curves of Figure 6 are the learning curves of the neural network. As a
34
benefit of these tests, the fact that only 6 cycles of the neural network are actually required to attain a satisfactory solution has been made conspicuous.
We have succeeded in uncovering how this neural network uses the continuity properties of the particle displacement field to enhance nearestneighbor particle image matching. Table 1 shows the results of performance tests of both the neural network algorithm and the nearest-neighbor particle image matching algorithm. The neural network is seen to determine, on the average, 3.5 times more correct matches than the latter algorithm. In Section 8, we have proposed an explanation for this success rate. We recall that in SOM neural networks, neurons are influenced by their neighbors. We argue that at the beginning of the solution process, there may be a very large number of wrong nearest-neighbors around any given neuron, but the pulls they exert on it are random so that they cancel out. On the other hand, the few good nearestneighbors, that then exist, will pull coherently enough to bring closer together the weight vectors of matching neurons. As this process occurs at each cycle, the number of good nearest-neighbors increases at each step. We have made measurements that corroborate this analysis. Figure 7 is a striking illustration of the reality of our proposed mechanism. This behavior of the algorithm justifies the title of the present paper.
Since many questions remain unsolved concerning the convergence of the Kohonen algorithm (see Section 9.3 of Kohonen [28]), results as the ones we
35
have obtained in the present study are of much value. Indeed, they point out a possible direction of approach to theoretical analysis of the general algorithm. Future work will attempt a rigorous mathematical analysis of the present neural network algorithm.
Future studies should test the performance of this neural network with instances of the correspondence problem in other domains than PTV. In particular, we will examine if this neural network algorithm can be used to enhance the very often used cross correlation algorithm. We expect that that it will because, as we have shown in our introduction, cross correlation is also a nearest-neighbor algorithm (in a higher dimensional space).
36
Appendix A
Why increase α as 1/R Experiments indicate that it is advantageous to increase the translation coefficient α at each cycle, instead of decreasing it, somewhat contrary to what one might expect. Here is our justification for this to be a good strategy.
Consider a neuron of index i, which is within the distance R of the winner neuron, which has index c, for the input vector w. If the neural network we have described were operated in a sequential mode (i.e. an on-line learning mode), the input vectors would be presented to it one after the other. The weight vector of neuron-i would then be translated, immediately after the presentation of w by the vector λTc where Tc = (w - wc) and λ is between 0 and 1. The parameter λ would be decreased after each cycle of presentation of all the inputs, in order to guarantee convergence. It should not be decreased too fast however because convergence to a stable state would then be too rapid, and this state would be far from the desired final state (see H. Ritter and K. Schulten [37]). A reasonable rate of decrease suggested for λ is that it be comparable to that of the winner neighborhood radius R.
When the same network is operated in a parallel mode (i.e. a batch learning mode), the weights of neuron i are updated only when all the inputs have been presented. Its weight increment is then ∆wi=
∑αT
c
, where the
D i (R)
37
sum is taken over the indices c of all the winner neurons in the disk Di(R). If ND denotes the number of such neurons, and TAverage the average of their vector contributions Tc, the increment ∆wi can be written as αNDTAverage. Because of the high coherence of the vectors Tc, discussed in Section 5, the vector TAverage is of the same order of magnitude as the individual translations due to good nearest-neighbors. Thus, invoking the same argument for convergence that is used for the coefficient λ, in the sequential version of the Kohonen algorithm, we take the coefficient αND to decrease essentially as R does. This yields the equation αND = kR for some constant k. ND is the total number of neurons in the disk Di(R), and thus is essentially equal to ρ π R2, where ρ is the number of particle images per unit surface. Of course, ND will be somewhat lower than this at the start, when R is very large and the disk Di(R) extends outside of the pictures. Nevertheless, this expression provides a reasonably good estimate of the order of magnitude of ND. The above equation is then reasonably well approximated by αρπR2 = kR from which follows αR = constant.
38
References
[1] Julesz B. Binocular Depth Perception without Familiarity Cues. Science 1964; 145:356-362.
[2] Labonté G. A SOM neural Network That Reveals Continuous Displacement Fields. In Proceedings of the 1998 International Joint Conference on Neural Networks at WCCI'98. IEEE Press, 1998, pp. 880-884.
[3] Labonté G. A New Neural Network for Particle-Tracking Velocimetry. Experiments in Fluids 1999; 26(4): 340-346.
[4] Hough P. Method and means for recognising complex patterns. U.S. Patent No. 3069654.
[5] Cootes TF, Hill A, Taylor CJ, Haslam J. Use of active shape models for locating structures in medical images. Image and Vision Computing 1994; 12(6): 355-366.
[6] Marr D. Vision. W.H. Freeman and Co, 1982.
39
[7] Heipke C. Overview of Image Matching Techniques. Presented at the OEEPE Workshop on the Application of Digital Photogrammetric Workstations, Lausanne, 1996.
[8] Huang TS and Netravali AN. Motion and Structure from Feature Correspondences: A Review. Proceedings of the IEEE 1994; 82(2): 252-268.
[9] Adrian RJ. Particle-Imaging Techniques for Experimental Fluid Mechanics. Annual Review of Fluid Mechanics 1991; 23: 261-304.
[10] Barnard ST and Thompson WB. Disparity analysis of images. IEEE-Pattern Analysis and Machine Intelligence 1980; 2(4): 333-340.
[11] Barnard ST. Stereo matching by hierarchical microcanonical annealing. SRI International, Technical note 414.
[12] Kölbl O, Bach U, Gasior D and de Laporte K. Multi-Template-Matching for the Automation of Photogrammetric Measurements. Archives of the 17th Congress ISPPS, Washington 1992; 29(B3): 540-548.
[13] Sharp JV, Christensen RL, Gilman WL and Schulman FD. Automatic map compilation using digital techniques. Photogrammetric Engineering and Remote Sensing 1965; 31(3): 223-239.
40
[14] Kreiling W. Automatische Erstellunb von Höhenmodellen und Orthophotos durch digitale Korrelation. Dissertation, Institüt für Photogrammetrie, Universität Karlsruhe, 1976.
[15] Hannah MJ. A system for digital stereo image matching. Photogrammetric Engineering and Remote Sensing 1989; 55(12): 1765-1770.
[16] Frieden BR and Zoltani CK. Fast tracking algorithm for multiframe particle image velocimetry data. Applied Optics 1989; 28: 652-655.
[17] Perkins RJ and Hunt JCR. Particle tracking in turbulent flows. In Advances in Turbulence. Springer-Verlag, 1989; 2: 286-291.
[18] Uemura T, Yamamoto F and Ohmi K. A high speed algorithm of image analysis for real time measurement of two-dimensional velocity distribution. In Khalighi B, Braun M, Freitas C (eds). Flow Visualization, FED-85, New York, ASME, 1989, pp. 129-134.
[19] Guezennec, Y G, Kiritsis N. Statistical investigation of errors in particle image velocimetry. Experiments in Fluids 1990; 10:138-146.
41
[20] Grant I and Liu A. Method for the efficient incoherent analysis of Particle Image Velocimetry images. Applied Optics 1989; 28: 1745-1748.
[21] Grant I and Liu A. Directional ambiguity resolution in Particle Image Velocimetry by pulse tagging. Experiments in Fluids 1990; 10: 71-76.
[22] Carpenter GA and Grossberg S. ART2: self-organization of stable category recognition codes for analog input patterns. Applied Optics 1987; 26: 4919-4930.
[23] Hassan YA and Philip OG. A new artificial neural network tracking technique for particle image velocimetry. Experiments in Fluids 1997; 23: 145-154.
[24] Knaak M Roghlübbers C and Orglmeister R. A Hopfield Neural Network for Flow Field Computation Based on Particle Image Velocimetry/Particle Tracking Velocimetry Image Sequences. In Proceedings of the 1997 International Conference on Neural Networks (ICNN '97). IEEE Press 1997, pp. 48-52.
[25] Hopfield JJ and Tank T. Neural Computation in Optimization Problems. Biological Cybernetics 1985; 52: 141-152.
[26] Grant I and Pan X. An investigation of the performance of multi layer neural networks applied to the analysis of PIV images. Experiments in Fluids 1995; 19: 159-166.
42
[27] Kohonen T. Self-organized formation of topologically correct feature maps. Biological Cybernetics 1982; 43: 59-69.
[28] Kohonen T. Self-Organizing Maps, Second Edition. Springer-Verlag, 1997.
[29] Casasent D and Psaltis D. Position, rotation and scale invariant optical correlation. Applied Optics 1976; 15(7): 1795-1799.
[30] von der Malsburg C. Self-organizing of orientation sensitive cells in the striate cortex. Kybernetick 1973; 14: 85-100.
[31] Willshaw DJ and von der Malsburg C. How patterned neural connections can be set up by self-organizatioin. In Proceedings of the Royal Society of London 1976; B194: 431-445.
[32] Kaski S, Kangas J, Kohonen T. Bibliography of Self-Organizing Map (SOM) Papers: 1981-1997. Neural Computing Surveys 1988; 1: 102-350.
[33] Bellando J and Kothari R. On Image Correspondence Using Topology Preserving Mappings. In Proceedings of IEEE International Conference on Neural Networks, Washington. IEEE Press, 1996, pp.1784-1789.
43
[34] Kothari R and Bellando J. Optical Flow Determination Using Topology Preserving Mappings. In Proceedings of IEE International Conference on Image Processing. IEEE Press, 1997, pp. 344-347.
[35] Feldman JA and Ballard DH. Connectionnist models and their properties. Cognitive Science 1982; 6: 205-254.
[36] Warsi ZUA. Fluid Dynamics, Theoretical and Computational Approaches. CRC Press Inc., Boca Raton, Florida, 1992.
[37] Ritter H and Schulten K. Convergence properties of Kohonen's topology conserving maps: Fluctuations, stability, and dimension selection. Biological cybernetics 1988; 60: 59-71.
44
Figure 1: Illustration of the areas of the two images involved in the crosscorrelation scanning process. On the left hand side, is shown in gray the patch of the first image for which a match will be sought in the second image. On the right hand side, the window in the second image where the match is sought is shown in lighter gray. The overlaid scanning patch from the first image is shown in darker gray.
45
Figure 2: Two successive photos of the tracer-particles suspended in a moving fluid. They cover the same region and are taken respectively at time t and t + ∆t.
46
Matchables/ Neural Net Nearest-Nb. Total Images C-W-M C-W-M Flow in a corner 100/100 80/100 200/200 160/200
100-0-0 78-2-0 196-2-2 156-3-3
32-54-14 33-51-8 46-132-22 34-133-24
82-8-10 69-7-8 166-16-18 125-23-18
37-59-4 37-55-5 44-151-5 39-152-4
Flow in a vortex 100/100 80/100 200/200 160/200
Flow in a channel 100/100 80/100 200/200 160/200
99-0-1 70-14-5 192-2-6 143-27-5
30-60-17 28-54-12 33-151-16 30-148-14
Table 1: Matching scores. In the first column are the ratios of the number of matchable images to the total number of images in each of the two photos. In the second column are the scores of the SOM neural network, in the form C-WM, where C is the number of correct pairs identified, W is the number of wrong pairs and M is the number of matchable images from the first picture that were not matched at all. In the third column are the scores of the nearest-neighbor algorithm in the same format.
47
Dmax
Number of particles
SOM1 C-W-M
SOM2 C-W-M
Vortex flow 0.05 50 100 200 0.10 50 100 200 0.15 50 100 200
50-0-0 100-0-0 200-0-0 47-0-3 87-1-12 185-10-5 40-3-7 89-4-7 177-14-9
50-0-0 100-0-0 200-0-0 50-0-0 97-2-1 190-7-3 50-0-0 88-9-3 170-20-10
Flow in a channel 0.05 50 100 200 0.1 50 100 200
48-0-2 93-3-4 186-6-8 45-1-4 82-2-16 150-24-26
50-0-0 96-4-0 196-4-0 50-0-0 88-7-5 168-25-7
Table 2: Some of the results of marker-particle matching tests for the two neural network algorithms: SOM1, in which the weights of only one sub-network evolve and SOM2, in which the weights of both sub-networks evolve. Dmax is the value of the maximum displacement. The second column gives the number of particle images per photo. In these tests, all the particles seen in the second photo are also present in the first one and the number of pairs to match is exactly this number of particles. The scores C-W-M, given in columns 3 and 4, correspond to C correct pairs found, W wrong pairs and M undetected matching pairs.
48
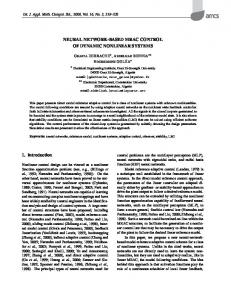
Figure 3: Particle displacements in a flow in the 900 corner at the bottom left of the pictures. The correspondence problem is that shown in Figure 2. The two PTV pictures have each 200 images, only 80% of which are matchable. They are shown superposed, the black circles being the images of the first photo. To the left is the displacement field produced by the neural network, with 86% correct pairs. To the right: that produced by the nearest neighbor particle matching algorithm, with only 19% correct pairs.
49
Figure 4: Particle displacements in a vortex flow centered at the center of the pictures. The two PTV pictures have each 200 images, 80% of which are matchable. To the left is the displacement field produced by the neural network, with 78% correct pairs. To the right: that produced by a nearest neighbor particle matching algorithm, with only 23% correct pairs.
50
Figure 5: Particle displacements in a flow through a straight channel, the walls of which are the top and bottom of the pictures. The two PTV pictures have each 200 images, only 80% of which are matchable. To the left is the displacement field produced by the neural network, with 89% correct pairs. To the right: that produced by a nearest neighbor particle matching algorithm, with only 24% correct pairs.
51
Flow in a corner 0.25
80
0.20
60
0.15
40
0.10
20
0.05
0
0.00 0
2
4
6
8
10
12
0
2
4
6
8
10
12
0
2
4
6
8
10
12
0
2
4
6
8
10
12
Vortex flow 80
0.30 0.25 0.20 0.15 0.10 0.05 0.00
60 40 20 0 0
1
2
3
4
5
6
7
8
9 10 11 12
Viscous flow in a straight channel 0.25
80
0.20
60
0.15
40
0.10
20
0.05
0
0.00 0
2
4
6
8
10
12
Figure 6: Graphs of the convergence measures. The graphs on the left-hand side show the number of correct pairs identified by the nearest-neighbor weight vector matching algorithm versus the number of cycles of the neural network. Those on the right-hand side show the total quadratic distance E between the weights of matching partners versus the number of cycles of the neural network.
52
53
Figure 7: Illustration of the neural network nearest-neighbor enhancement mechanism, after one cycle of the neural network algorithm. Top figure: all the weight vector increments that a neuron receives from neighboring neurons that are already matched correctly by the nearest-neighbor algorithm. One can see clearly that the direction of their resultant will be close to that of the thick black line, which indicates the direction of the correct match for this neuron's weight vector. Bottom figure: all the weight vector increments that the same neuron receives from neighboring neurons that are incorrectly matched by the nearestneighbor algorithm. One can see clearly that their resultant will be close to zero.
54