A Bayesian Network Model of Causal Learning Michael R. Waldmann (
[email protected]) Max Planck Institute for Psychological Research; Leopoldstr. 24, 80802 Munich, Germany
Laura Martignon (
[email protected]) Max Planck Institute for Human Development; Lentzeallee 94, 14195 Berlin, Germany Abstract Associationist theories of causal induction model learning as the acquisition of associative weights between cues and outcomes. An important deficit of this class of models is its insensitivity to the causal role of cues. A number of recent experimental findings have shown that human learners differentiate between cues that represent causes and cues that represent effects. Our Bayesian network model overcomes this restriction. The model starts learning with initial structural assumptions about the causal model underlying the learning domain. This causal model guides the estimation of causal strength, and suggests integration schemas for multiple cues. In this way, causal models effectively reduce the potential computational complexity inherent in even relatively simple learning tasks. The Bayesian model is applied to a number of experimental findings, including studies on estimation of causal strength, cue competition, base rate use, and learning linearly and nonlinearly separable categories.
Introduction The Temporal Order of Information Constraint A popular approach to causal learning postulates a process that is associative in nature (e.g., Shanks & Dickinson, 1987). According to this view, learning involves the association of cues and outcomes. An important characteristic of this class of models is its insensitivity to the semantics of learning events. Regardless of whether the cues represent conditional stimuli, features, causes, or effects, the learning process is always identical. Most notably, the reduction of causal learning to the association of cues and outcomes implies the equation of predictive learning and diagnostic learning. Predictive learning involves the association of causes (cues) and effects (outcomes), diagnostic learning the association of effects (cues) and causes (outcomes). As long as the cues and outcomes in these two tasks have comparable characteristics, learning should be identical. This approach to learning embodies a temporal order of information constraint. The information received first in time is assigned to the cue layer of the associative network. Associative theories are only one example of a large class of theories that use this constraint. Multiple-cue integration models, such as the lens model, and many categorization theories also assign cues on the basis of temporal order of information.
We have conducted a number of experiments which show that this class of models is inadequate for describing causal learning (see Waldmann, 1996, for an overview). Our experiments demonstrated that human learners are indeed sensitive to the causal status of cues and outcomes. In particular, the experiments showed that a predictive learning task in which multiple causes are used to predict a common effect is learned differently from an otherwise identical diagnostic learning task in which multiple effects are used as cues to a common cause.
The Temporal Order of Events Constraint A key feature of our model is the decoupling between the temporal order of the incoming information and the represented temporal order of events. Learning events are assigned to the causal model on the basis of the temporal order of events in the real world and not on the basis of the temporal order of information. Thus, our model honors the temporal order of events constraint. We assume that learners bring to bear prior knowledge about the precedence of causes and effects. Causes occur temporally prior to their effects, regardless of whether the information given first is about causes (predictive learning) or about effects (diagnostic learning). In both tasks, the cause information is assigned to the cause layers of the causal models and the effect information to the effect layers.
The Model The model involves four steps. It starts with initial assumptions about the causal model that presumably underlies the learning data (Step 1). This initial causal model serves two functions. It guides the process of estimating the causal power of each cause with respect to its effects (Step 2), and it suggests schemas for integrating the causal power estimates for multiple cues (Step 3). In predictive learning these cues represent multiple causes, in diagnostic learning multiple effects. Whenever the initial model fails to represent the learning data, errors will occur. These errors will suggest a revision of the causal model (Step 4). Subsequent learning will be based on the revised model.
Setting up an Initial Causal Model (Step 1) According to the model, learners make initial hypothetical assumptions about the causal model underlying the learning input. In our experiments these assumptions are typically
1102
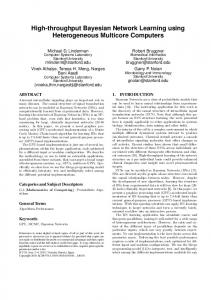
manipulated by means of differential initial instructions, but other cues to causality such as temporal precedence may also be used (see Waldmann, 1996). The top-down orientation of our model deviates sharply from the majority of Bayesian network models (e.g. Pearl, 1988; Spirtes, Glymour, & Scheines, 1993). Such models are typically developed as normative tools for statistical analysis, and they often aim at developing strategies to bootstrap causal structures from covariation data in a bottom-up fashion. These methods are not intended to model everyday causal reasoning. On the contrary, they are often motivated by the assumption that causal analysis needs to be guided by expert systems that embody Bayesian strategies. In our view, it is unlikely that human learners are good at inducing the causal relations between several interconnected events solely on the basis of covariation information. Causal models have the potential to dramatically reduce the processing effort during learning. Consider, for instance, the potential effort involved in a domain with three interrelated binary events, entailing dozens of unconditional and conditional frequencies that a learner might decide to focus on (see Pearl, 1988). Figure 1 illustrates three different causal models that can be generated by three events. The arrows denote direct causal influences that point from causes to effects. The computational advantage of such models is that they encode not only information about direct dependencies, but also additional structural information about further dependencies (see Pearl, 1988; Spirtes et al., 1993). For example, a common cause model with two effects (Fig. 1A) conveys the information that the two effects are marginally correlated but become independent conditional upon their common cause. A common effect model (Fig. 1B), by contrast, implies that the two alternative causes are marginally independent of each other, but become dependent conditional upon their common effect. Finally, a causal chain model (Fig. 1C) entails that the initial cause becomes independent of the final effect once the intermediate cause is held fixed. These are just some examples of the many useful implications of these models. Whenever these models describe the learning domain appropriately, they have the potential to greatly reduce the learning information required.
Estimating Causal Power (Step 2) One of the primary functions of causal models is that they specify the information relevant to the assessment of the strength of causal relations. Not every statistical relation observed in learning input is relevant for assessing causal hypotheses; causal models can provide guidance in the selection of relevant information. Following Cheng (1997), the strength of a direct causal relation, the causal power of the cause, can be defined as the probability of the effect in the presence of the cause in the absence of all alternative influences. Causal power is assessed in the cause-effect direction regardless of the order of learning events. At this point, the model is restricted to situations in which information about frequencies is available (e.g., trial-by-trial learning). We assume that learners use frequency information, which is updated after each learning trial, to assess causal power. However, not all the
unconditional and conditional frequencies have to be encoded, but only those frequencies which, according to the initial causal model, are relevant to the estimation process. Assuming a situation in which all the causal factors are specified within the causal model (“closed world assumption”), causal power can be directly measured on the basis of observed conditional frequencies. In the simple case of one cause and one effect, the causal power of the cause is represented by the conditional probability of the effect e given cause c, P(e|c). This estimate is already guided by a prior causal model that specifies which of the two events is the cause and which the effect.1
c
e2
c2
e2
A
B
C
e1 c1
e c
e1
Figure 1: A common cause (A), common effect (B), and causal chain (C) model. The role of causal models is even clearer in more complex situations with three events (see Eells, 1991; Waldmann & Hagmayer, submitted). In the common cause situation (Fig. 1A), the causal power relation between the cause c and each of the effects e1 and e2 can similarly be inferred on the basis of the conditional probabilities P(e1|c) and P(e2|c), because the model implies conditional independence of the two effects. The situation is different when the causal arrows are reversed, yielding a common effect model with two alternative causes c1 and c2 (Fig. 1B). In this situation, the probability of the effect in the presence of either cause is also influenced by the possible presence of the alternative cause. Thus, in a situation in which the two causes increase the probability of the effect (generative causes), the appropriate method of measuring causal power is to focus on situations in which the alternative causes are absent (for a discussion of preventive causes, see Cheng, 1997). For example, the causal power of c1 can be inferred on the basis of P(e|c1 .~c2). (An isolated period means “and,” and “~” refers to the absence of the cause.) Finally, in causal chains the causal power of the initial cause c over its direct effect e1 should be independent of the final effect e2. Therefore, the simple conditional probability P(e1|c) should serve as an indicator of the causal power of event c. The causal power of the intermediate cause e1 is dependent on the kind of causal chain underlying the domain. In a genuine Markov chain, in which the initial cause is independent of the final __________ 1
A more realistic assumption is that there are other unknown causal influences. Cheng (1997) has derived an empirical estimate of causal power for a single cause-effect relation, for situations in which there are unknown causes. Although we have also developed our model for this more realistic case, we will focus in this paper on fully specified models. Most of the experiments described below can be explained using the simplifying assumption of a closed world. The more complex version of the model that includes unknown causal factors does not qualitatively change the predictions for these experiments.
1103
effect conditional upon the intermediate cause, the conditional probability P(e2|e1) is an appropriate indicator of causal power. However, more complex chains are possible in which the events c and e1 interact (Eells, 1991). In these situations it would be appropriate to control for the influence of the initial cause c by looking at P(e2|e1.c) and possibly also P(e2|e1.~c). (See also Waldmann & Hagmayer, submitted.) With genuine Markov chains both methods should lead to the same results. In summary, the model estimates causal power on the basis of the relevant frequency information. These estimates are updated after each learning trial.
the causal powers of c with respect to either effect. In a situation with two mutually exclusive, exhaustive causes (a situation typical of many categorization experiments), a diagnostic decision is achieved by comparing the conditional probability of the cause (Equation 2) with the conditional probability of the absence of the cause, P(~c|e1,e2). According to the model, the learner will hypothetically assume that a specific cause is present, estimate the probability of the observed pattern, and then compare this estimate with the hypothesis that the cause is not present. These estimates are weighted by the frequency of the stored learning exemplars.
Integrating Causal Power Estimates (Step 3)
Revising the Causal Model (Step 4)
The second important function of causal models is the guidance they provide for the integration of multiple cues. We assume that the initial strategy of learners is to integrate the causal power estimates on the basis of structural assumptions implied by the semantics of causal networks. This strategy is computationally less demanding than trying to assess the probabilities of the outcomes conditional upon all possible patterns of cues from the learning input.
So far, the model can only learn about domains that are consistent with the structure of the initial causal model. However, this consistency is not always given. In a predictive learning task, for example, a common effect model may not adequately represent a causal situation. It could be the case that while neither of the causes alone causes the effect, both causes together do so. With a common effect model as the initial model, the two power estimates will be zero. If these estimates are plugged into the noisy-or schema, the incorrect prediction that the effect is absent when both causes are present is obtained. Thus in this situation the model will make prediction errors. We assume that learners will notice these errors, and consider modifying the structure of the model in a parsimonious fashion. A small modification is one that does not add unknown causal factors, and does not change the causal roles of the learning events. One possibility would be to include configural causes in the causal model. This modification amounts to adding an extra term for the conjunctive cause c12 which expresses its power independent of the power of the two components, P(e|c1,c2) = p1~2 + p2~1 + p12 (Equation 3). Unlike in the noisy-or schema, the causal power of each individual cause only manifests itself in the absence of the causes with which it interacts. Therefore the individual causal power estimates only apply to situations in which interacting factors are absent (e.g., p1~2 refers to the causal power of c1 in the absence of c2). On the basis of this modified integration schema (And schema), power estimates have to be obtained for each individual cause and separately for the conjunctive cause. This new model can learn about some types of interactions between causes, such as the situation in which the presence of two causes is necessary for the effect. However, it will fail in situations with more complicated interactions. For example, in an exclusive-or scenario (XOR), either the presence of both causes or the absence of both causes produces the effect, but neither of the causes does so on its own. To account for this situation a more complicated schema has to be invoked. In general we claim that people attempt to make small modifications to the initial causal model. The initial schema for multiple causes will be the noisy-or schema, followed by the And schema. Other modifications of the causal structure are also possible (e.g., adding causal links). It is important to note that, despite the top-down direction of the model, it is implicitly sensitive to violations of model assumptions. The initial model will generate prediction or
Predictive Learning Common effect models are typical causal models underlying predictive learning with multiple cues (see Fig 1B). An important assumption implicitly encoded by these models is that the alternative causes occur independently of each other, and that their individual causal impacts on the effect are also independent. Thus, a noisy-or integration schema provides a natural integration strategy for multiple causes (see also Pearl, 1988, chap. 4.3.2). Assuming two causes, a noisy-or schema predicts that the effect is caused either by cause1 or by cause2. Since these two causes may overlap it is necessary to subtract the intersection. Based on the two power estimates p1 and p2 for the two causes c1 and c2, the conditional probability of the effect can be computed using the noisy-or schema, P(e|c1,c2) = p1 + p2 − p1⋅p2 (Equation 1). In summary, in a predictive learning situation with a common effect model the causal power of each individual cause is assessed on the basis of frequency information (Step 2). Then these estimates are integrated into a prediction using the noisy-or schema (Step 3). This process is repeated at each learning trial. Diagnostic Learning A typical causal model underlying diagnostic learning with multiple effect cues is the common cause model (see Fig 1A). This model assumes that the effects are independent of each other conditional upon the states of the cause, thus simplifying the diagnostic judgments. Instead of having to store the probability of the cause conditional upon all patterns of effect cues, the model makes it possible to use the individual power estimates and integrate them by taking their product. For example, in a common cause situation with two effects e1 and e2, the Bayesian common cause integration schema can be expressed as P(c|e1,e2) = α⋅P(c)⋅P(e1|c)⋅P(e2|c) (Equation 2). In this formula, α refers to a normalizing constant, P(c) to the unconditional probability (base rate) of the cause, and the two conditional probabilities on the right-hand side to
1104
diagnosis errors when it is inconsistent with the learning data. This will in turn lead to a (parsimonious) modification of the initial model.
Empirical Evidence The model provides a theoretical basis for a number of findings in the domain of causal learning.
Estimating Causal Power Waldmann and Hagmayer (submitted) have studied the process of assessing the causal power relation between a potential cause and an effect in the presence of a covarying third event. Participants received information about the raw data of a fictitious neuro-immunological study. All participants in our study received identical learning data (a list of cases), and had to answer the same question about the strength of the causal relation between the cause and the effect. Across participants, we manipulated the causal role of the third event by means of initial instructions in which the causal role of this event was differentially described (see Fig. 1). Thus participants believed they were confronted with a common cause model, a common effect model, or a causal chain model. The results clearly confirmed the predictions of our theory. Participants only held the third event constant when they thought it was part of a common effect model, otherwise they tended to ignore it. One additional interesting result of this study is that no participant explicitly attempted to test the fit of the model to the data. Since learning data was identical, the statistical structure of the learning input was not equally consistent with the hypothesized causal model. However, as anticipated by our model, participants did not become aware of these inconsistencies, but rather used the instructed model to estimate causal power in a top-down fashion. (In this experiment no learning feedback was given so that participants could not become implicitly aware of these mismatches.)
Asymmetries of Cue Competition The model readily explains the asymmetries of cue competition found in experiments that characterize the learning cues either as causes of a common effect or as effects of a common cause (Waldmann & Holyoak, 1992; Waldmann, 1996). In these experiments, a blocking paradigm was used to investigate cue competition. Participants learned in Phase 1 that a specific cue was perfectly correlated with the outcome. In Phase 2, a second redundant cue was constantly paired with the first cue. Now the compound of both cues was predictive of the outcome. Associative theories such as the Rescorla-Wagner rule (1972) predict lower associative weights for the redundant cue relative to a condition in which this cue is not paired with the predictive cue from Phase 1. Our experiments show that, although the learning input was identical, a significant reduction in the ratings of the redundant cue was only observed when the cues were introduced as causes of a common effect (predictive learning), but not when they were characterized as effects of a common cause (diagnostic learning). The model anticipates this asymmetry, because causal power estimates are computed in the cause-effect direction
on the basis of assumptions about the underlying causal model. In the predictive condition the cues represent multiple causes. The model predicts that for common effect models it is necessary to calculate causal power estimates for individual causes in the absence of alternative causes. Since in Phase 2 of the blocking design the new redundant cause is never presented in the absence of the cause established within Phase 1, no causal power estimate can be obtained for this redundant cause. Thus we can expect participants to be uncertain about the causal impact of this cue, and express this uncertainty in lowered ratings. By contrast, in the diagnostic condition a common cause model is assumed; the causal power of each effect can be assessed without having to hold constant collateral effects. Thus, both effect cues should yield similar ratings (i.e., absence of blocking).
Asymmetries of Base Rate Use In the last few years, a number of psychologists have shown that sensitivity to base rate information can be obtained when frequency information is given as learning input (e.g., Cosmides & Tooby, 1996). Although our model is restricted to frequency data, it predicts interesting asymmetries in the use of base rates. Whereas the predictive integration schemas (e.g., noisy-or schema) do not contain terms for the base rates of the causes, the diagnostic schemas (e.g., common cause schema) integrate causal power estimates with base rate information. Waldmann and Reips (in preparation) have tested this assumption. In a number of experiments, participants learned about identical causal structures with varying causal base rates in either the cause-effect or the effect-cause direction. Subsequent to the learning phase all participants had to give diagnostic judgments. In line with the model’s predictions, participants used base rate information when prior learning was diagnostic but tended to ignore base rates when it was predictive (see also Waldmann, 1996).
Linearly Separable Versus Nonlinearly Separable Category Structures Waldmann, Holyoak, and Fratianne’s (1995) experiments on category learning provide a further test case for the model. These experiments showed that the relative difficulty of linearly separable and nonlinearly separable category structures interacts with the causal role of the learning cues. Table 1 shows two of the category structures investigated. The learning exemplars embody three binary dimensions that indicate either high intensity (H) or low intensity (L) values. For example, in Experiments 4 and 5 participants received pictures of a stone surrounded by three colored iron compounds. The orientation of the compounds specified the values of the dimensions: Either the ends of the compounds pointed to the stone (H) or their sides faced the stone (L). Thus, case 1 (HHH) in Table 1 represents a picture in which the three compounds point to the stone. Two category structures were compared. In the linearly separable arrangement (LS), high values are more typical for category A and low values for category B. Within category A, at least two out of three dimensions had high values. By contrast, in the nonlinearly separable arrangement (NLS), neither high nor low values were typical for the two
1105
categories A and B. This structure can only be categorized on the basis of a configural cue. Within category A the first and the third dimension are positively correlated (HH or LL), whereas within category B they are negatively correlated (HL or LH). This structure corresponds to an XOR structure with an additional irrelevant feature (Dimension 2). Table 1: Structure of item sets (Waldmann et al., 1995) Linearly Separable Categories A
B
Dimensions 1 2 3 1. 2. 3. 4. 5. 6. 7. 8.
Nonlinearly Separable Categories A
B
1. 2. 3. 4. 5. 6. 7. 8.
H H H H H L H L H L H H L L H L H L H L L L L L Dimensions 1 2 3 H H L L H H L L
H L H L H L H L
H H L L L L H H
In the experiments, the factor category structure (LS vs. NLS) was crossed with a second factor in which the causal interpretation of the cues was manipulated by means of initial instructions. In the predictive learning condition, participants were told the three compounds were potential causes: They emit either high (H) or low (L) intensity magnetic waves which may cause some stones to become magnetic. The task was to decide whether the stones in the pictures were magnets (category A) or were not (category B). Thus in this condition a common effect model was instructed. In the diagnostic learning condition a common cause structure was suggested to the participants; they were instructed that some of the stones potentially emit magnetic waves which may affect the orientation of the compounds. The orientation may indicate either a strong (H) or a weak (L) effect. In both conditions the orientation of the compounds served as cues, the only difference was whether the cues were interpreted as causes or as effects. The experiments yielded a number of findings that can be explained by our model (see Waldmann et al., 1995). One general finding was that in the predictive learning condition the LS category structure was easier to learn than the NLS structure. This finding is in line with the assumption inherent in the model that learners sequentially activate integration schemas that are ordered on the basis of complexity. As the model starts with a noisy-or schema, it fails initially with both category structures. However, the next schema (And schema) includes additional terms for paired cues.
This schema picks up the two-out-of-three rule embodied in the LS structure but is unable to capture the more complex XOR interaction in the NLS structure. The findings in diagnostic learning conditions are more complex. In Experiment 5 (Waldmann et al., 1995), participants learned that the exemplars in category A were caused by the presence of a magnet, whereas the stones in category B were not magnetic. This instruction yielded a clear learning advantage for the LS structure. Far less errors were committed when participants learned the LS structure than when they learned the NLS structure. However, when the instructions were slightly modified the opposite effect was observed. In Experiment 4 participants were told that there are two types of magnets, strong and weak. As in Experiment 5, participants only had to decide whether there was a magnet (category A) or not (category B). No feedback was given about the strength of the magnet. Thus, apart from the instructional difference, the procedure was identical in the two experiments. Nevertheless, the NLS structure proved easier to learn than the LS structure in Experiment 4, in which the variability of the strength of the magnets was pointed out. How can this reversal be explained by the model? For Experiment 5, the model first sets up a common cause model, which is based on the initial instructions (Step 1) and specifies how causal power is assessed (Step 2). On the basis of frequency input, updated after each learning trial, the causal power between the presence and absence of the cause (category A vs. B) and each of the three effects will be estimated by calculating the conditional probability of the states of the effects (H vs. L), given the two categories. For example, P(e1=H|c) expresses the probability of the first dimension having a high intensity value in the presence of a magnet. In the LS condition, the model will eventually learn that the probability of each effect having a high value is 0.75 within category A and 0.25 within category B. The probabilities of a low value are the complements. By contrast, in the NLS condition these estimates will be 0.5 for both categories. To obtain categorization judgments the power estimates will be plugged into a common cause schema (see Equation 2) for three effects. Using this schema, the probability of the presence (category A) or absence (category B) of the cause will be compared. For example, given an HHH pattern (case 1) the probability of category A is the product of the three power estimates of the three effects (0.753) multiplied by the base rate (0.5) and the normalizing constant (identical for both categories). The fact that the probability of category A is higher than that of category B will lead to the correct decision that this case belongs to category A. Applying this schema to the other learning exemplars also leads to correct categorizations. By contrast, applying this procedure to the NLS structure will not be successful. Given that each effect is equally associated with both categories, no reliable categorization can be achieved. The only solution is to modify the initial model (Step 4), which will take time relative to the LS condition. To model the results of Experiment 4, the additional assumption has to be made that participants enter the task with prior knowledge that strong magnets tend to produce high intensity values whereas weak magnets are more likely to
1106
cause low values. The model again approaches the task using a common cause model (Step 1). However, based on the instructions, the model has to express the fact that the cause (category A) can be strong or weak. It is therefore necessary to obtain causal power estimates for three causal events, the cause being strong, the cause being weak (e.g., P(e1=H|c=weak), and absence of the cause (category B). Since no feedback is given about the strength of the cause, the participants have to infer the probable state of the cause by themselves. This can be achieved on the basis of prior assumptions about a positive correlation between the state of the cause and the state of the effects, which can be implemented by having the learning process start with a preset data base that embodies these correlations. These assumptions will, for example, lead to the decision that the HHH case in the NLS structure is probably caused by a strong cause. The feedback confirms that this case indeed belongs to category A. Therefore, the causal power estimate for the strong value of the cause will be updated. Similarly, an LLL case will lead to an updating of the weak value of the cause. Due to the outlying value of the middle dimension, the other two cases within category A (e.g., HLH) will initially lead to incorrect category B decisions (the model does not know yet that Dimension 2 is irrelevant). However, the learning feedback reassigns these two cases to category A. Now a decision has to be made between a strong and a weak cause, which in the HLH case leads to an update of the power estimate for the strong cause, and in the LHL case to an update for the weak cause. Eventually the model will learn that the probability of high intensity values of the relevant effects (Dimensions 1, 3) is 1 when the cause is strong and 0 when it is weak, or vice versa when the cause is weak. Dimension 2 will lead to estimates of 0.5 with either state of the cause. Furthermore, the probabilities of the values of all three effects are uniformly 0.5 within category B. Using these power estimates the model is able to correctly classify the eight cases of the NLS arrangement. The model classifies a case into category A when either a strong or a weak cause is inferred; otherwise the case will be assigned to category B. With the power estimates generated in Step 2 (and 0.25 as the base rate estimates for the two states of the cause) the probability of category B will always be lower than that of category A for cases 1 to 4. By contrast, cases 5 to 8 will be correctly assigned to category B. Using the initial assumptions outlined above, the model will make more errors with the LS structure than with the NLS one. Again, the model will initially assign the LLL case to category A (weak state), although this is the wrong decision in this condition. Except for the correctly classified HHH case, the other cases within category A will create problems. They will be wrongly assigned to category B. After feedback they will be reassigned. However, since these exemplars have more H than L values, only the power estimate for the strong variant of the cause will be updated. Eventually this will lead to a fading out of the hypothesis that the cause might also be weak, because the constant updating of only one value of the cause will boost the base rate estimate for this value at the expense of the alternative value. At the asymptote the model will have learned that there is no weak cause, but this will take time.
Discussion Causal learning is typically confronted with a large data base of potentially relevant statistical relations. One way of dealing with this complexity is to use prior knowledge about mechanisms (see Koslowski, 1996). However, when no prior knowledge is available other types of solutions have to be used. Our Bayesian network model belongs to a fairly recent class of theories that invokes more abstract types of structural knowledge. We assume that learners start with initial assumptions about the causal structure of the learning domain. These models guide the estimation of causal power on the basis of frequency information, and they suggest integration rules for prediction and diagnosis. In this way, causal models effectively reduce the potential computational complexity inherent in even relatively simple causal learning tasks. Cheng, P. W. (1997). From covariation to causation: A causal power theory. Psychological Review, 104, 367405. Cosmides, L., & Tooby, J. (1996). Are humans good statisticians after all? Rethinking some conclusions from the literature on judgment under uncertainty. Cognition, 58, 1-73. Eells, E. (1991). Probabilistic causality. Cambridge: Cambridge University Press. Koslowski, B. (1996). Theory and evidence. Cambridge, MA: The MIT Press. Pearl, J. (1988). Probabilistic reasoning in intelligent systems: Networks of plausible inference. San Mateo, CA: Morgan Kaufmann Publishers. Rescorla, R. A., & Wagner, A. R. (1972). A theory of Pavlovian conditioning: Variations in the effectiveness of reinforcement and non-reinforcement. In A. H. Black & W. F. Prokasy (Eds.), Classical conditioning II. Current research and theory. New York: Appleton-Century-Crofts. Shanks, D. R., & Dickinson, A. (1987). Associative accounts of causality judgment. In G. H. Bower (Ed.), The psychology of learning and motivation: Advances in research and theory (Vol. 21). New York: Academic Press. Spirtes, P., Glymour, C., & Scheines, R. (1993). Causation, prediction, and search. New York: Springer-Verlag. Waldmann, M. R. (1996). Knowledge-based causal induction. In D. R. Shanks, K. J. Holyoak & D. L. Medin (Eds.), The psychology of learning and motivation, Vol. 34: Causal learning. San Diego: Academic Press. Waldmann, M. R., & Hagmayer, Y. (submitted). Estimating causal strength: The role of structural knowledge and processing effort. Waldmann, M. R., & Holyoak, K. J. (1992). Predictive and diagnostic learning within causal models: Asymmetries in cue competition. Journal of Experimental Psychology: General, 121, 222-236. Waldmann, M. R., Holyoak, K. J., & Fratianne, A.. (1995). Causal models and the acquisition of category structure. Journal of Experimental Psychology: General, 124, 181206. Waldmann, M. R., & Reips, U.-D. (in preparation). Base rate appreciation after predictive and diagnostic learning.
1107