graphically they are fairly intuitive (Ben-Gal [1], Heckerman [8]). A BN can be learned .... vector,X and ,E a set of directed edges connecting the nodes. An edge ji.
Quality Technology & Quantitative Management Vol. 9, No. 1, pp. 97-114, 2012
QTQM © ICAQM 2012
Efficient Bayesian Network Learning for System Optimization in Reliability Engineering A. Gruber and I. Ben-Gal Department of Industrial Engineering, Faculty of Engineering, Tel Aviv University, Tel-Aviv 69978, Israel (Received October 2010, accepted March 2011)
______________________________________________________________________ Abstract: We present a new Bayesian network modeling that learns the behavior of an unknown system
from real data and can be used for reliability engineering and optimization processes in industrial systems. The suggested approach relies on quantitative criteria for addressing the trade-off between the complexity of a learned model and its prediction accuracy. These criteria are based on measures from Information Theory as they predetermine both the accuracy as well as the complexity of the model. We illustrate the proposed method by a classical example of system reliability engineering. Using computer experiments, we show how in a targeted Bayesian network learning, a tremendous reduction in the model complexity can be accomplished, while maintaining most of the essential information for optimizing the system.
Keywords: Bayesian networks, differential complexity, mutual information, reliability of complex systems, resources optimization.
______________________________________________________________________ 1. Introduction
B
ayesian network (BN) is a probabilistic model representing the relations between random variables of a certain domain. BNs have been extensively employed in various applications in engineering and decision making (Pearl [11]). A BN is composed of a directed acyclic graph (DAG), and a set of parameters. The DAG contains vertices (or nodes hereinafter) and edges, where each node represents a random variable and an edge, connecting two nodes, represents a probabilistic dependency between these random variables. Essentially, the BN encodes the joint probability distribution P ( X) of the domain’s random variables that are denoted by X. Since BNs can be presented graphically they are fairly intuitive (Ben-Gal [1], Heckerman [8]).
A BN can be learned from observable data. Graphical constraints can be applied while learning, and can be used efficiently for limiting the complexity of the resulting model. In this paper, we pay special attention to complexity-reduction versus the accuracy of the model that can be accomplished from the learning. In order to efficiently learn a BN, numerous learning methods have been suggested in recent years (e.g., Chickering [3], Heckerman [8], Heckerman et al. [9], Cheng et al. [2], Pearl [12]). In particular, the K2 (Cooper and Herskovits [5]) and the PC (Spirtes et al. [13]) are two examples of predominant BN learning algorithms. Most of these methods, address the model complexity by justifying independencies or conditional independencies between variables, through statistical tests that are imposed on the data in one way or another. One of the methods that we follow here is the adding-arrows by Williamson [14]. The adding-arrows is an algorithm which attempts to maximize the total information weight of the
98
Gruber and Ben-Gal
BN. Williamson [14] showed that a BN, satisfying some arbitrary constraint, that best approximates a joint probability distribution, is one for which total mutual information (MI) weight is maximized. He generalized the arguments presented earlier by Chow and Liu [4] regarding spanning trees. Chow and Liu [4] proved that, minimizing the Kullback-Leibler (KL) divergence between the “true” distribution and the distribution represented by a Bayesian tree, is equivalent to maximizing the sum of MI weights within the tree. Nonetheless, their underlying objective was to best approximate the joint probability distribution describing the domain without addressing any random variable differently from the other variables. In particular, Chow and Liu did not attempt to address optimization cases - as we aim doing here - where some of the variables might have larger effects on the target variable than others. Our underlying purpose is to learn a BN in an efficient manner such that it can support optimization process of a complex system. In particular, we consider a system reliability-availability-maintainability (RAM) problem where the knowledge is extracted from data generated by the system (or other identical systems), encoded into the learned BN, such that the redundant information is diminished. In order to improve the reliability of the system, one might have to establish a system model that represents the system’s performance as a response function of some input variables. Having done that, maximization of an objective function could be accomplished by changing some of the controllable input variables. For example, when considering the availability of a RAM system, as we do in this paper, the controllable variables can be the number of spare parts of different types, the preventive maintenance policy and the number of workbenches to be used. The system model, however, is fundamentally difficult to establish due to several reasons (Zacks [17]) such as:
Exponential complexity in the number of components in the system
Unknown failure distributions as well as distributions of other relevant processes
Interactions between various components that affect the system states
These obstacles can be tackled by using numerical methods and computer experiments (Kennet and Zacks [10]), e.g., using Monte Carlo Simulation for predicting the system output. The statistical properties of man-made systems are fundamentally difficult to retrieve. Yet, they are often modeled via Weibull distributions for failures (Zacks [18]) and Log-normal distributions for repairs/replacements (Zacks [16]). With the growing number of inputs, however, numerical calculations should generate as many predictions of the objective function as required for the optimization procedure - reaching tens of thousands and sometimes hundreds of thousands realizations. This approach becomes rapidly impractical for optimization purpose, as the calculation procedures of a single prediction realization might last minutes and sometimes hours (Dubi [6]). The motivation of this work is to improve the performance of a complex system with a minimal use of expert knowledge for modeling the system, avoiding the above-listed obstacles. We claim that BN learning from data could address such a task efficiently, as will be illustrated in section 5. In this paper we present a BN learning method oriented to support optimization. To do so, we maximize the sum of weights (in terms of mutual information measures) about the target variable, and then we maximize the sum of the remaining weights within the network, according to the principles of Williamson [14]. It is shown that when the learning is target-oriented, a good trade-off between the model accuracy and the model complexity can
Efficient Bayesian Network Learning for System Optimization
99
be achieved if the predetermined target variable is taken into account at the learning stage. More formally, the proposed method has the following two stages: for a given target variable X i X, the approximation to the marginal probability distribution P ( X i ) as a function of the entire domain can be efficiently achieved by first obtaining the set of the most affecting (parent) variables Zi X where X i Zi , such that the sum of the MI weights between X i and Zi is maximized. Then, having obtained Zi , by maximizing the total MI weights among the variables that are included in Zi . Generally in this paper, vectors and sets are bold, random variables are denoted by capital letters and their realizations by small case letters. The rest of this paper is organized as follows. Section 2 provides the mathematical formulation to BN and BN learning. It discusses the unconstrained and the constrained learning approaches, both compared to Williamson’s [14] method. Section 3 gives a schematic example and compares the adding-arrows approach with the proposed method, in both unconstrained and constrained learning configurations. The algorithm is presented and detailed in Section 4. Section 5 presents the suggested approach through a real-life example of a RAM problem. It also suggests quantified measures for the trade-off between model accuracy and model complexity. Section 6 summarizes the paper.
2. Bayesian Networks Learning A Bayesian network B (G , ) can often be used to represent the joint probability distribution of a vector of random variables X ( X1 ,..., X N ). The structure G ( V, E ) is a directed acyclic graph (DAG) composed of V, a vector of nodes representing the random vector X, and E, a set of directed edges connecting the nodes. An edge E ji V j Vi manifests dependence between the variables X j and X i , while the absence of an edge demonstrates independence between the variables. A directed edge E ji connects a parent node V j to its child node Vi (Heckerman [8], Yehezkel and Lerner [15]). We denote by Z i {X i1 ,..., X iLi } the set of “parent” variables of the random variable X i represented by the set of parent nodes Di {Vi1 ,..., Vi Li } in G ( V, E ) where for any literal, the superscript j stands for its index in the corresponding set and where Li Z i is the size of the set Z i X. The set of parameters holds the local conditional probabilities over X, p ( x i zi ) that quantify the edges for each node state x i and each parents’ state zi (i.e., a conjunction of states x i1 ... x iLi ) of Z i . Williamson [14] indicated that a BN suffices to determine a probability distribution, since for each atomic state that is defined by a conjunction of all variable states ( x1 ,..., x N ), one obtains p ( x1 ,..., x N ) i p ( x i zi ). He showed that a BN, satisfying some arbitrary constraint, that best approximates a joint probability distribution, is one for which the sum of MI weights over the edges is maximized. In particular, he generalized the argument presented by Chow and Liu [4] regarding the best approximating spanning tree. Chow and Liu [4] proved that a Bayesian tree (with encoded probability distribution q ) that best approximates a true distribution p, is a maximum weight spanning tree. They used the Kullback-Leibler (KL) divergence (also known as the relative entropy) as a distance measure between the two distributions: d ( p q)
x1 ,..., x N X
p ( x1 ,..., x N ) log
p ( x1 ,..., x N ) , q ( x1 ,..., x N )
(1)
where edges between two nodes in the tree are weighted by the MI of their corresponding random variables, defined as follows:
100
Gruber and Ben-Gal
I ( X i , X j ) p ( x i , x j ) log xi , x j
p ( xi , x j ) p ( xi ) p ( x j )
.
(2)
Chow and Liu [4] also proposed an algorithm (we shall refer to it henceforth as the CLA) based on their weighting approach. Williamson [14] implemented his straightforward generalization to a BN, simply by replacing the single parent variable X j with the set of parent variables Zi as follows: I ( X i , Zi )
x i X i , zi Z i
p ( x i , zi ) log
p ( x i , zi ) . p ( x i ) p (zi )
(3)
In a similar manner as Chow and Liu [4] used (2) as the MI weight within a Bayesian tree, Williamson [14] used (3) as the MI weight between a variable and a set of parent variables in a BN. Since (3) follows the MI chain rule, it is more complex - in the same sense that a BN is more complex than a Bayesian tree. 2.1. Unconstrained Learning-A Complete Network
In a complete BN, each node is connected to all the other ( N 1) nodes, resulting in a maximum total-weighted unconstrained BN. The total weight in the network is a fixed sum of conditional MI elements, while the edges’ directions are subject to the requirement that the graph must be a DAG. Note that there might be N ! possible complete BNs that would provide maximum total weighted BN. The total MI weight of a complete BN can be calculated as follows: N
I ( X i ; Z i ) I ( X1 ; X N ,..., X 2 ) I ( X 2 ; X N ,..., X 3 )... I ( X N 1 ; X N ).
i 1
(4)
The term in (4) can be then reorganized: N
N 1 N
i 1
i 1 j i 1
I ( X i ; Z i ) I ( X i ; X j X j 1 ,..., X i 1 ),
(5)
where ( X j 1 ,..., X i 1 ) if j i 1. Since MI is a symmetric measure, i.e., I ( A; B ) I ( B ; A) for any random variables A and B, the total weight in (5) sums up to the same solution regardless of the starting point (i.e., regardless of the order of summation), despite the different elements comprising the total weight. The above understanding is of significant importance because it implies that the order of an unconstrained BN learning is irrelevant from the perspective of obtaining the total of the MI weights. For any set of variables A, B, C the conditional information I ( A; B C ) is also called the (conditional) information gain (IG) between B and A given C . Note that some edges might contribute a zero weight (where the IG is zero), hence, it is viable to remove them from the BN. 2.2. Constrained Learning
We start by referring to two specific constraints mentioned by Williamson [14]. The constraint C1 is imposed on K , the maximum number of parents for each node. The constraint C 2 is imposed on k, the complexity of a BN, where k ( N K 1)2 K 1 for binary nodes (of two states). The above expression implies that constraining the complexity is
Efficient Bayesian Network Learning for System Optimization
101
an alternative way for limiting the number of parents. Upon that, we suggest two additional information-related constraints C 3 and C 4 related to the percentage relative IG (PRIG) and the percentage relative information exploitation (PRIE) measures, respectively. C 3 is imposed on a minimum required PRIG (by the user-adjusted parameter ) and C 4 is imposed on the maximum PRIE (by the user-adjusted parameter ). For any given variable X X, with parent variables set Z X, and a set of candidate variables Z X, C 3 can be expressed as C 3 I ( X ; Z Z ) / H ( X ) 100 and C 4 can be expressed as C 4 I ( X ; Z ) / H ( X ) 100 . The range of as well as of is [0-100]. 0 implies that any feasible edge could be drawn from each potential parent, except for those contributing zero weights, whereas 100 implies that the current node will not have any parents. 0 implies that the current node will not have any parents and 100 implies that any feasible edge could be drawn from each potential parent, except for those contributing zero weights. The PRIG can be considered as a sort of a derivative of the PRIE. Both constraints are essential for reasonably controlling the complexity as they represent its scale and shape altogether. Note however that the selection is ordered by the relative information gain, and not arbitrarily as done by the conventional constraints C1 and C 2 . Consider the MI between a random variable X i X and a set of variables Zi X representing its parents. The MI can be obtained using the chain rule of information as follows: Li
I ( X i ; Zi ) I ( X i ; X i j X i1 ,..., X i j 1 ). j 1
(6)
Given I ( X i ; Zi ), if one considers to add another parent Vi Li 1 to Vi in G ( V, E ), representing the variable X iLi 1 X, then the MI between X i and Zi X iLi 1 should take the following form: I ( X i ; Zi X iLi 1 ) I ( X i ; Z i ) I ( X i ; X iLi 1 Z i ).
(7)
The IG between X i and X iLi 1 given Zi , is the marginal information gained upon adding the node X iLi 1 to Di , the parents set of the node Vi . Since Chow & Liu [4] considered only Bayesian trees ( K max i ( Li ) 1), they did not address the information chain rule. In their search procedure they focused on finding the largest MI measure between each of the remaining nodes and the nodes already populated within the tree. In a tree, only the first component of the MI in the chain, i.e., I ( X i ; X iLi 1 ) is considered i 1,..., N . Moreover, the greedy search of the CLA ascertains a tree with maximal total weight, because it covers all possible edges. However, such an approach would not hold in the considered realm of BNs, where multiple parents are available. Williamson [14] did consider the IG of each and every edge while maximizing the total information weight within the BN. To assure a network with a maximal total weight, one has to search all possible sets of parents for each node, raising the complexity of the problem up to a level of computational intractability in larger networks. As a practical solution, Williamson [14] suggested the adding-arrows learning algorithm. The adding-arrows can be seen as a generalization to the CLA by replacing the scoring information quantity I ( X i , X j ) with the conditional information quantity I ( X i , X j Z i ) and ensuring at each stage that the set of constraints C {C1 , C 2 ,...} still holds and the graph remains a DAG. As seen below we propose a somewhat similar approach.
102
Gruber and Ben-Gal
3. A Small Illustrative Example Consider the “toy” example in Table 1. Here, X {X1 , X 2 , X 3 , X 4 } and the dataset contains twelve instances of X. The adding-arrows algorithm, when applied in this example, yields an unconstrained BN as shown in Figure 1. Each node is depicted by a circle, labeled by the corresponding variable name. The arrows depict the edges, each attributed alongside by its IG expression and weight. Table 1. Illustrative Example of data. Case 1 2 3 4 5 6 7 8 9 10 11 12
X1 1 1 1 1 1 1 2 2 2 2 2 2
X2 1 1 1 2 2 2 2 2 2 2 2 2
X3 1 2 2 2 2 2 1 1 1 2 2 2
X4 2 2 2 3 3 3 1 1 1 1 1 1
Figure 1. An unconstrained Bayesian network learned by the adding-arrows algorithm applied to the small dataset in Table 1.
According to (5), and as long as the graph remains a DAG, the location of each variable in the network is unimportant when the purpose is encoding the joint probability distribution. The fact that X 4 , for example, depends on X 3 and not the opposite can be simply reversed by using Bayes’ rule. That is, in the above example, one could reverse the edge E X 3 , X 4 (replacing it with E X 4 , X 3 ) and update the probability sets in accordingly. For illustration purposes, suppose now that variable X 3 is defined as a target variable that should be optimized. The proposed algorithm, which is presented in Section 4, draws one edge at a time, i.e., the one for which IG weight is the largest. The process is detailed in Table 2. Having started with X 3 as the target variable, an edge from X 4 to X 3 is drawn, gaining 0.189 bits of information. Next, since no information is gained if X 1 or X 2 are added to X 3 conditioned on X 4 , no other parents are added since the stopping condition is
Efficient Bayesian Network Learning for System Optimization
103
satisfied. The same routine is applied then to each parent of X 3 in turn (only to X 4 in the current example). The first parent added to X 4 is X1 (having an IG weight of 1 bit in this case) and the second parent is X 2 . Since adding an edge from X 2 to X 4 is conditioned on X 1 , the edge’s weight is 0.5 bits (rather than 0.811 bits when applying the adding-arrows). Finally, and in the same manner, an edge is drawn from X 2 to X1. The BN structure that was learned by the proposed algorithm from the data in Table 1 is shown in Figure 2 where the node representing the target variable is bold. Table 2. Information gain weights of each possible edge between the potential parents and the current learned node, given its existing parents. Potential Parents NodeExisting Parents
X1
X2
X4
X3
0.093
0
0.189
X3 X 4
0
0
X4
1
0.811
X 4 X1
0.5
X1
0.311
Figure 2. An unconstrained Bayesian network learned by the proposed algorithm applied to the small dataset in Table 1.
As expected, the total information weight of the unconstrained BN, learned by the proposed algorithm, which is i41 I ( X i , Z i ) 0.189 1 0.5 0.311 2 bits is equal to the one obtained by Williamson’s adding-arrows algorithm, which is also i41 I ( X i , Z i ) 1 0.811 0.189 2 bits. These BNs are only two out of 4! 24 possible complete networks, each of which would yield a maximum total weight (of 2 bits in the current example). Note that an unconstrained BN must contain all N ( N 1) / 2 possible edges. Nonetheless, for the reader’s convenience, the zero weighted edges are not displayed in the figure. Let us consider now the conventional constraint C1 proposed byWilliamson and limit the number of parents to one ( K 1). Figure 3 and Figure 4 show the results obtained by the
104
Gruber and Ben-Gal
adding-arrows algorithm and by the proposed algorithm respectively, both with K 1. The total information weight ascribed to the BN learned by the adding-arrows is 1.811 bits, about 6% less than that of the unconstrained BNs in Figure 1 and Figure 2. This result can be compared with the 1.5 bits obtained by the proposed algorithm under C1 , that is 25% less than the unconstrained BN. Note that although the total weight of the BN shown in Figure 4 is smaller, the proposed algorithm fulfills its objective - to maximize the information on the target variable.
Figure 3. A Bayesian network learned by the adding-arrows algorithm applied to the dataset in Table 1 with a constraint of a single parent per node, K 1.
Figure 4. A Bayesian network learned by the proposed algorithm applied to the dataset in Table 1 with a constraint of a single parent per node, K 1.
Notwithstanding, the outstanding consequence of the BN shown in Figure 3 is that the target variable X 3 is not connected to any other variable. Since X 3 has relatively small information about the rest variables, it is excluded from the tree. Here is where the profound gap comes in. While the result shown in Figure 3 would be satisfying for Williamson’s [14] and Chow’s & Liu’s [4] common objective, it displays an undesirable outcome for the proposed objective. Our objective in this case is to maximize the information about the target variable X 3 via other variables which comprise the entire joint distribution. Figure 3 emphasizes that the method proposed by Williamson [14] does not satisfy such a requirement efficiently.
Efficient Bayesian Network Learning for System Optimization
105
4. Proposed Algorithm Our underlying assumption in this study is that a target variable X1 X is given, and that we aim to best approximate the probability distribution p ( X i ) using the law of complete probability with respect to the entire domain. Namely, we wish to represent the expression shown in (8) with an approximation shown in (9).
p ( X i ) p ( X i xiC ) p ( xiC ),
(8)
q ( X i ) p ( X i zi ) p (zi ),
(9)
x iC XCi
zi Zi
where x C denotes the atomic states of XCi X \ X i and zi denotes a state of Z i XCi , the set of variables representing the parents of X i in the BN. Aiming at minimizing d ( p q ) for p in (8) and q in (9), we consider two steps. In the first step we aim to find the set Z i XCi such that I ( X i ; Zi ) is maximized. In the second step we apply Williamson’s [14] method and attempt to maximize the sum of information weights only within Z i XCi instead of within the entire domain X. Finally, Min(d ( p ( X i ) q ( X i ))) is approximated by the following stages 1. Z i arg max Z X C ( I ( X i ; Z )). i
2. Max( X j Zi I ( X j ; Z j )). Thus, in the first stage we look for the parents’ subset of the target variable that maximizes the information about the target variable. In the second stage we maximize the sum of information weights within the parents subset, as shown in (5) by Williamson for the entire domain. The above approximation is of significant importance as it implies that large amount of data can be filtered out while learning, when the objective is the optimization of a given target variable. We also suggest constraining the network differentially. Let us redefine the constraints as C tj - the j -th constraint applied to the target variable and C rj - the j -th constraint applied to the rest of the variables (referred to as “attributes” in classification problems). Let us also compute the complexity for the general case. Recall that if variable X j takes one out of x j values, then the complexity in terms of the number of independent parameters is expressed, as follows: N
Ki
i 1
j 1
k ( x i 1) x j .
(10)
Equation (10) is free of the assumption of binary nodes, as it quantifies the complexity of variables with multiple states. Our proposed algorithm handles two options of representations, that follow from the above mentioned stages. They are similar with respect to stage 1, but are different with respect to stage 2. The first algorithmic option maximizes X j XCi I ( X j ; Z j ) and will be referred to as the Extended-Family representation. The second option maximizes X j Zi I ( X j ; Z j ) and will be referred to as the Nuclear-Family representation. Our proposed algorithm employs a recursive procedure that can be applied on any given node at a time, and with any set of potential parents. The procedure adds edges from candidate nodes to the node to which the
106
Gruber and Ben-Gal
procedure is currently applied-each time an edge, for which IG weight is the largest. The stopping condition for this procedure is the breaking of some arbitrary constraint C C (e.g., reaching the maximum number of parents) or when the set of candidate parents is empty. The procedure begins with the node representing the target variable (the target node). Having determined the target node’s parents, the same procedure is then applied to each one of the parents in turn, obtaining each parent’s ancestors and so forth. The candidate parents at each call of the procedure are subject to the algorithmic option of representation. In the case of the Extended-Family option, all nodes, excluding those which might break the DAG, are candidates as ancestors and the remaining ancestors are being looked for also outside the parents of the target variable. In the case of the Nuclear-Family option, only the parents of the target node are candidates as ancestors. The Nuclear-Family ends up with a BN in which all nodes are connected to the target node and among themselves up to a level controlled by the constraints. A flow chart of the proposed algorithm, with X as the target variable and X as the variables domain, is given in Figure 5.
Figure 5. A flow chart of the proposed subroutine, taking a differential set of constraints C {C t , C r }, which is a function of hold and hnew and is regarded “true” if it is satisfied or false otherwise. The constraints may include (but are not limited to) the maximum number of parents; the maximum number of children; and . Note that the input parameters and are applied through C 3 and C 4 . T represents the set of nodes, representing the candidate variables remaining either from the entire domain (the case of the Extended-Family mode) or from the parents of the current node that represents the variable as the current argument of the procedure (the case of the Nuclear- Family mode).
Efficient Bayesian Network Learning for System Optimization
107
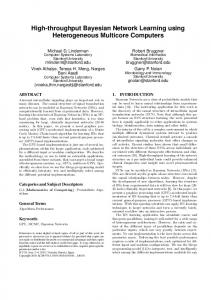
5. A Communication System Case Study In this section we present an implementation of a realistic example. The example data is taken from a simulation of an operating communication system, supplied by spare parts of different types, each of which has a turnaround time upon failures (Dubi [6]). A reliability block diagram (RBD) of the system is shown in Figure 6 displaying redundancy. The first line comprises the power supply units (components 1, 4, 7), the second line comprises transmitters (components 2, 5, 8) and the third line comprises modems (components 3, 6, 9). The right-hand module of the RBD is a ‘Line’ module representing the wiring of the system (components 10, 11). The failure distributions of the components in this example are Exponential. The mean time to failure (MTTF) and the recycling times of the unit types are presented in Figure 6. The ‘Line’ components are discarded. Namely, upon failure, they are not shipped to the repair depot and can be replaced only with new spare parts that were purchased and allocated for it in advance (in other words, their cycling time is infinity). Also, at least two of the series on the left-hand side of the system must operate for the system to function properly.
Figure 6. The RBD of a communication system with the components’ failure and repair data and the cost of spares.
Upon failure, the failed component is taken from the system and is shipped from the field to a repair depot. Having been repaired, the component will return to the storage as an available spare part. If an old demand for a spare part is due at that time, it will be sent to the system for a replacement of a failed component. The time since failure to replacement is also referred to as the turnaround time. An illustration of the above described logistic cycle is given in Figure 7. Roughly speaking, the optimization problem arises from a competition of two objectives: maximizing performance versus minimizing the cost of spare parts or other system resources.
108
Gruber and Ben-Gal
Figure 8 illustrates a comparison among various optimization approaches of previous studies on a similar system, operating in a different logistic environment, which included multiple logistic levels and multiple fields, that apart from spare parts, are influenced by other resources, such as the number of workbenches. This figure, based on Gruber and Keane [7] presents uniformly distributed random samples of the system unavailability as a platform for applying Genetic Algorithms (GA) for optimization. The motivation was inspired by the independency of the GA approach of the physical model compared to other methods, that require information on the physical system. Figure 8 draws the density of the system unavailability over the resources space, scaling the resources mixture on the cost axis. The cost is sampled uniformly, by which spare parts and other resources are allocated. The corresponding resulting Pareto Front of the unavailability is compared with the unavailability accomplished by other optimization approaches. Each sample shown in Figure 8 is an outcome of a complete computer experiment (see Kenett and Zacks [10]) a Monte Carlo Simulation of a well-defined model that meets the definitions and descriptions of the above communication system.
Figure 7. Logistic cycle of the communication system LRUs.
Figure 8. A communication system unavailability as a function of the cost allocated for supporting the system’s performance (based on Gruber and Keane [7]).
Efficient Bayesian Network Learning for System Optimization
109
The input to our proposed BN learner was a flat database containing the states of all components, also known as ‘line replaceable units’ (LRUs), assembling the system along with the System state and the spare parts availability, held by four Stock variables (i.e., a stock per each LRU type). The System performance is defined as the target variable in this example, and is measured by the System availability that derives from its reliability and resources’ support. Since in this example the LRU variables are not considered as controllable variables, their inclusion in the BN is not really relevant for the optimization. The only controllable variables are the Stock variables, as they constitute the spare parts strategy supporting the communication system availability. The observations were sampled on a daily basis throughout 10 simulated years of operation. Figure 9 and Figure 10 show the BNs learned by the proposed algorithm in Extended-Family and in Nuclear-Family modes, respectively. Both BNs were constrained to comply with complexity levels associated with [ t 98%] and [ r 25%].
Figure 9. A Bayesian network supply chain of the communication system, as learned by the proposed algorithm in an Extended-family mode, constraints are set to [ t 98% and r 25%]. The complexity of the BN shown in Figure 9, obtained by (10) is k 131090. The complexity of the BN shown in Figure 10 is k 50 (thus, four orders of magnitude off!), displaying the tremendous difference between the two algorithmic modes. Figure 9 emphasizes how exhaustive computation can be wasted to no avail, should one attempts to learn a BN for optimization purposes without considering the constraints differentially, as proposed. While the information weight associated with the System variable remains the same, much information weight is reflected among the attributes, increasing the complexity: not only would it end up with an extremely complex BN, but also the learned BN might be inferior for optimization purposes than the one learned by the Nuclear-family mode. In this stage we study the complexity level as a function of t and r , going from minimum PRIG of 0% to some positive small fixed-values. This is preferable for illustration purposes, as it smoothes the complexity curve due to its exponential nature. Hence, we set fixed minimum
110
Gruber and Ben-Gal
PRIGs of [ t r 2%] . The resulting complexity of the BN model as a function of t and r is illustrated in Figure 11.
Figure 10. A Bayesian network supply chain of the communication system, as learned by the proposed algorithm in a Nuclear-family mode, constraints are set to [ t 98% and r 25%].
Figure 11. The complexity ( k ), as a function of t and r , i.e., the MaxPRIE about the target variable and MaxPRIE about the rest variables, which are applied through C 3 .
Efficient Bayesian Network Learning for System Optimization
111
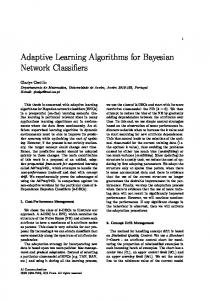
The dashed diagonal curve on top of the complexity surface designates the ‘traditional’ or conventional complexity trade-off, as a one-dimensional measure. The trade-off is executed between and the model complexity (as a scalar that controls the complexity without differentiating the target variable from the rest attributes) and creates a limited decision line. Along this line, two corresponding BNs are illustrated. Their locations can be regarded an outcome of a strategic decision. In each of these BNs, the bottom node, that is the System node, represents the target variable. One can see that along the diagonal curve, the BNs tend to be narrow, implying that the information is relatively exploited among all the variables, where few nodes are connected to the System node. Similarly, the K2 curve in Figure 11 demonstrates such limitation. Furthermore, the K2 algorithm does not consider information measures for constraining the BN and, therefore, its complexity curve does not form an information-based decision line. Through the differential outlook, where t and r are displayed orthogonally, the trade-off changes significantly, enabling a decision plane, rather than a decision line where all the variables are treated equivalently. It is clear from the graph that the complexity can be reduced remarkably, while maintaining a considerable level of the maximum target PRIE requirement. For example, the BN pointing to [ t 100%; r 0%] connects four LRU nodes to the System node, providing the maximal possible information for optimization with a complexity value of 39. This point is the end point of the [ r 0%] curve, referred to as the “Best Target” curve. In addition, three more curves with fixed r values are displayed: the [ r 30%] curve; the [ r 35%] curve; and the [ r 40%] curve. To illustrate the outcomes that can be learned from a BN, Figure 12 demonstrates some optimization considerations based on the trained network, with its stock controllable variables set to {1, 3, 1, 7}. This BN was learned by the Extended-family algorithmic mode enabling to represent the indirect influence of the Stock variables. To avoid a complex BN structure, such as the one shown in Figure 9, the minimum PRIGs were set to comply with t 2%; and r 5%.
Figure 12. Two assignments of a Bayesian network of a communication system supply chain, learned by the proposed algorithm in an Extended-Family mode, constrained to [ t 2% and r 5%] . The left-hand assignment shows the distribution of each variable, given that the System variable is in state “ x1 ” (an “available” state of the system). The right-hand assignment shows the distribution of each variable, given that the System is in state “ x 0 ” (an “unavailable” state of the system).
112
Gruber and Ben-Gal
Having learnt this BN, one can firstly notice that the dominant LRU variables affecting the target System variable are LRU1, LRU7, LRU10 and LRU11. Also, that LRU1 as well as LRU7 depend on Stock1, where LRU10 and LRU11 depend on Stock4. The average system availability with this setting is about 99%. Given that the system is unavailable, the dominant parent LRUs (i.e., LRU10 and LRU11) are failed, with a conditional probability of 54% and 65% respectively (taking the state “ x 0 ” in Figure 12). Given the conditional state distribution of LRU10 and LRU11, the distribution of Stock4 changes such that there is a shortage of spare parts with a probability of 78% compared with a conditional probability of 5% when the system is available. This observation can suggest on increasing the number of spare parts in stock number 4. Indeed, running a simulation study with a stock setting of {1, 3, 1, 8}, increases the average availability to nearly 99.9%. Note that the cost of the added spare part is the cheapest among other parts in this example. Although we do not discuss here the optimization trade-off between unavailability costs and stock costs, this example displays the means by which such a desired optimization can be processed, as the above BN incorporates all the sufficient information for carrying it out.
6. Summary Bayesian networks are predominant modeling methods when dealing with large systems that involve and can supply large amounts of data. The drawback of modeling based on large datasets is often the required modeling complexity. There exist several methods that tackle this issue. This paper continues a line of previous works, as it suggests a practical approach, for better a complexity control, by distinguishing between the target variable versus other variables in the system. This enables the distinction of the required complexity for understanding what affects a target variable, as opposed to general complexity measures that are irrelevant to the target variable. In this work, we present a new algorithmic approach, which efficiently tackles the complexity issue. Accordingly, the algorithm aims at maximizing the information between the target variable and the relevant domain variables (attributes) and subsequently it maximizes the information weights among these variables. Through a realistic example, it was illustrated, how the proposed algorithm handles well the trade-off between information measures and complexity when learning a BN from a large dataset that was generated by computer experiments. In particular, measuring the complexity differentially is suggested, stressing the ability to reduce the complexity remarkably while maintaining most of the essential information for performing the desired optimization. Note that the proposed algorithm is not limited to data bases related to systems engineering, and can potentially address various types of applications with different objectives.
Acknowledgements This research was supported by THE ISRAEL SCIENCE FOUNDATION (grant No. 1362/10).
References 1.
Ben-Gal, I. (2007). Bayesian Networks. Encyclopedia of Statistics in Quality and Reliability, F. Ruggeri, F. Faltin and R. Kenett (eds.), John Wiley & Sons.
2.
Cheng, J. and Greiner, R. (2001). Learning Bayesian belief network classifiers: algorithms and
Efficient Bayesian Network Learning for System Optimization
113
system. Lecture Notes in Computer Science, 141-151. 3.
Chickering, D. M. (2002). Optimal structure identification with greedy search. Journal of Machine Learning Research, 3, 507-554.
4.
Chow, C. K. and Liu, C. N. (1968). Approximating discrete probability distributions with dependence trees. IEEE Transactions on Information Theory, 14(3), 462-467.
5.
Cooper, G. F. and Herskovits, E. (1992). A Bayesian method for the induction of probabilistic networks from data. Machine Learning, 9, 309-347.
6.
Dubi, A. (2000). Monte Carlo Applications in Systems Engineering. John Wiley & Sons.
7.
Gruber, A. and Keane, A. J. (2006). Optimisation of System Resources in Reliability Availability & Maintainability Problems Using Genetic Algorithms, in 16th International Mirce Symposium, Mirce Akademy, Exeter, UK.
8.
Heckerman, D. (1995). A Tutorial on Learning with Bayesian Networks. In Learning in Graphical Models, M. Jordan (eds.). MIT Press, Cambridge, MA, 1999.
9.
Heckerman, D., Geiger, D. and Chickering, D. M. (1995). Learning Bayesian networks: The combination of knowledge and statistical data. Machine Learning, 20, 197-243.
10. Kennett, R. and Zacks, S. (1998). Modern Industrial Statistics: Design and Control of Quality and Reliability. Boston: Duxbury Press. 11. Pearl, J. (1988). Probabilistic Reasoning in Intelligent Systems: Networks of Plausible Inference. Morgan Kaufmann: San Francisco. 12. Pearl, J. (2000). Causality: Models, Reasoning, and Inference. University Press: Cambridge. 13. Spirtes, P., Glymour, C. and Scheines, R. (2000). Causation, Prediction and Search. 2nd edition, MIT Press. 14. Williamson, J. (2000). Approximating Discrete Probability Distributions with Bayesian Networks, in Proceedings of the International Conference on Artificial Intelligence in Science and Technology, 16-20 December: Hobart Tasmania. 15. Yehezkel, R. and Lerner B. (2009). Bayesian network structure learning by recursive autonomy identification. Journal of Machine Learning Research, 10, 1527-1570. 16. Zacks, S. (1966). Sequential estimation of the mean of a log-normal distribution having a prescribed proportional closeness. The Annals of Mathematical Statistics, 37, 1688-1696. 17. Zacks S. (1992). Introduction to Reliability Analysis: Probability Models and Statistics Methods. Springer-Verlag, New York. 18. Zacks, S. (2004). Distributions of Failure Times Associated with Non-Homogeneous Compound Poisson Damage Processes, Lecture Notes-Monograph Series, 45, A Festschrift for Herman Rubin, 396-407. Authors’ Biographies: Aviv Gruber is a doctoral student, under the supervision of Professor Irad Ben-Gal, in the Department of Industrial Engineering at Tel Aviv University. His research combines applications from Machine Learning and Information Theory. The research is focused on Bayesian network learning, mainly for optimization purposes in industrial and service systems. Aviv is a B.Sc. (2000) and an M.Sc. (2003) in Nuclear Engineering from Ben-Gurion University of the Negev. He has 8 years experience in Modelling & Simulation of complex systems as a consultant and a senior tutor, and as an algorithms developer. During his studies, Aviv is teaching a mandatory course for undergraduate students in the Computer Integrated Manufacturing (CIM) Laboratory. Aviv's work awarded first prize at the IE & M 2010 for an outstanding research work.
114
Gruber and Ben-Gal
Irad Ben-Gal is an Associate Professor and the head of the CIM Lab in the Department of Industrial Engineering at Tel Aviv University. His research interests include statistical methods for control and analysis of stochastic processes; Applications of Information Theory to industrial problems; Machine Learning and Automation and Computer Integrated Manufacturing systems. He holds a B.Sc. (1992) degree from Tel-Aviv University, M.Sc. (1996) and Ph.D. (1998) degrees from Boston University. He is a member of the Institute for Operations Research and Management Sciences (INFORMS), the Institute of Industrial Engineers (IIE), The European Network for Business and Industrial Statistics (ENBIS) and an elected member in the International Statistical Institute (ISI). He is a Department Editor in the IIE Transactions on Quality and Reliability and serves in the Editorial Boards of several other professional journals. He wrote and edited five books, published more than 70 scientific papers and received several best papers awards. His papers have been published in IIE Transactions, International Journal of Production Research, Technometrics, IEEE Transaction, Quality and Reliability Engineering International, Journal of Statistical Planning and Inference, as well as Bioinformatics and BMC Bioinformatics. Prof. Ben-Gal supervised dozens of graduate students and received several research grants, among them from General Motors, IEEE, the Israeli Ministry of Science and the European Community.