Jun 5, 2001 - Abstract. A method based on canonical correlation analysis (CCA) for solving the blind source (BSS) problem is presented. In contrast to ...
A Canonical Correlation Approach to Blind Source Separation Magnus Borga, Hans Knutsson Dept. of Biomedical Engineering Link¨oping University University Hospital SE-581 85 Link¨oping Sweden June 5, 2001 Abstract A method based on canonical correlation analysis (CCA) for solving the blind source (BSS) problem is presented. In contrast to independent components analysis (ICA), the proposed method utilises the autocorrelation in the source signals. This makes the BSS problem easier to solve than if only the statistical distribution of the sample values is considered. Experiments show that the method is much more computationally efficient than ICA. The proposed method can be seen as a generalization of the maximum autocorrelation factors (MAF) method.
1
Introduction
The blind source separation (BSS) problem is formulated as follows: Given an unknown linear mixture of a set of unknown, statistically independent signals, the goal is to estimate the mixing matrix and recover the original signals. The mixture can be written as: x(t) = As(t), (1) where A is the unknown mixing matrix and the components in s are the statistically independent source signals. The goal is then to estimate a matrix W such that y(t) = Wx(t) (2) is equal to the unknown source signals in s (except for scalings and permutations). In recent years, methods based on information theoretical measures such as mutual information has gained a lot of interest. Such methods try to minimize 1
the statistical dependence between the reconstructed signals. Measuring statistical dependence is, however, in general not possible and other related objectives has to be used as approximations. One such method that have gained much attention is independent components analysis (ICA). It was introduced by Comon [3] and many articles has been published on the subject. Instead of minimizing the statistical dependence between the reconstructed signals, ICA tries to make the signals as non-Gaussian as possible. In many practical situations this also reduces the statistical dependence and ICA often give a very good result. Here we present an alternative method that generates uncorrelated components. To look for uncorrelated components means that we use a weaker condition than statistical independence. There are several ways of choosing W so that the components in y are uncorrelated, but most of them will not give statistically independent components. One of the most well known methods of generating uncorrelated components i principal component analysis (PCA). PCA is, however, in general unlikely to solve the BSS problem. A weakness with PCA, which also applies to ICA, is that temporal correlations (or spatial correlations in images) are not taken into account. In both PCA and ICA the samples in time (or spatial position) may be rearranged arbitrarily and the method will still give the same solution. This may seem as a strength, but the fact is that almost all the information in the signal is thrown away. This makes the problem more difficult then it needs to be. As an example, suppose that two images are added together. It is perhaps difficult, but not at all impossible, to see what the original images look like. Now imagine that all pixels in images are permuted randomly. It would now be impossible to see what the original images look like. In practice most, if not all, signals have a certain auto-correlation. This means that si (t) and si (t + 1) are correlated while si (t) and sj (t) are uncorrelated (since they are statistically independent). This autocorrelation can be used to solve the BSS problem. Hence, if we want to use correlation instead of statistical dependence as a criterion for solving the BSS problem we must find uncorrelated components that, in addition, have maximum spatial or temporal correlation within each component. This can be achieved by canonical correlation analysis (CCA). A similar approach is called maximum autocorrelation factors (MAF) [8] and has successfully been used to analyse multi-spectral satellite images [7]. While MAF maximizes the autocorrelation for a pre-specified displacement vector, our approach automatically selects the optimum weighted combination of displacement vectors. Here we also have a more direct connection to CCA, which is an established statistical technique. There is a similarity between ICA and CCA in that both can be explained in terms of mutual information. In the following section we give a brief description of CCA. In Section 3, we use the CCA formalism to describe the MAF approach and show under what condition it will solve the BSS problem. In Section 4 we introduce a generalization of the MAF method and show that the condition for solving the BSS problem in this case is weaker than for the MAF approach. Experimental results are presented in Section 5, where the proposed method is compared to 2
ICA computationally as well as regarding the results.
2
Canonical correlation analysis
CCA finds two sets of basis vectors, one in each signal space, such that the correlation matrix between the signals described in the new basis is a diagonal matrix. A subset of the vectors containing the N first pairs defines a linear rank-N relation between the sets that is optimal in a correlation sense. It has been shown that finding the canonical correlations is equivalent to maximizing the mutual information between the sets if the underlying distributions are elliptically symmetric [6]. Consider two multi-dimensional random variables, a and b. Consider the ¯ of the two variables a) and b = wbT (b − b), linear combinations, a = waT (a − ¯ respectively. The correlation between a and b is given by waT Cab wb
ρ= q
waT Caa wa wbT Cbb wb
.
(3)
where Caa and Cbb are the nonsingular within-set covariance matrices and Cab is the between-sets covariance matrix. The maximum of ρ with respect to wa and wb is the largest canonical correlation. A complete description of the canonical correlations is given by: �� � �−1 � � � � ˆa ˆ [ 0 ] Cab w λ w Caa [ 0 ] =ρ a a (4) Cba [ 0 ] w ˆb λb w ˆb [ 0 ] Cbb where:
ρ, λa , λb > 0 and λa λb = 1. Equation (4) can be rewritten as: C−1 ˆ b = ρλa w ˆa aa Cab w C−1 C w ˆb ba ˆ a = ρλb w bb
(5)
ˆ an , w ˆ bn }, n = {1..N }. N is the minimum Solving eq. (5) gives N solutions {ρn , w of the dimensionalities of a and b. ρn are the canonical correlations [4]. More details can be found in [1, 2].
3
BSS by maximum autocorrelation
Consider the case where the source signals in s is a set of one-dimensional signals, e.g. time signals, s(t). The simplest way of using CCA for separating the mixed signals x(t) is to find the linear combination of x(t) that correlates most with a linear combination of x(t + 1), i.e. the next sample. In other words, we let a(t) = x(t) and b(t) = x(t + 1).
(6)
The first canonical correlation component will then give a linear combination y1 (t) of the mixed signals with maximum autocorrelation ry1 (1). The second 3
canonical correlation component will give a new linear combination y2 (t) with maximum autocorrelation ry2 (1) under the constraint that it is uncorrelated to the first component, etc. In the case of a two-dimensional source signals, e.g. images, s(m, n), it is not that obvious how to choose a and b. In the MAF approach a(t) = x(m, n) and b(t) = x(m + ∆m, n + ∆n)
(7)
where (∆m, ∆n) must be chosen a priori by the user [7]. A CCA on this data would maximize the auto correlation r(∆m, ∆n). A slightly more general approach would be to choose a(t) = x(m, n) and b(t) = q(x(m, n))
(8)
where q(x(m, n)) is the result of a convolution between x(m, n) and a filter that is close to circular symmetric and which have a zero in the center of the kernel. This would remove the directional bias in eq. (7). However, the selection of the filter kernel is still to be decided by the user. Another potential disadvantage with the latter method is that the correlation is maximized between a single pixel and a low-pass filtered version of its surrounding. This means that we try to maximize the correlation between two different frequency bands, which is probably not an optimal approach in general. The method described above chooses the components so that the autocorrelation is maximized. Now, why is that a relevant criterion? Intuitively, it can be explained as follows: If we have two uncorrelated signals, u(t) with high autocorrelation and v(t) with low autocorrelation, the sum x(t) of these signals will have less autocorrelation than the original signal u(t). We can see it as if the addition of v(t) has corrupted u(t), making it harder to predict. More formally we can say that the sum of uncorrelated signals will have an autocorrelation function that is less than or equal to the maximum of the autocorrelation functions of the individual signals, i.e. rx (d) ≤ max{rsi (d)}
(9)
with equality only when all the autocorrelation functions are equal, i.e. rsi (d) = rsj (d)
∀i, j.
rx (d) is the autocorrelation function of the sum of the individual signals si . To prove eq. (9), we look at the special case of two source signals. The generalization to more than two signals is straight forward. Consider two uncorrelated signals u(t) and v(t) with zero mean. The autocovariance function of the sum x(t) of the two signals is cx (d) = F −1 [F[x]F[x0 ]] = F −1 [F[u + v]F[u0 + v 0 ]] = F −1 [(F[u] + F[v])(F[u]F[v 0 ])] = F −1 [F[u]F[u0 ] + F[v]F[v 0 ] + F[u]F[v 0 ] + F[v]F[u0 ]] | {z } | {z } =0
= cu (d) + cv (d) 4
=0
(10)
where F is the Fourier transform and x0 (t) = x(−t). The autocorrelation function (i.e. the normalized autocovariance function) is then rx (d) =
cu (d) + cv (d) cu (0)ru (d) + cv (0)rv (d) cx (d) = = cx (0) cu (0) + cv (0) cu (0) + cv (0)
(11)
which cannot be larger than the maximum of ru (d) and rv (d). In fact, eq. (11) shows that the autocorrelation function of the sum is the weighted average between the autocorrelation functions of the sources. The weighting coefficients cu (0) and cv (0) are estimates of the variances of u(t) and v(t) respectively. The conclusion is that if the sources are uncorrelated and have different autocorrelations r(d) for a certain d, then the CCA between the mixture x(t) and x(t + d) will indeed find the original source signals, except for scalings and permutations.
4
BSS by maximum canonical correlation
A problem with the maximum autocorrelation approach is that it maximizes the autocorrelation for a specific distance d, which must be specified a priori. If the autocorrelation functions for the source signals are equal for that particular choice of d, the method will fail. A more general and robust method is to let the CCA choose, not only the optimal combination of channels, but also optimal filters within each channel. This means that instead of maximizing the correlation between a sample and a neighbouring sample, the CCA now maximizes the correlation between a sample and a linear combination of a neighbouring (but not overlapping) region of the signal. Again, consider the case where the source signals is a set s(t) of onedimensional signals si (t). We then let a(t) = x(t)
and
b(t) = (x(t + 1), ..., x(t + N ))T
(12)
This is an auto-regressive model, i.e. the CCA will find mutually uncorrelated components where the components are optimal with respect to auto-regression error. This is more general than the method in eq. (6). A simple example will show that: Consider the case where s1 (t) = sin(tπ/2). The autocorrelation r(1) for such a signal is � �� � � � � �� � � � tπ π tπ tπ tπ + sin = E sin cos = 0, r(1) = E sin 2 2 2 2 2 i.e. the method in eq. (6) would not work for d = 1. The auto-regressive model in eq. (12) with N ≥ 2 would however find a high correlation (-1) between s(t) and s(t + 2). In order to see how the canonical correlation approach can find one of the source signals, we look again at the special case of two uncorrelated signals u(t) and v(t) such that their autocorrelation functions ru (d) and rv (d) differ for at 5
least one value of d ≤ N . Consider the two signals a(t) = waT a(t)
and
b(t) =
N X
zi a(t + i).
i=1
Here we have assumed that the optimal de-mixing vector for each channel is equal for all samples in time. The coefficients zi are the coefficients weighting together the different samples in time. The correlation between these two signals is hP i N E z a(t)a(t + i) i=1 i E[a(t)b(t)] = ρ(a, b) = p 2 2 σa2 E[a (t)]E[b (t)] (13) PN PN T z E [a(t)a(t + i)] z c (i) c z i i a a = i=1 = i=1 2 = σa2 σa σa2 The coefficient vector z that maximizes this correlation is the solution to the auto-regression problem of a(t + i) on a(t). This solution is given by z = C−1 a ca
(14)
where Ca is the autocovariance matrix, i.e. Ca (i, j) =
N 1 X a(i)a(j). N
(15)
k=1
This means that the correlation in eq. (13) can be written as C−1 a ra ρ(a, b) = σa2
�T
ca
=
cTa C−1 a ca = rTa R−1 a ra σa2
(16)
where Ra = Ca /σa2 and ra = [ra (1), . . . , ra (N )]T . From eq. (11) we see that we can write the autocorrelation function ra as ra = cru + (1 − c)rv where ru and rv are the autocorrelation functions for the original signals u(t) and v(t) respectively. This means that we can write the correlation as ρ(a, b) = (cru + (1 − c)rv )T R−1 a (cru + (1 − c)rv ) 2 T −1 −1 = c2 rTu R−1 a ru + (1 − c) rv Ra rv + 2c(1 − c)ru Ra rv
(17)
since R−1 a is symmetric. To find the maximum of the correlation we look at the second derivative of the expression in eq. (17) with respect to the mixing factor c: ∂2ρ T −1 T −1 = 2(rTu R−1 (18) a ru + rv Ra rv − 2ru Ra rv ) ∂c2 6
From eq. (15) we see that Ca is positive definite and, hence, so is R−1 a . Therefor we can write 1 0T 0 whre r0 = R− /2 r. rT R−1 a r=r r This means that ∂2ρ T T T = 2(r0 u r0u + r0 v r0v − 2r0 u r0v ) = 2kr0u − r0v k2 > 0 (19) ∂c2 if ru 6= rv , which means that the correlation has it’s maximum for c = 0 or c = 1, i.e. when a(t) = u(t) or a(t) = v(t). Since the CCA maximizes the correlation, we can make the conclusion that it will not choose a mixture of the source signals, since that would give less correlation than if one of the source signals is chosen.
5
Experimental results
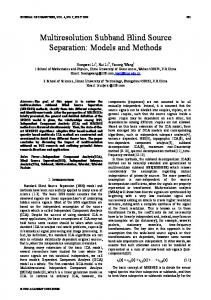
In this section we present some experimental results illustrating the performance of the proposed method. The experiments are done using Matlab on a Sun Ultra 10. For the comparison with ICA, the FastICA algorithm [5] has been used with default parameter settings. The FastICA algorithm is claimed to be “10-100 times faster than conventional gradient descent methods for ICA”. The first experiment illustrates that the CCA approach and ICA give qualitatively the same results. Figure 1 shows the source signals, which are a sine wave function and Gaussian noise (top left) and a mixture of the sources (top right). The lower panel shows the results form the CCA approach and ICA respectively. In this experiment, only one time step has been used for the CCA, i. e. the maximum autocorrelation approach was used. The second experiment illustrates the difference in computational efficiency between the CCA approach and FastICA. The mixed signals in this case are five EEG channels (Figure 2). We can see that the results from CCA (Figure 3) and ICA (Figure 4) are qualitatively similar. Also in this experiment the maximum autocorrelation approach was used. The computational cost, however, differed significantly. The FastICA algorithm needed 27 Mflops, and 3.8 seconds, while the CCA approach needed 6.8 Mflops, and 0.39 seconds on the Ultra 10 work station. The final experiment illustrates the difference between the MAF approach, i.e. CCA with only one time step in the b-variable, and the more general CCA approach with more than one time step. Figure 5 shows the result when the two source signals were sin(tπ/2) and white noise respectively. The one-time step CCA (MAF) fails to recover the source signals, wile the two-time steps CCA manage to recover the sources.
6
Summary and discussion
In many practical situations, the ICA algorithm makes the BSS problem unnecessarily difficult. By only considering the statistical distribution of the sample 7
s
x
4
4
2
2
0
0
−2
−2
−4
0
50
−4
100
0
CCA 4
0.1
2
0
0
−0.1
−2 0
50
100
FastICA
0.2
−0.2
50
−4
100
0
50
100
Figure 1: A simple example showing the result of the proposed method compared to the “FastICA” algorithm.
values, ignoring the temporal or spatial relations within the source signals, relevant information is discarded. Most, if not all, natural signals have temporal or spatial relations, causing an autocorrelation in the signal. Canonical correlation analysis can solve the BSS problem with much less computational effort than the ICA algorithm by utilising the autocorrelation functions of the source signals. A necessary condition for the CCA approach to work is that the source signals have different autocorrelation functions. The method of Maximum autocorrelation factors (MAF) is a special case of the CCA approach, maximizing the autocorrelation in the reconstructed source signals for a particular distance d. In this paper a more general approach has been presented that adaptively finds the optimum filter to be applied to maximize the correlation within the signal. Hence, the method does not depend upon the a priori choice of d.
8
Figure 2: Original EEG signals.
References [1] T. W. Anderson. An Introduction to Multivariate Statistical Analysis. John Wiley & Sons, second edition, 1984. [2] M. Borga. Learning Multidimensional Signal Processing. PhD thesis, Link¨ oping University, Sweden, SE-581 83 Link¨ oping, Sweden, 1998. Dissertation No 531, ISBN 91-7219-202-X, http://people.imt.liu.se/∼magnus/. [3] P. Comon. Independent component analysis, a new concept? Signal Processing, 36(3):287–314, April 1994. [4] H. Hotelling. Relations between two sets of variates. Biometrika, 28:321–377, 1936. [5] Aapo Hyv¨ arinen. Fast and robust fixed-point algorithms for independent component analysis. IEEE Transactions on Neural Networks, 10(3):626– 634, 1999. [6] J. Kay. Feature discovery under contextual supervision using mutual information. In International Joint Conference on Neural Networks, volume 4, pages 79–84. IEEE, 1992.
9
Figure 3: EEG signals decomposed using CCA.
[7] A. A. Nielsen, K Conradsen, and J. Simpson. Mulivariate alteration detection (MAD) and MAF postprocessing in multispectral, bitemporal image data: New approaches to change detection studies. Remote sens. environ., 64:1–19, 1998. [8] P. Switzer and A. A. Green. Min/max autocorrelation factors for multivariate spatial imagery. Technical Report 6, Department of Statistics, Stanford University, 1984.
10
Figure 4: EEG signals decomposed using ICA.
11
s
x
2
2
0
0
−2
−2 0
5
10
15
20
0
CCA − One time step 2
0
0
−2
−2 5
10
15
10
15
20
CCA − Two time steps
2
0
5
20
0
5
10
15
20
Figure 5: The results using one time step (MAF) or two time steps in the CCA method.
12