36
Int. J. Critical Infrastructures, Vol. 11, No. 1, 2015
A complex network approach for identifying vulnerabilities of the medium and low voltage grid Giuliano Andrea Pagani* and Marco Aiello Johann Bernoulli Institute, University of Groningen, Nijenborgh 9, 9747 AG Groningen, The Netherlands Email:
[email protected] Email:
[email protected] *Corresponding author Abstract: The vision behind the smart grid promises, among other things, to bring more attention to the lower layers of the distribution network where users are gradually transforming into prosumers. Independent of this transformation, users will expect the same (or higher) level of reliability of the infrastructure. In this paper, we consider physical samples from the Dutch medium and low voltage network and we perform a topological analysis to assess their robustness. We also analyse the robustness of synthetic topologies from the literature on complex network analysis. We note how certain topologies are more robust than others and how a small increase in network average connectivity can highly improve the resilience of the distribution grid against random and targeted attacks. Keywords: smart grid; distribution network; power grid vulnerability; complex network analysis; medium and low voltage network; critical infrastructures. Reference to this paper should be made as follows: Pagani, G.A. and Aiello, M. (2015) ‘A complex network approach for identifying vulnerabilities of the medium and low voltage grid’, Int. J. Critical Infrastructures, Vol. 11, No. 1, pp.36–61. Biographical notes: Giuliano Andrea Pagani received his BS and MS degrees in Computer Engineering from University of Parma, Italy, in 2004 and 2006, respectively, and MS in Corporate Management from M.I.P. Polytechnic of Milan, Italy, in 2009. He is currently working toward his PhD in Computer Science at the University of Groningen, The Netherlands. His research focuses on distributed energy generation with particular interest in the fields of complex network analysis, graph theory, smart grid technology, and renewable energy. Marco Aiello received his Engineering degree from the University of Rome La Sapienza, Italy, and PhD degree from the University of Amsterdam, The Netherlands. He was an Assistant Professor at the University of Trento, Italy, and a Lise Meitner Fellow at the Technical University of Vienna, Austria. He is currently a Professor of Distributed Information Systems at the Johann Bernoulli Institute, University of Groningen, The Netherlands. His research interests are smart energy systems, service-oriented computing, and spatial reasoning.
Copyright © 2015 Inderscience Enterprises Ltd.
A complex network approach for identifying vulnerabilities
37
This paper is a revised and expanded version of a paper entitled ‘A statistical analysis of power grid vulnerabilities’ presented at the 7th International Conference on Critical Information Infrastructures Security (CRITIS’12), Lillehammer, Norway, 17–18 September 2012.
1
Introduction
For infrastructure designers and engineers of the previous two centuries, energy was a natural monopoly and the most efficient way to operate the power system was through a hierarchical system with large generating facilities on top, and a pervasive network of cables to transport and distribute the energy to the geographically delocalised end users. Such a system called for management of the whole infrastructure by a monopoly or an oligarchy of actors. This manner of operating the electricity system together with burning fuels with predictable energy output (i.e., coal, oil, gas) have provided a reliable system where energy availability is taken for granted. However, limitations of this system become particularly apparent at both the household and country levels when energy provision is suddenly interrupted with serious consequences, like prolonged blackouts, compromised security, and, interruptions in economic output (Anderson et al., 2007). Thanks to technological advancements and the introduction of new regulations, there is potential for a radical change. From a technological perspective, new energy generation facilities (mainly based on renewable sources) are becoming widely accessible at industrial and local/residential level; from a communication perspective, the pervasiveness of the internet and data connections are basic achievements of the information and communication technology (ICT) sector. At the same time, a clear trend of market unbundling is emerging (e.g., Cossent et al., 2009) resulting in the addition of many new players to the energy sector with the possibility to produce, sell, and distribute energy. In such a scenario, new actors, such as those known as prosumers [who are both energy producers and consumers (Marnay and Venkataramanan, 2006)], are becoming relevant players. Local production and distribution of energy based on renewables, and digitalisation of the power infrastructure are pillars of what is referred to as the smart grid. The term smart grid is sometimes used to define the new scenario of a grid with a high degree of delocalisation in the production and trading of energy; however, this term does not yet have a unique and standard definition (Morgan et al., 2009). In this developing scenario, the main role of the high voltage grid may change, while the distribution grid (i.e., the medium voltage and low voltage end of the power grid) gains more and more importance. In fact, the energy interactions between prosumers will increase and most likely occur at a rather local level, and thus involve the low and medium voltage grids. We use a statistical approach that considers the lower layers of the distribution grid in order to study the grid vulnerability properties; in doing so, we consider global metrics from the field of complex network analysis. Similar analyses have been carried out in the past, but only for the backbone infrastructure (i.e., the high voltage grid). Further, following the findings of our previous work on how the distribution grid could evolve to accommodate distributed generation (cf. Pagani and Aiello, 2012), we analyse the robustness of synthetic topologies and we consider to what extent additional connectivity is beneficial for the robustness of the grid.
38
G.A. Pagani and M. Aiello
Here, we present a novel study of the resilience properties of the medium and low voltage networks using the northern part of the Netherlands as the data source, and we compare reliability aspects of these networks with the findings of other studies involving the high voltage grid. Moreover, we analyse the reliability of synthetic topologies that have proven to be valuable in representing some of the properties of technological and social networks that may be used in designs of future topological structures for the smart grid. In such a way, complex network analysis becomes not only a tool for analysing existing networks, but also a helpful way to design future topologies of the distribution infrastructure. This paper is organised as follows: Section 2 introduces complex network analysis and considers the adequacy of such a technique for evaluating power grid reliability issues. Section 3 presents key literature regarding power grid vulnerability for high voltage power grids. Our study of the Dutch medium and low voltage network follows in Section 4, while the investigation of the reliability of synthetic topologies is discussed in Section 5. Concluding remarks are provided in Section 6.
2
Complex networks and vulnerability analysis
2.1 Complex network analysis and applications Complex network analysis is a branch of graph theory, which is rooted in the early studies of Erdős and Rényi (1959) on random graphs and considers statistical structural properties of very large graphs. Although it is rooted in the past, complex network analysis is a relatively young field of research. The first systematic studies appeared in the late 1990s (Watts and Strogatz, 1998; Strogatz, 2001; Barabási and Albert, 1999; Albert et al., 2000); these studies evaluated properties of large networks that represented relationships of components of complex systems. Since then, complex network analysis has been used in many different fields of knowledge, from biology (Jeong et al., 2000) to chemistry (Doye, 2002); from linguistics to social sciences (Travers and Milgram, 1969); from telephone call patterns (Aiello et al., 2000) to computer networks (Faloutsos et al., 1999) and the web (Albert et al., 1999; Donato et al., 2007) to the spreading of viruses (Kephart and White, 1991; Colizza et al., 2007; Gautreau et al., 2008) to logistics (Latora and Marchiori, 2002; Guimerà and Amaral, 2004; Colizza et al., 2006); as well as inter-banking systems (Boss et al., 2004). Manmade infrastructures are interesting to study under the complex network analysis lenses, especially when they are large-scale infrastructures that grow in a decentralised and independent fashion. This evolution process is usually not the result of a global, but rather of many local autonomous designs. The power grid is a prominent example.
2.2 Power grid vulnerability analysis with complex networks The power grid is a real network which is characterised by physical constraints and physical laws. In a complex network analysis approach, the power grid networks are simplified compared to the infrastructure, and they are reduced to mathematical graphs where nodes represent substations of the network or transformers, and edges represent power lines. Several studies (e.g., Kim and Obah, 2007; Chassin and Posse, 2005) apply complex network techniques to the power grid in order to study the reliability of the high voltage grid. The reliability is evaluated by identifying the most connected nodes, the
A complex network approach for identifying vulnerabilities
39
probability disruption properties of the network and the key edges that keep the network connected. There is a debate about the optimal way to apply complex network analysis to investigate power grid vulnerability. Several studies have considered the network without physical parameters performing a pure topological study. Other vulnerability studies (e.g., Hines et al., 2010) have included comparisons between grid models that are solely based on topological properties and grid models that also take into account electrical/physical properties. The aim is to assess the goodness of topological analysis in power grid vulnerability problems. To date, there is no final acknowledgement as to the superiority of one approach over the other (i.e., purely topological versus topological metrics enriched with physical parameters). The simplicity of the topology-only analysis has the advantage of being extremely fast to compute and provides good overall indications. On the other hand, the analysis that includes metrics that are enriched with physical parameters is closer to reality and to traditional engineering modelling, which has a proven track record of success in power systems analysis and management.
3
Related work
The main motivation for the studies involving complex network analysis and power grids is to determine the resilience and vulnerability of the electrical infrastructure. In fact, the behaviour in terms of connectivity of the network is the primary research question when nodes or edges are removed, considering mainly random and targeted attacks. Table 1 shows various resilience analyses based on complex network analysis. In particular, the second column contains the metric that is used to assess the reliability of the network. The third and fourth columns concern the type of attack, whether on nodes and/or on edges. The fifth column indicates the proposed mitigation strategy for improving grid reliability. Table 1
Comparison of complex network analysis-based studies of resilience analysis and grid-reliability improvement Resilience analysis type
Node attack
Connectivity loss
9
Efficiency
9
Chassin and Posse (2005)
Loss of load probability
9
Holmgren (2006)
Influence on largest component size and path length
9
Rosas-Casals and Corominas-Murtra (2009)
Robustness through mean degree, motifs and patch size analysis
Rosas-Casals et al. (2007)
Influence on largest component size
9
Influence on largest component size: comparison with theoretical results
9
Work Albert et al. (2004) Crucitti et al. (2004)
Solé et al. (2008)
Edge attack
Grid improvement
9 9
40 Table 1
G.A. Pagani and M. Aiello Comparison of complex network analysis-based studies of resilience analysis and grid-reliability improvement (continued)
Work Crucitti et al. (2005) Rosato et al. (2007) Pagani and Aiello (2011)
Edge attack
Grid improvement
Damages and improvements
9
9
Nodes disconnection and improvements
9
9
Resilience analysis type
Influence on largest component size
Rosas-Casals (2010)
Reliability and disturbances
Bompard et al. (2010)
Unserved energy/load
Kim and Obah (2007)
Critical path length and clustering coefficient
Node attack
9
9
9
9 9
Hines and Blumsack (2008)
Sensitivity
Wang et al. (2010)
Influence on largest spanning cluster size
9
Loss of load and failure endurance
9
Avalanche size
9
Han and Ding (2011) Wang and Rong (2009) Dwivedi et al. (2010)
Flow availability
9
Bompard et al. (2009)
Efficiency, net-ability, overload
9
Hines et al. (2010) Brummitt et al. (2012)
Path length, connectivity loss
9
Overload, cascade effects, blackout size
9
9
Table 1 provides a general and schematic idea of complex network-based reliability analyses in the literature. One of our previous publications provides a more extensive analysis of previous complex network analysis-based studies of the power grid (Pagani and Aiello, 2013). The studies in Table 1 have some similarities and differences. All of the previous studies focused on the high voltage grid, including studies that used real samples and studies that used blueprint models [e.g., Institute of Electrical and Electronics Engineers (IEEE)-bus models]; the only exception to this is our previous work (Pagani and Aiello, 2011) that focused on the distribution grid. The studies in the table took place in various parts of the world: US grid (Albert et al., 2004; Chassin and Posse, 2005; Wang et al., 2010; Wang and Rong, 2009; Hines et al., 2010; Brummitt et al., 2012), Italian grid (Crucitti et al., 2004, 2005; Rosato et al., 2007), French and Spanish grids (Crucitti et al., 2005; Rosato et al., 2007), northern Dutch distribution grid (Pagani and Aiello, 2011), Scandinavian grid (Holmgren, 2006), entire European grid (Rosas-Casals and Corominas-Murtra, 2009; Rosas-Casals et al., 2007; Solé et al., 2008), and Chinese grid
A complex network approach for identifying vulnerabilities
41
(Han and Ding, 2011). Some works also took into consideration the synthetic models provided by IEEE that have often been used as guidelines to build actual electric infrastructures (Bompard et al., 2010; Kim and Obah, 2007; Hines and Blumsack, 2008; Wang et al., 2010; Dwivedi et al., 2010; Bompard et al., 2009; Hines et al., 2010). From a temporal point of view, almost all of the studies took place in the second half of the first decade of the new millennium; several of the studies indicated that the motivation for the research was the improvement in the knowledge and causes of blackouts, especially after big events that cut power in US (BBC, 2003b) and Italian (BBC, 2003a) grids. The evolution in the way that the analysis of the grid is performed is interesting to consider: the initial studies (e.g., Albert et al., 2004) concentrated solely on the topological structure of the grid without taking into consideration physical parameters that characterise the power lines; later, studies performed extended topological investigations where physical parameters of the lines (e.g., impedance) were included so that the researcher could obtain a picture that was closer to reality (e.g., Bompard et al., 2009). Another aspect that appears in most of the works (Albert et al., 2004; Crucitti et al., 2004, 2005; Chassin and Posse, 2005; Holmgren, 2006; Rosas-Casals and Corominas-Murtra, 2009; Rosas-Casals et al., 2007; Solé et al., 2008; Rosato et al., 2007; Pagani and Aiello, 2011; Hines and Blumsack, 2008; Wang et al., 2010; Han and Ding, 2011) is the evaluation of the node degree distribution statistics to investigate the presence of power-law probability distribution signs (p(k) ~ k–γ). Generally, the agreement between all the works is that the power grids follow an exponential trend that characterises the node degree probability distribution. The majority of studies in Table 1 focused on node attacks/failures in order to determine the vulnerability of the network; fewer works considered attacks/failures of lines and only three studies (i.e., Chassin and Posse, 2005; Pagani and Aiello, 2011; Bompard et al., 2010) considered both. Grid improvement in order to limit cascade effects and augment reliability is seldom considered. Only four studies address this key issue for the infrastructure: Crucitti et al. (2005) and Rosato et al. (2007) demonstrated the benefits of including more edges achievable for the high voltage power grids of Italy, France, and Spain showing a consistent improvement that just few additional lines provided for the Italian grid; Holmgren (2006) proposed a virtual scenario of a very simple grid (only nine nodes) where the author analysed the infrastructure (two additional lines) and improvement in restoration time after failures; Brummitt et al. (2012) applied a sand pile model (cf. Bak et al., 1987) to the South-East US grid and the study shows that more connectivity between subnetworks is not always beneficial in limiting the spread of cascade effects. All of the studies emphasise that the networks have good resilience when failures target random nodes. However, all the studies agree on the extreme vulnerability that networks showed towards targeted attacks, that is, failures that focus on key nodes such as those with high degree, high betweenness values, or elements that manage the highest amount of load or electricity flow. Studies that considered topological and physical parameters provided information about the way that networks tend to disrupt and spread failures that better reflects reality. However, the cross-check between nodes and lines identified as topologically most critical and problems actually experienced on the lines by grid operators and power companies is an important feature that nobody has studied. Such comparison with the results of the power industry would be extremely beneficial for the application of complex network analysis in the real power system world. Finally, to the best of our knowledge, all of the studies, except for the present one and our previous work (Pagani and Aiello, 2011), focus solely
42
G.A. Pagani and M. Aiello
on the high voltage grid. The focus on the high voltage grid is a limit since it ignores the grid levels that appear important for the success of the future smart grid that will be characterised by local scale generation and distribution.
4
Vulnerabilities in the Dutch medium and low voltage grid
In our study of the Dutch medium and low voltage grid, we have considered 11 samples that belong to the low voltage network (VLV ≤ 10 kV) and 13 samples that belong to the medium voltage network (10 kV ≤ VMV ≤ 20 kV) of the northern part of the Netherlands. We have developed two types of representations of each grid sample: a purely topological one and a weighted one. For the latter type, the weight on the edges represents the physical resistance of the cables, and the weight of a node is the sum of the weight of the incident edges on that node (Newman, 2004). Table 2 shows the main topological properties of the samples of the Dutch distribution network. The first column contains the identifier of the sample, while order and size are reported in the second and the third column, respectively. The fourth column shows the average node degree (). The fifth column provides a measure of the effort to move in the network by providing the characteristic path length (CPL). The sixth column provides a value of the clustering of the network (clustering coefficient for the whole network) (γ). The same properties are listed for the medium voltage samples too in columns 7 through 12. Table 2
Topological properties of the samples of the Dutch distribution grid Low voltage samples
ID
Order Size
Medium voltage samples
CPL
γ
ID Order
Size
CPL
γ
191
207
2.168
8.990
0.00296
9.527
0.00494
1
17
18
2.118
3.313
0.00000
1
2
15
16
2.133
3.000
0.00000
2
884
1059 2.396
3
24
23
2.087
4.228
0.00000
3
444
486
2.189 10.858 0.00537
4.449
4
30
29
1.933
0.00000
4
472
506
2.144 17.174 0.01360
5
188
191
2.032 17.878 0.00000
5
238
245
2.059 11.580 0.00000
6
10
9
1.800
2.223
0.00000
6
263
288
2.190 12.311 0.01118
7
63
62
1.968
5.404
0.00000
7
217
229
2.111 10.241 0.00140
5.000
8
28
27
1.929
0.00000
8
366
382
2.087 14.546 0.00000
9
133
140
2.105 11.366 0.01112
9
218
232
2.128 10.915 0.00000
10
124
138
2.226
7.070
0.00869
10
201
204
2.030 15.257 0.00166
11
31
30
1.935
4.357
0.00000
11
202
213
2.109 12.891 0.00140
12
25
24
1.920
13
464
499
2.151 12.703 0.00036
5.500
0.00000
4.1 Vulnerability: node failures There are basically two ways to perform the analysis on node vulnerability: choosing the nodes randomly or using a specific strategy to select the nodes to be removed. We consider three policies for node removal: random, highest degree, and highest betweenness. The measure that is taken into account is the order of the largest connected
A complex network approach for identifying vulnerabilities
43
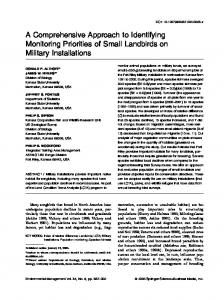
component of the network (i.e., the number of nodes composing the biggest connected cluster in the network). This value, and its evolution while nodes of the network are removed, are computed as a fraction of the original order of the network. Figure 1
Resilience for node removal for Dutch medium voltage sample #2, (a) random-based* (b) node degree-based (see online version for colours)
(a)
(b) Note: *Red line represents the mean over 50 repetitions and whiskers show the standard deviation.
The random removal simulates casual errors. In our previous work (Pagani and Aiello, 2011), we showed that few samples of the Dutch distribution grid tended to follow a powerlaw in the statistical distribution of the node degree, while others exhibited a statistical distribution closer to an exponential. Node degree distribution provides a statistical representation of the connectivity of the network and several properties arise from this characteristic (e.g., resilience to failures, node centrality). As shown in Cohen et al. (2000), networks that follow a power-law whose characteristic parameter γ < 3 tend to have a high value for the transition threshold at which they disrupt. In the samples we analysed, this is true especially for the small samples having a cluster that is 10% of the
44
G.A. Pagani and M. Aiello
original network when almost 90% of the nodes are removed. The situation is different for samples with higher order, which show a cluster that is reduced to 10% of the original when about 40% of the nodes are removed. Figure 1(a) shows the fraction f of the nodes removed from the original sample and the effects on the order of the largest connected component S relative to the initial order of the graph. Even if the degree distributions for samples following a power-law have a parameter γ < 3, the samples show a threshold effect that is more similar to networks whose characteristic γ > 3. The situation is radically different when targeted attacks are performed, such as the node degree-based removal and betweenness-based removal. The main difference compared to the random-based removal is the presence of very sharp drops that appear when certain nodes are removed, causing a decrease in the order of the maximal connected component of up to 40%, as shown in Figure 1(b). By just removing 10% of the most connected nodes, one reduces the network to only 10% of its original order. Figure 2
Node degree versus betweenness, (a) node degree versus betweenness for Dutch low voltage sample #10 (b) node degree versus betweenness for Dutch medium voltage sample #3 (see online version for colours)
(a)
(b)
A complex network approach for identifying vulnerabilities
45
The removal of nodes based on the highest betweenness generally shows the same behaviour as the degree-based removal. There is not perfect correlation between node degree and betweenness in power grids [an example is shown in Crucitti et al. (2004)], however, the general tendency is that nodes that have an higher node degree are more involved in the shortest paths as shown in Figure 2. Considering the general correlation between nodes with a certain degree and their betweenness, it is not surprising that the two removal policies have very similar results and shape. The only remark that generally differentiates the betweenness-based removal is a slightly higher order of the maximally connected component compared to the one obtained with the degree-based removal. In addition, the decrease of the order of the maximally connected component tends to be slightly smoother than the degree-based one. Figure 3 shows the comparison of the two removal policies. Figure 3
Resilience for betweenness based (red) and degree based (blue) attacks for Dutch medium voltage sample #10 (see online version for colours)
4.2 Vulnerability: edge failures Another way to investigate the resilience is to determine which and how many edges have to be removed to break the graph into two disconnected components of equivalent order (Rosato et al., 2007). To solve this problem, we exploit the spectrum of the Laplacian matrix of a graph. Definition 1 (Laplacian matrix): Let D = (Dij) be a diagonal matrix with Dii = d(vi) the degree of vertex vi in graph G and A the adjacency matrix. The matrix L = D – A is the Laplacian matrix of graph G. Definition 2 (Adjacency matrix): The adjacency matrix A = A(G) = (ai,j) of a graph G of order N is the N × N matrix given by ⎧1 if ( vi , v j ) ∈ E , aij = ⎨ ⎩0 otherwise.
of G, where (vi, vj) is an edge between vertex vi and vj and E is the edge set of G. By looking at the second smallest eigenvalue of the Laplacian matrix of the corresponding graph and computing the corresponding eigenvector, one has a representation of each node of the graph. Each node whose eigenvector component is
46
G.A. Pagani and M. Aiello
positive belongs to one sub-graph, while the ones with negative components belong to the other sub-graph. The edges that connect nodes belonging to the different sub-graphs are the critical edges that, if removed, lead to two different sub-graphs. The more edges connect the two sub-graphs, the more robust is the grid. Once the two sub-graphs are identified, it is possible to iterate the method on each sub-graph and find again the most critical edges. Table 3 shows the number and percentage of critical edges for the Dutch samples that we analysed. These edges, if removed at the same time, disrupt the network evenly in two or more sub-networks. The first column of the table represents the sample identifier, the second and fourth column represent the network type, and the third and fifth the number of edges to be removed simultaneously to split evenly the network. The absolute numbers in the table show that low voltage networks are more prone to edge failure than medium voltage networks; in the medium voltage network, twice as many edges must be removed before failure takes place. Medium voltage sample #2 is the most reliable against line disruption attack and indeed this is an indication of the highly meshed structure of this big sample (more than 850 nodes and 1,000 edges). However, the percentage values in the table show the opposite pattern. The networks with small size have high scores. The opposite pattern may be due to the small size and the small absolute number of nodes on a small sized network. Table 3
Number of critical edges for Dutch medium and low voltage samples Network type
Number of critical edges
% of critical edges
Network type
Number of critical edges
% of critical edges
1
LV
2
11.1
2
LV
2
12.5
MV
2
1.0
MV
27
2.5
3
LV
2
4
LV
1
8.7
MV
4
0.8
3.4
MV
5
1.0
5
LV
6
LV
2
1.0
MV
3
1.2
2
22.2
MV
4
1.4
7 8
LV
1
1.6
MV
4
1.7
LV
1
3.7
MV
1
0.3
9
LV
2
1.4
MV
6
2.6
10
LV
3
2.2
MV
4
2.0
11
LV
1
3.3
MV
4
1.9
12
-
-
-
MV
1
4.2
13
-
-
-
MV
6
1.2
ID #
4.3 Discussion The samples we have analysed from the Dutch medium and low voltage grid have a very small connectivity in terms of average node degree. In fact, the low voltage samples score for the average node degree = 2.009 with variance σ2 = 0.016, while the medium voltage samples score = 2.129 with variance σ2 = 0.012. These values are in general low, which is not surprising for a physical infrastructure such as the power grid. However, these values for the distribution grid are considerably lower than the values
A complex network approach for identifying vulnerabilities
47
found for high voltage grids; for instance, the average degree for the several samples of the grids in Europe is = 2.8. Despite such a difference in the average node degree, we generally observed a similar behaviour in the way the grids tend to disrupt. For attacks that consider nodes, when facing random removal, both medium and low voltage networks showed a degradation in the connectivity of the largest connected component that slowly decays. The situation was totally different when the attacks targeted nodes that have a particular importance in the network: high node degree or high betweenness. The removal of just a few nodes (a number of nodes that is less than 10% of the original order) disrupted the network: the order of the largest connected component was reduced to less than 20% of the initial order of the graph. We also performed a weighted analysis. Naturally, there was no change if weights were included or not for random removal. Targeted attacks also showed virtually no changes in the way networks disrupt when weights were added. The disruption behaviour of the network samples was very similar to the unweighted situation: the network suffered deeply from these targeted attacks; a very small percentage of removed nodes caused an important loss in the order of the biggest component left in the network. However, if one takes a closer look at the disruption charts for the same samples, some small differences can be noted. The nodes with the highest weighted degree caused bigger damage to the network when removed in the very first iteration than nodes with higher degree in unweighted networks. This behaviour is shown in Figures 4(a) and 4(b). The situation then changes in the later stages of the removal process when a bigger disruption is caused by nodes with higher node degree in the traditional sense. Concerning the robustness to edge removal, we note that the medium voltage grid to be generally more robust than the low voltage one. This result may be related to the more meshed structure of such a layer of the distribution grid. This behaviour of the medium and low voltage grid is in line with the findings of Rosato et al. (2007) for the high voltage grid. In general, the results for the medium voltage grid were closer to those for the high voltage grid in terms of edges that had to be removed compared to those for the low voltage grid. Figure 4
Resilience for node degree-based removal, (a) medium voltage sample #3 (b) low voltage sample #10 (see online version for colours)
(a) Note: (Un)weighted in (blue) red.
48
G.A. Pagani and M. Aiello
Figure 4
Resilience for node degree-based removal, (a) medium voltage sample #3 (b) low voltage sample #10 (continued) (see online version for colours)
(b) Note: (Un)weighted in (blue) red.
5
Vulnerability of synthetic topologies for the distribution grid
Most studies that use complex network analysis focus on extracting properties of networks arising from natural phenomena and human generated networks to try to understand the underlying rules that characterise them. Here, we look at network models that have proven to be successful in showing salient characteristics of technological networks, social networks, and natural phenomena to identify models that are best suited for the next generation distribution infrastructure, from a reliability point of view. Previous complex network analysis-based studies on the vulnerability of networks and their behaviour when subject to failures have focused mainly on the vulnerability of node removal in scale-free and random networks (Albert et al., 2000) or with other node degree distributions (Callaway et al., 2000). In this paper, in addition to scale-free and random graphs, we also consider small-world and recursive matrix (RMAT) models that may provide different properties than previous studies in the literature that used big graphs (Albert et al., 2000), especially considering the small order that characterises the distribution networks. Further, in our study we consider an analysis of the vulnerability on edges attack that has received less attention than node vulnerability analysis. We stress that these are possible model blueprints in which the future distribution grids can be designed. We are aware that other factors (e.g., territory geography, the users’ demand of power, and political factors) influence how the grid is designed and evolves. Next, we provide a brief introduction to the models used in the present study; more in-depth presentations are available in other publications [e.g., in Chakrabarti and Faloutsos (2006) and Newman (2003)]. The synthetic networks for this study were created with C++ ad hoc programmes and the Stanford Network Analysis Project (SNAP) (Stanford, 2013).
A complex network approach for identifying vulnerabilities
49
•
Random graph. A random graph is a graph that is created by picking each possible pair of nodes and connecting them with an edge with probability p. This approach is based on the pioneering studies of Erdős and Rényi (1959). The only parameters that are required to generate a synthetic random graph are the order and the size of the network.
•
Small-world graph. The small-world phenomenon became famous after the works of Milgram in the sociological context (Travers and Milgram, 1969) who found short chains of acquaintances connecting random people in the USA. More recently, the small-world characterisation of graphs has been investigated by Watts and Strogatz (1998), and Watts (2003), who showed the presence of the small-world property in many types of networks such as actor acquaintances, the power grid and neural networks in worms. To generate such networks in addition to size and order a probability of rewiring edges is necessary. We choose an intermediate approach between the regular lattice (i.e., rewiring probability p = 0) and random graph extremes (i.e., rewiring probability p = 1); thus, we choose the rewiring probability p = 0.4.
•
Scale-free network based on preferential attachment. The preferential attachment model represents a phenomenon in real networks where a fraction of nodes have high connectivity while the majority of nodes have a small node degree. This model is based on Barabási and Albert’s (1999) observation of a typical pattern that characterises several types of natural and artificial networks. The only parameters that are needed to generate networks with this model are the order and size of the graph to be generated. Networks that are based on this model have scale-free properties (Caldarelli, 2007).
•
R-MAT. R-MAT is a model that exploits the representation of a graph through its adjacency matrix (Chakrabarti et al., 2004). In particular, it applies a recursive method to create the adjacency matrix of a graph, thus obtaining a self-similar graph structure. This model captures the community-based pattern appearing in some real networks. The R-MAT model requires several parameters. First of all, order and size of the network, then the a, b, c, d parameters which represent the probabilities of the presence of an edge in a certain partition of the adjacency matrix. The order of the graph is chosen so that the nodes are a power of two, in particular, 2n where usually n = ⎡log2N⎤. Therefore, for this model, we consider the following values for the order: {32, 128, 256} for comparison with the low voltage grids, and {256, 512, 1,024} for comparison with the medium voltage grids. For the probability parameters, b = c since we have an undirected graph. Further, the ratio found between a and b is about 3.1, this is the case in many real scenarios, according to Chakrabarti et al. (2004). We assume a more highly connected community (a = 0.46) and a less connected community (d = 0.22) and a relative smaller connectivity between the two communities (b = c = 0.16).
We analysed the reliability of the topologies just described that have proven to be successful in describing the interactions in social or technological complex networks. For each topological model, we considered the reliability in terms of random and targeted attacks towards nodes of the network. For each sample, we considered several values of the order of the graph to have topologies similar to the physical ones in terms of the
50
G.A. Pagani and M. Aiello
number of nodes. Following our analysis of the northern Dutch medium and low voltage grid (Pagani and Aiello, 2011), we categorised networks as small, medium and large, based on their order (Table 4). By considering the disruption behaviour of the synthetic networks, we can evaluate which topological model is best to organise the distribution grid and how beneficial increased connectivity would be in this respect. Table 4
Categories of medium and low voltage network and their order
Network layer
Category
Order
Low voltage
Small
≈ 20
Low voltage
Medium
≈ 90
Low voltage
Large
≈ 200
Medium voltage
Small
≈ 250
Medium voltage
Medium
≈ 500
Medium voltage
Large
≈ 1,000
Source: Based on Pagani and Aiello (2011)
5.1 Vulnerability: node failures An increase in the average connectivity is particularly beneficial in contrasting the targeted attacks. Because of space limitations, we only show and describe the biggest samples in terms of the order of the graphs. However, the same considerations can be extended to the smaller samples generated by the same network generation algorithm. Figure 5 shows the resilience behaviour of the synthetic models described above in terms of the number of nodes belonging to the giant connected component as a fraction of the original order of the network when the networks are subject to random node removal. Figure 5
Resilience for random node removal for synthetic networks with order N ≈ 1,000, (a) scale-free network based on preferential attachment model (b) R-Mat networks (c) random graphs (d) small-world networks (see online version for colours)
(a) Note: Green line is the mean over 50 repetitions and the whiskers show the standard deviation (blue whiskers ≈ 2, red whiskers ≈ 4, and black whiskers ≈ 6).
A complex network approach for identifying vulnerabilities Figure 5
51
Resilience for random node removal for synthetic networks with order N ≈ 1,000, (a) scale-free network based on preferential attachment model (b) R-Mat networks (c) random graphs (d) small-world networks (continued) (see online version for colours)
(b)
(c)
(d) Note: Green line is the mean over 50 repetitions and the whiskers show the standard deviation (blue whiskers ≈ 2, red whiskers ≈ 4, and black whiskers ≈ 6).
52
G.A. Pagani and M. Aiello
Figure 5(a) shows the disruption behaviour of a network with increasing average node degree (i.e., ≈ 2, ≈ 4, and ≈ 6) built using the preferential attachment algorithm when nodes are randomly removed. We see a consistent improvement between the ≈ 2 and the ≈ 4 situations. The curves with the ≈ 4 and the ≈ 6 are almost overlapping until 40% of the initial nodes are removed. In this case, it seems that the additional connectivity plays a decisive role only in the late stage of the random attack process. Figure 5(b) shows the disruption behaviour of three R-MAT networks with increasing average node degree subject to random node removal. For this model of network, the disruption of the networks with increased connectivity behaves linearly (except in the very last part when 70% to 80% of the nodes are already removed). The difference in the behaviour of the network is very small, especially when the connectivity reaches ≈ 4 and ≈ 6. The additional connectivity provides clear benefits in the transition between ≈ 2 to ≈ 4, while the benefits of higher average connectivity (i.e., ≈ 6) are very thin and only significant when almost all nodes are removed. The resilience to random attacks targeting random graphs with increasing average node degree is shown in Figure 5(c). One sees for the three connectivity situations a linear degradation in the connectivity of the network for the biggest part of node removal. Comparing the three connectivity situations one sees that the difference between the ≈ 2 and ≈ 4 is significant and reaches a consistent differentiation in the number of nodes to be removed of about 25% when the greatest connected component is reduced to 10%. The difference between the ≈ 4 and ≈ 6 situations is limited to 10% in the latest stage of the attack. The small-world networks present the best improvement in reliability against random attacks when more connectivity is added. The graphical representation is shown in Figure 5(d). The model shows a rapid decrease in the order of the largest connected component when the average node degree is just ≈ 2: by only removing 15% of the nodes, the biggest connected component reduces to about 10% of the initial order. The improvement is remarkable when the number of edges doubles. Instead of following a fast decay, the network has a linear disruption until 50% of nodes are removed in the ≈ 4 situation and almost 65% of the nodes are removed in the ≈ 6 situation. The two most connected networks fall apart in a similar manner since there is no significant difference until 45% to 50% of the nodes are removed. Figure 6 shows the resilience behaviour of the synthetic models in term of the number of nodes belonging to the giant connected component as a fraction of the original order of the network when the networks are subject to targeted attacks towards the nodes with highest node degree (in decreasing order). Figure 6(a) provides the situation for the networks generated with the preferential attachment algorithm that are subject to attacks involving nodes with the highest degrees. Between the three evolutions with an increasing average node degree of ≈ 2, ≈ 4, and ≈ 6, one sees a general improvement in the number of nodes that are part of the largest connected component while the average degree increases. Actually, the left most curve in Figure 6(a) (i.e., ≈ 2) shows a behaviour that is very similar to those presented by the physical samples of the Dutch distribution grid: the removal of only a very tiny fraction of the most connected nodes causes the network to fall apart. The situation is actually worse for this type of synthetic network given the presence of only a few big hubs and the fact that these hubs have the majority of connection that hold the connectivity of the network. When the node degree increases to ≈ 4 and ≈ 6,
A complex network approach for identifying vulnerabilities
53
the disruption is smoother and the degradation in the numbers of the nodes belonging to the giant connected component degrades without big discontinuous steps. Figure 6(b) shows the resilience to node-based attacks for the R-MAT model. One sees an interesting behaviour in comparing the disruption behaviour of the R-MAT model with ≈ 2 and the physical samples: the disruption is quite smooth while more and more nodes are removed and the removal of a single node causes at most a loss less than 10% in the giant connected component. It is also remarkable that such discontinuity emerges when about 15% of the nodes of the original network are removed. Interestingly, there is also a similarity in the behaviour that the disruption has when more connectivity is added [see the two right most curves of Figure 6(b)]. In fact, there is only a small difference in resilience between the ≈ 4 and the ≈ 6 situations. The additional connectivity (from ≈ 4 to ≈ 6) in this model is not particularly beneficial. Figure 6
Resilience for node degree-based node removal for synthetic networks with order N ≈ 1,000, (a) scale-free network based on preferential attachment model (b) R-MAT networks (c) random graphs (d) small-world networks (see online version for colours)
(a)
(b)
54 Figure 6
G.A. Pagani and M. Aiello Resilience for node degree-based node removal for synthetic networks with order N ≈ 1,000, (a) scale-free network based on preferential attachment model (b) R-MAT networks (c) random graphs (d) small-world networks (continued) (see online version for colours)
(c)
(d)
The randomly created graphs show a disruption behaviour that does not have particular discontinuities in the order of the largest connected component. In fact, the decay proceeds for a large part of the removal of nodes in an almost linear way, as shown in Figure 6(c); for a randomly generated network, the node degree probability distribution is Poissonian (Dorogovtsev and Mendes, 2002), this distribution leads to a small probability of nodes with high degree. The enhanced connectivity is beneficial and one sees that every step of additional connectivity (i.e., ≈ 2, ≈ 4, and ≈ 6) improves about 0.2 in the fraction of nodes that need to be removed before the connectivity of the largest connected component is reduced to 5% of the initial order of the network. Considering the small-world model, one sees a very different picture that is similar in the ≈ 2 situation to the behaviour that is depicted by the Dutch samples: the removal of only 5% of the most connected nodes brings the network to an almost complete break-up (the giant connected component is only 10% of the initial order of the network).
A complex network approach for identifying vulnerabilities
55
Figure 6(d) shows the comparison between the disruption behaviour when the networks are generated with increasing average node degree. The improvements in robustness that are gained by doubling the number of connections are extremely beneficial compared to the ≈ 2 situation. Especially, the higher connectivity avoids that the removal of a single node causes a sudden drop in the order of the largest connected component. The effects of the removal of the top 25% of nodes with high degree have almost the same effect on the connectivity of the network when the average node degree is ≈ 4 or ≈ 6. This aspect is crucial when considering the trade-off between the costs of a more connected infrastructure and the benefits in terms of reliability that such a connectivity provides. Table 5
Critical edges for synthetic networks with increasing average node degree ≈ 2, ≈ 4, and ≈ 6 # critical edges with ≈ 2
% of % of % of # critical # critical critical critical critical edges edges edges edges edges with with with with with ≈ 4 ≈ 6 ≈ 2 ≈ 4 ≈ 6
Network model
Category
Scale-free network based on pref. att. model
LV-small
1
5.3
7
18.9
18
33.3
LV-medium
1
1.1
37
20.9
55
20.8
R-MAT
Random graph
Small-world
LV-large
1
0.5
83
20.9
140
23.6
MV-small
1
0.4
101
20.3
210
28.2
MV-medium
1
0.2
194
19.5
384
25.7
MV-large
1
0.1
335
16.8
758
25.3
LV-small
2
6.5
10
16.9
9
10.3
LV-medium
9
7.2
16
6.4
21
5.6
LV-large
15
5.7
30
6.0
38
5.0
MV-small
6
2.3
22
4.4
29
3.9
MV-medium
48
9.2
42
4.2
114
7.5
MV-large
21
2.0
60
2.9
60
2.0
LV-small
2
9.5
9
22.5
20
33.3
LV-medium
2
2.2
18
10.0
83
30.7
LV-large
13
6.3
66
16.5
89
14.8
MV-small
13
5.0
81
16.2
103
13.7
MV-medium
9
1.7
72
7.2
185
12.3
MV-large
47
4.6
292
14.6
406
13.5
LV-small
2
10.0
10
25.6
15
25.4
LV-medium
1
1.1
24
13.6
49
18.4
LV-large
2
1.0
61
15.3
121
20.2
MV-small
1
0.4
65
13.1
135
18.1
MV-medium
1
0.2
162
16.2
272
18.2
MV-large
1
0.1
265
13.3
602
20.1
56
G.A. Pagani and M. Aiello
5.2 Vulnerability: edge failures To investigate vulnerability to edge attacks, we apply the same procedure described in Section 4 to the synthetic topologies generated with increasing average node degree. The number of edges that need to be removed for the different models and for each category is shown in Table 5. In this table, the first column indicates the synthetic model that was used, the second column lists the category that the synthetic network belongs to, while the third, fifth and seventh column indicate the number of edges to be simultaneously removed to break the network in two sub-graphs when the average node degree is ≈ 2, ≈ 4, and ≈ 6, respectively. Columns four, six and eight give the same information of the edges to be removed, but consider the percentage of the critical edges in relation to the total number of edges. Generally, one sees that the more connectivity the network has, the more number of edges need to be removed. This is true between the different steps of addition of edges that we have considered for the synthetic networks. It is also true for the different six categories of networks that we have considered that have an increasing number of nodes and edges. When the networks have an average degree that is similar to the Dutch grids (i.e., ≈ 2), we got similar results with only a few edges that needed to be removed to split the network into two similar halves. In particular, the scale-free network that is based on the preferential attachment model and the small-world model had results close to those of the low voltage network, while the R-MAT and the random graphs show higher robustness that was closer to the results of the medium voltage network samples. The same results can be drawn considering the percentage values: in low connectivity conditions (i.e., ≈ 2) the values were similar to the Dutch samples, but by just doubling the connectivity, the percentages of critical edges increases notably (i.e., more edges need to be removed to disrupt the network) with the exception of the R-MAT networks. Actually, the addition of even more connectivity (i.e., ≈ 6) did not increase substantially the critical edges when considering the percentage.
5.3 Discussion The addition of connectivity is, in general, beneficial to the robustness of the networks. Of course, a completely connected network would provide maximum tolerance against random and targeted attacks. This is not possible in a physical infrastructure, such as the power grid, for both technical and economic reasons. As we have shown in our previous work (Pagani and Aiello, 2012), an addition of connectivity in synthetic networks is beneficial in influencing the topological parameters that determine the cost of electricity distribution. Here, we focus on the benefits for reliability that additional connectivity provides, taking into account the trade-off between cost (i.e., adding more edges) of connectivity and the benefits of higher reliability. In general, the random attacks affect the network in a less disruptive way compared to targeted attacks. The reduction in the number of nodes of the biggest connected components follows a smooth trend: the removal of each node causes a small amount of damage to the connectivity. Between the different synthetic topologies, one notes that in small connectivity conditions (i.e., ≈ 2) the model that performs best is the R-MAT, while the worst result belongs to the small-world network. Higher connectivity provides additional benefits to all of the networks. In particular, we see that all of the models have similar performances when the average node degree is ≈ 4 and ≈ 6. For the
A complex network approach for identifying vulnerabilities
57
power-law based models, the disruption behaviour follows a linear trend until the later stages of the node removal. For the random graph and the small-world models the trend in the later stages is steeper in the effects of node removal on the greatest connected component. This behaviour gives slightly better robustness results for the scale-free network that is based on the preferential attachment model and the R-MAT model. The picture is similar when considering the targeted attacks. We see that topology really plays a role in limiting attacks that involve the nodes with highest degree. When the average node degree is very low ( ≈ 2) the R-MAT model proves to be the best in limiting these types of attacks and the resilience is even better than a random graph. In particular, in contrast to the small-world model and the scale-free network that is based on the preferential attachment model, the R-MAT, and the random graph, do not show sudden changes in the order of the largest connected component that are present in the other two models where a single removal of a node deeply compromises the connectivity of the whole network. The situation changes when considering high degree of connectivity. R-MAT is outperformed by the random graph and by the small-world network. The robustness of the R-MAT with average node degree ≈ 6 is overtaken by both the random graph and the small-world graph, even with a reduced connectivity of ≈ 4. However, the model that performs worst in the three connectivity scenarios considered is the scale-free network that is based on the preferential attachment model. This last statement is not surprising given the already-known vulnerabilities of scale-free networks towards targeted attacks (Albert et al., 2000). This last aspect helps to explain the poor results of the R-MAT model when higher connectivity is added since RMAT is also characterised by power-law in the node degree probability distribution. The comparison between the best performing models, the random graph and the small-world models, shows that the small-world network is more robust when ≈ 6, and that the performance between the two models is very close when the node degree is ≈ 4. It is interesting to note how the connectivity plays an important role in determining the properties of the small-world model: when ≈ 2 there is basically no redundant connectivity locally, the network is basically a ring (no redundant connection between the neighbours of a node) with some edges that are rewired. When more connectivity is added the importance of neighbourhood start to increase. Further, this kind of model avoids the presence of big hubs in the network. Comparing the two removal policies for node attacks, we have the same results that we have shown for the physical samples: the targeted attacks are much more disrupting than the random ones. The only remarkable aspect is the similarity for the small-world network and random graph in the disruption behaviour of the largest connected component when the average node degree is ≈ 6 and the first 30% of the nodes is removed. This is due to the absence of hubs in the network that these two models have; in fact, the degree of the nodes in such network models tend to be fairly homogeneous. Considering the edge removal process for the various network models, we see that when the connectivity is limited (i.e., ≈ 2) the networks become two almost equal components when a few edges are removed. Data in Table 5 show that the scale-free network that is based on the preferential attachment model and the small-world model perform worst, while the random graph and the R-MAT models have more reliability against failures in edges. The situation changes when more connectivity is added; the scale-free network that is based on the preferential attachment model and the small-world model performs better, even at a connectivity of ≈ 4. The large number of edges that
58
G.A. Pagani and M. Aiello
need to be removed in the scale-free network that is based on the preferential attachment model networks can be intuitively explained through the results obtained in the targeted attacks towards the most connected nodes: the network is relatively fragile when a small amount of the hub nodes are removed; thus the network reduces its connectivity and splits. Here, to split the network, the targets are edges, and most likely those edges that keep the connectivity of the network. Therefore, the edges involved are those that have the hubs as end nodes and nodes that are not leaves (i.e., nodes with ≈ 1) at the other end of the edge. The robustness of the small-world model can be explained in a different manner: the network has no big hubs and a lot of connectivity is local between neighbours of a node, with only a fraction of edges that are rewired. Therefore, to split the network it is sufficient to remove part of the rewired connections (i.e., the shortcuts in the network). Considering the percentages in Table 5 one sees how the important leap towards more reliability is achieved by the first step in increasing connectivity ( ≈ 4), while further connectivity is less beneficial (e.g., small-world model); actually, for the biggest samples, the percentage figure slightly reduces its value from the ≈ 4 to the ≈ 6 situation. In the context of real distribution networks, the analysis of synthetic networks needs to be considered in providing a high-level perspective on how a distribution grid that is based on (or that is reorganised according to) a topological model (e.g., the small-world model) with an amount of connectivity (e.g., ≈ 4 or ≈ 6) is beneficial to the vulnerability of the grid.
6
Concluding remarks
Topological analysis can rapidly give an overview of the possible vulnerability of a large network. As a statistical tool, it has limitations: on the one hand, it provides a simplification of the system that becomes easily analysable. On the other hand, topological analysis leaves out specific aspects of the power grid, like power flows, transient dynamics, and physical characterisation of substations. This analysis of the robustness of the distribution grid is not meant to be a substitute for current reliability assessment methods that are used by distribution companies; instead, it aims to provide a rapid and broad perspective of the topic by emphasising the importance of the topology of the grid itself. In this paper, we have shown that topology plays an important role in the robustness of the network at all power levels, including the medium and low voltage levels. By comparing the results obtained in the analysis of the physical networks and the results of the synthetic networks with increased connectivity, we see that, in general, more edges are beneficial in limiting both node and edge attacks. Further, the choice of a specific topology plays a key role in guaranteeing more robustness (cf. the RMAT model with ≈ 2 and the physical sample in Figure 1(b) for node removals). Of course, pure topology alone is not sufficient for the improvement of the power grid since technical and economical constraints play important roles in shaping the grid too. In a future energy scenario where energy is produced and consumed locally, the distribution infrastructure will need to change, while providing high standards for resilience to failures. For current distribution grid network samples, the disruption in general follows the results found in the literature for the high voltage grid. We noted a general weakness in the link removal for the low voltage grid, where it is likely that many small-scale generating facilities will be connected. We have seen how an increment in the
A complex network approach for identifying vulnerabilities
59
average connectivity benefits in contrasting both random and targeted attacks towards the most connected nodes. A first investigation regarding the improvements that an increase in connectivity from a broad topological perspective might bring to the distribution grid is presented in our previous work (Pagani and Aiello, 2012). One can expect a growing interest in the evaluation of the reliability of the distribution grid and increasing attention to the topology of future networks. In the future, we plan to study the vulnerability of other topological models from the complex network literature and perform power flow analyses on real and synthetic distribution topologies. The goal is to develop new metrics that combine more traditional power design features and topological features to assess the reliability of the distribution grid. More efforts are required for optimal smart grid design, not only from a topological point of view, but also when taking electrical and power system control aspects into consideration to enable the electrical system of the 21st century.
References Aiello, W., Chung, F. and Lu, L. (2000) ‘A random graph model for massive graphs’, Proceedings of the Thirty-Second Annual ACM Symposium on Theory of Computing – STOC ‘00, pp.171–180. Albert, R., Albert, I. and Nakarado, G.L. (2004) ‘Structural vulnerability of the North American power grid’, Physical Review E, Vol. 69, No. 2, p.025103. Albert, R., Jeong, H. and Barabási, A.L. (2000) ‘Error and attack tolerance of complex networks’, Nature, Vol. 406, No. 6794, pp.378–382. Albert, R., Jeong, H. and Barabási, A-L. (1999) ‘Internet: diameter of the World Wide Web’, Nature, Vol. 401, No. 6749, pp.130–131. Anderson, C.W., Santos, J.R. and Haimes, Y.Y. (2007) ‘A risk-based input-output methodology for measuring the effects of the August 2003 northeast blackout’, Economic Systems Research, Vol. 19, No. 2, pp.183–204. Bak, P., Tang, C. and Wiesenfeld, K. (1987) ‘Self-organized criticality: an explanation of the 1/f noise’, Phys. Rev. Lett., Vol. 59, No. 4, pp.381–384. Barabási, A.L. and Albert, R. (1999) ‘Emergence of scaling in random networks’, Science, Vol. 286, No. 5439, p.509. BBC (2003a) [online] http://news.bbc.co.uk/2/hi/3146136.stm (accessed 7 October 2012). BBC (2003b) [online] http://news.bbc.co.uk/2/hi/americas/3152451.stm (accessed 7 October 2012). Bompard, E., Napoli, R. and Xue, F. (2009) ‘Analysis of structural vulnerabilities in power transmission grids’, Int. J. of Critical Infrastructure Protection, Vol. 2, Nos. 1–2, pp.5–12. Bompard, E., Wu, D. and Xue, F. (2010) ‘The concept of betweenness in the analysis of power grid vulnerability’, Complexity in Engineering, 2010, COMPENG'10, IEEE, pp.52–54. Boss, M., Elsinger, H., Summer, M. and Thurner, S. (2004) ‘The network topology of the interbank market’, Quantitative Finance, Vol. 4, No. 6, pp.677–684. Brummitt, C.D., D’Souza, R.M. and Leicht, E.A. (2012) ‘Suppressing cascades of load in interdependent networks’, Proceedings of the National Academy of Sciences, Vol. 109, No. 12, pp.E680–E689. Caldarelli, G. (2007) Scale-free Networks: Complex Webs in Nature and Technology, Oxford Finance Series, OUP, Oxford. Callaway, D.S., Newman, M.E.J., Strogatz, S.H. and Watts, D.J. (2000) ‘Network robustness and fragility: percolation on random graphs’, Phys. Rev. Lett., Vol. 85, No. 25, pp.5468–5471. Chakrabarti, D. and Faloutsos, C. (2006) ‘Graph mining: laws, generators, and algorithms’, ACM Computing Surveys (CSUR), Vol. 38, No. 1, p.2.
60
G.A. Pagani and M. Aiello
Chakrabarti, D., Zhan, Y. and Faloutsos, C. (2004) ‘R-MAT: a recursive model for graph mining’, in Fourth SIAM International Conference on Data Mining. Chassin, D.P. and Posse, C. (2005) ‘Evaluating North American electric grid reliability using the Barabási-Albert network model’, Physica A: Statistical Mechanics and its Applications, Vol. 355, No. 2, pp.667–677. Cohen, R., Erez, K., Ben-Avraham, D. and Havlin, S. (2000) ‘Resilience of the internet to random breakdowns’, Phys. Rev. Lett., Vol. 85, No. 21, pp.4626–4628. Colizza, V., Barrat, A., Barthélemy, M. and Vespignani, A. (2006) ‘The role of the airline transportation network in the prediction and predictability of global epidemics’, Proceedings of the National Academy of Sciences of the United States of America, Vol. 103, No. 7, pp.2015–2020. Colizza, V., Barrat, A., Barthélemy, M. and Vespignani, A. (2007) ‘Predictability and epidemic pathways in global outbreaks of infectious diseases: the SARS case study’, BMC Med., Vol. 5, No. 1, p.34. Cossent, R., Gómez, T. and Frías, P. (2009) ‘Towards a future with large penetration of distributed generation: is the current regulation of electricity distribution ready? Regulatory recommendations under a European perspective’, Energy Policy, Vol. 37, No. 3, pp.1145–1155. Crucitti, P., Latora, V. and Marchiori, M. (2004) ‘A topological analysis of the Italian electric power grid’, Physica A: Statistical Mechanics and its Applications, Vol. 338, Nos. 1–2, pp.92 –97. Crucitti, P., Latora, V. and Marchiori, M. (2005) ‘Locating critical lines in high-voltage electrical power grids’, Fluctuation and Noise Letters, Vol. 5, No. 2, pp.L201–L208. Donato, D., Laura, L., Leonardi, S. and Millozzi, S. (2007) ‘The web as a graph: how far we are’, ACM Transactions on Internet Technology, Vol. 7, No. 1, p.4-es. Dorogovtsev, S.N. and Mendes, J.F.F. (2002) ‘Evolution of networks’, Advances in Physics, Vol. 51, No. 4, pp.1079–1187. Doye, J. (2002) ‘Network topology of a potential energy landscape: a static scale-free network’, Physical Review Letters, Vol. 88, No. 23, pp.1–4. Dwivedi, A., Yu, X. and Sokolowski, P. (2010) ‘Analyzing power network vulnerability with maximum flow based centrality approach’, in 2010 8th IEEE International Conference on Industrial Informatics (INDIN), pp.336–341. Erdős, P. and Rényi, A. (1959) ‘On random graphs. I’, Publ. Math. Debrecen, Vol. 6, pp.290–297. Faloutsos, M., Faloutsos, P. and Faloutsos, C. (1999) ‘On power-law relationships of the internet topology’, in Proceedings of the Conference on Applications, Technologies, Architectures, and Protocols for Computer Communication, ACM, p.262. Gautreau, A., Barrat, A. and Barthélemy, M. (2008) ‘Global disease spread: statistics and estimation of arrival times’, Journal of Theoretical Biology, Vol. 251, No. 3, pp.509–522. Guimerà, R. and Amaral, L.A.N. (2004) ‘Modeling the world-wide airport network’, The European Physical Journal B – Condensed Matter, Vol. 38, No. 2, pp.381–385. Han, P. and Ding, M. (2011) ‘Analysis of cascading failures in small-world power grid’, International Journal of Energy Science, Vol. 1, No. 2, pp.99–104. Hines, P. and Blumsack, S. (2008) ‘A centrality measure for electrical networks’, in Hawaii Int. Conf. on System Sciences, p.185. Hines, P., Cotilla-Sanchez, E. and Blumsack, S. (2010) ‘Do topological models provide good information about electricity infrastructure vulnerability?’, Chaos: An Interdisciplinary Journal of Nonlinear Science, Vol. 20, No. 3, p.033122. Holmgren, A.J. (2006) ‘Using graph models to analyze the vulnerability of electric power networks’, Risk Analysis, Vol. 26, No. 4, pp.955–969. Jeong, H., Tombor, B., Albert, R., Oltvai, Z.N. and Barabási, A.L. (2000) ‘The large-scale organization of metabolic networks’, Nature, Vol. 407, No. 6804, pp.651–654.
A complex network approach for identifying vulnerabilities
61
Kephart, J. and White, S. (1991) ‘Directed-graph epidemiological models of computer viruses’, in Proceedings on 1991 IEEE Computer Society Symposium on Research in Security and Privacy, pp.343–359. Kim, C.J. and Obah, O.B. (2007) ‘Vulnerability assessment of power grid using graph topological indices’, International Journal of Emerging Electric Power Systems, Vol. 8, No. 6. Latora, V. and Marchiori, M. (2002) ‘Is the Boston subway a small-world network?’, Physica A: Statistical Mechanics and its Applications, Vol. 314, Nos. 1–4, pp.109–113. Marnay, C. and Venkataramanan, M. (2006) ‘Microgrids in the evolving electricity generation and delivery infrastructure’, in IEEE Power Engineering Society GM. Morgan, M.G., Apt, J., Lave, L.B., Ilic, M.D., Sirbu, M. and Peha, J.M. (2009) ‘The many meanings of ‘smart grid’’, Technical Report, Carniege Mellon University. Newman, M.E.J. (2003) ‘The structure and function of complex networks’, SIAM Review, Vol. 45, No. 2, pp.167–256. Newman, M.E.J. (2004) ‘Analysis of weighted networks’, Phys. Rev. E, Vol. 70, No. 5, p.056131. Pagani, G.A. and Aiello, M. (2011) ‘Towards decentralization: a topological investigation of the medium and low voltage grids’, IEEE Trans. Smart Grid, Vol. 2, No. 3, pp.538–547. Pagani, G.A. and Aiello, M. (2012) ‘Power grid network evolutions for local energy trading’, Technical Report, available at arXiv: 1201.0962, JBI, University of Groningen. Pagani, G.A. and Aiello, M. (2013) ‘The power grid as a complex network: a survey’, Physica A: Statistical Mechanics and its Applications, Vol. 392, No. 11, pp.2688–2700. Rosas-Casals, M. (2010) ‘Power grids as complex networks: topology and fragility’, in Complexity in Engineering, 2010, COMPENG’10’, pp.21–26. Rosas-Casals, M. and Corominas-Murtra, B. (2009) ‘Assessing European power grid reliability by means of topological measures’, Trans. of Ecology and the Environment, No. 121, pp.515–525. Rosas-Casals, M., Valverde, S. and Solé, R.V. (2007) ‘Topological vulnerability of the European power grid under errors and attacks’, International Journal of Bifurcation and Chaos, Vol. 17, No. 7, p.2465. Rosato, V., Bologna, S. and Tiriticco, F. (2007) ‘Topological properties of high-voltage electrical transmission networks’, Electric Power Systems Research, Vol. 77, No. 2, pp.99–105. Solé, R.V., Rosas-Casals, M., Corominas-Murtra, B. and Valverde, S. (2008) ‘Robustness of the European power grids under intentional attack’, Physical Review E, Vol. 77, No. 2, pp.1–7. Stanford (2013) [online] http://snap.stanford.edu/ (accessed 7 October 2012). Strogatz, S.H. (2001) ‘Exploring complex networks’, Nature, Vol. 410, No. 6825, pp.268–276. Travers, J. and Milgram, S. (1969) ‘An experimental study of the small world problem’, Sociometry, Vol. 32, No. 4, pp.425–443. Wang, J-W. and Rong, L-L. (2009) ‘Cascade-based attack vulnerability on the us power grid’, Safety Science, Vol. 47, No. 10, pp.1332–1336. Wang, Z., Scaglione, A. and Thomas, R. (2010) ‘The node degree distribution in power grid and its topology robustness under random and selective node removals’, in IEEE Int. Conf. on Communications (ICC), pp.1–5. Watts, D.J. (2003) Small Worlds: The Dynamics of Networks between Order and Randomness, Princeton University Press, Princeton, NJ, USA. Watts, D.J. and Strogatz, S.H. (1998) ‘Collective dynamics of ‘small-world’ networks’, Nature, Vol. 393, No. 6684, pp.440–442.