A Component Infrastructure for Performance and Power Modeling of Parallel Scientific Applications ∗
Boyana Norris
Kevin Huck
University of Houston 501 Phillip G. Hoffman Hall Houston, TX 77204, USA
Argonne National Laboratory 9700 S. Cass Ave. Argonne, IL 60439, USA
University of Oregon 120 Deschutes Hall Eugene, OR 97405, USA
Lois Curfman McInnes
[email protected] Li Li
[email protected] Oscar Hernandez
Argonne National Laboratory 9700 S. Cass Ave. Argonne, IL 60439, USA
Argonne National Laboratory 9700 S. Cass Ave. Argonne, IL 60439, USA
University of Houston 501 Phillip G. Hoffman Hall Houston, TX 77204, USA
[email protected]
[email protected] Barbara Chapman
Van Bui
[email protected]
[email protected]
University of Houston 501 Phillip G. Hoffman Hall Houston, TX 77204, USA
[email protected]
ABSTRACT Characterizing the performance of scientific applications is essential for effective code optimization, both by compilers and by high-level adaptive numerical algorithms. While maximizing power efficiency is becoming increasingly important in current high-performance architectures, there is little or no hardware or software support for detailed power measurements. Hardware counter-based power models are a promising method for guiding software-based techniques for reducing power. We present a component-based infrastructure for performance and power modeling of parallel scientific applications. The power model leverages on-chip performance hardware counters and is designed to model power consumption for modern multiprocessor/multicore systems. Our tool infrastructure includes application components as well as performance/power measurement and analysis components. We collect performance data using the TAU performance component and apply the power model in the performance and power analysis of a PETSc-based parallel fluid dynamics application by using the PerfExplorer component.
Categories and Subject Descriptors D.2.13 [Software Engineering]: Reusable Software—domain engineering; J.2 [Physical Sciences and Engineer∗Correspondence should be directed to
[email protected]
Permission to make digital or hard copies of all or part of this work for personal or classroom use is granted without fee provided that copies are not made or distributed for profit or commercial advantage and that copies bear this notice and the full citation on the first page. To copy otherwise, to republish, to post on servers or to redistribute to lists, requires prior specific permission and/or a fee. CBHPC 2008, October 14–17, 2008, Karlsruhe, Germany. Copyright 2008 ACM 978-1-60558-311-2/08/10 ...$5.00.
ing]: Physics
General Terms Design, Performance, Components, Standardization
Keywords power modeling, performance modeling, Common Component Architecture, CCA
1.
INTRODUCTION
Performance analysis of scientific applications is still more of an art form than a science. While the numbers of tools and experts in performance analysis are growing, evaluating and improving performance of parallel applications remains a difficult, time-consuming, manual process, often requiring detailed knowledge of different architectures and tools. If in addition to performance one wishes to estimate the power used by an application, the options are even more limited. Cycle-accurate simulation is a popular approach to estimating the power and energy use of computations, but only small benchmarks can be simulated. Furthermore, hardware for direct power measurements is largely nonexistent. Component-based software engineering (CBSE) enables, among other things, automated code generation for various purposes based on well-defined component interfaces. This has been leveraged to provide performance measurement and analysis capabilities to component-based applications with a much better degree of automation. In addition to leveraging existing code generation capabilities, we have implemented components that provide commonly needed functionality, such as database access and manipulation. Furthermore, we describe how the performance analysis infrastructure based on PerfExplorer can be extended with power models that can be used to estimate power and energy consumption based on hardware counter information.
1.1
The Common Component Architecture
Computational scientists face numerous software development challenges in parallel and distributed high-performance computing (HPC). Rapid advances and increasing diversity in high-performance hardware platforms continue to spur the growing complexity of scientific simulations. The resulting environment presents ever-increasing productivity challenges associated with creating, managing, and applying simulation software to scientific discovery. Component technology (see, e.g., [53]), which is now widely used in mainstream computing but has only recently begun to make inroads in HPC, extends the benefits of object-oriented design by providing coding methodologies and supporting infrastructure to improve software extensibility, maintainability, and reliability. The Common Component Architecture (CCA) Forum [14] is thus developing a component standard [7] for scientific computing, which includes capabilities for language-neutral specification of common component interfaces, interoperability for software written in programming languages important to scientific computing, and dynamic composability, all with minimal runtime overhead. In addition to aiding software development, the component environment can facilitate the deployment of new computational capabilities to benefit the entire lifecycle of scientific simulation software. As components introduce an additional layer of program abstraction, performance tools are needed that support automated performance measurement and analysis. Component based performance monitoring is currently supported by the TAU performance system. Very few tools exist that support high-level performance measurement and analysis of component-based applications. To the best of our knowledge, there are no component-based systems for performance and power measurement and analysis. The work presented in this paper is part of a component initiative on Computational Quality of Service (CQoS) [36,42], which focuses on helping application scientists dynamically compose, substitute, and reconfigure component implementations and parameters, taking into account tradeoffs among computational quality of service factors such as power usage, performance, accuracy, and reliability.
1.2
Motivating Example: The Effect of Compiler Optimizations on Performance and Power
The OpenUH [34] compiler is a branch of the open source Open64 compiler suite for C, C++, and Fortran 95, supporting the IA-64, IA-32e, and Opteron Linux ABI and standards. OpenUH provides complete support for OpenMP 2.5 compilation and its runtime library. OpenUH has been enhanced to support the requirements of TAU [49], Kojak [39] and PerfSuite [31] by providing an instrumentation API for source code and OpenMP runtime library support. OpenUH provides a complete compile-time instrumentation module that works at different compilation phases and covers a variety of program constructs (e.g., procedures, loops, branches, callsites). We have designed a language-independent compiler instrumentation API that can be used to instrument complete applications written in C, C++, Fortran, OpenMP and MPI [20]. OpenMP constructs are handled via runtime library instrumentation, where the fork and joint events, implicit and explicit barriers are captured [12]. We leveraged the OpenUH compiler’s integrated performance measurement environment in exploring the tradeoffs between per-
formance and power as they relate to compiler optimization levels. In this example, we studied the performance and power characteristics of a comprehensive and powerful real world simulation code, GenIDLEST. GenIDLEST (Generalized Incompressible Direct and Large-Eddy Simulations of Turbulence) solves the incompressible Navier-Stokes and energy equations and implements support for multiple levels of parallelism with “virtual cache blocks” at the lowest level. “Embedded” or “hybrid” parallelism [54] is exploited by using OpenMP in each MPI process. We created PerfExplorer scripts to compute power dissipation and energy consumption estimates and analysis. Different levels of standard optimizations for the OpenUH compiler were applied ranging from O0 (all optimizations are disabled) to O3 (applies the most aggressive optimizations including loop nest optimizations). The application was run in parallel with MPI on 16 processors on an Altix 300. The results from the study show that power dissipation generally increases with higher optimization levels while energy decreases as more aggressive compiler optimizations are applied (see Table 1). These results were consistent with previous studies that examine the effects of compiler optimizations on power and energy efficiency [47, 61]. Also consistent with a previous research study [61], we found that the instruction count was directly proportional to energy consumption and a similar relationship exists between instructions per cycle (IPC) and power dissipation. A higher instruction count translates to more work for the CPU and so energy increases. Optimizations such as common subexpression elimination and copy propagation that decrease the number of instructions are generally beneficial when compiling for energy efficiency. In the case of compiling for power efficiency, optimizations that increase the overlap in instruction execution while keeping the instruction count fairly constant (and therefore increasing IPC) results in higher power consumption. Examples of optimizations that may increase power dissipation include software pipelining, instruction scheduling, and vectorization. Metric Time Instructions Completed Instructions Issued Instructions Completed Per Cycle Instructions Issued Per Cycle Watts Joules FLOP/Joule
-O0 1.0 1.0 1.0 1.0 1.0 1.0 1.0 1.0
-O1 0.338 0.471 0.472 1.397 1.400 1.025 0.346 2.867
-O2 0.071 0.059 0.063 0.857 0.909 1.001 0.071 13.684
-O3 0.049 0.056 0.061 1.209 1.316 1.029 0.050 19.305
Table 1: GenIDLEST relative differences for different optimization settings, using 16 MPI processes on a 90riblet problem. Optimization level O0 is the baseline. In the following sections, we discuss existing tool support for performance and power monitoring and analysis of HPC applications. We then detail our measurement system that includes performance and power models and related software components. We next present results from our experiments in applying our measurement infrastructure in exploring the performance and power characteristics of an application based on the scientific numerical library, PETSc. Finally, we close with a discussion of plans for future work and make our final remarks.
2.
RELATED WORK
Several tools support performance and power measurments and analyses. Although most toolsets are targeted for either performance or power, not both at the same time. There is a lack of support for integrated performance and power measurement and analysis tools, especially at the abstraction level of components. In this section, we detail the state-ofthe-art tools that currently support performance and power measurments and analyses.
2.1
Performance Monitoring and Analysis Tools
Performance measurement determines what performance event is captured and in what manner. Two common forms of measurement include tracing and profiling.A plethora of trace based performance tools are available in both research and industry. Examples of tracing tools include TAU [49], SCALEA [60], KOJAK [66], Vampirtrace [43], and the Sun Analyzer [27]. Tracing can potentially incur large overheads and generate very large trace files. Profiling addresses the overhead problems that arise from tracing. A technique known as statistical sampling that is based on profiling mitigates data collection overheads by capturing a subset of events. Statistical sampling involves periodically sampling system counters.Performance tools such as PerfSuite [44], VTune [67], HPCToolkit [38], and JRockit [52] collect performance data using statistical sampling. A drawback of statistical sampling is that the performance data can be less precise and complete compared to tracing. If the sampling threshold is set to a high value, the tool will not be able to measure the events that execute faster than the threshold value. If the sampling threshold is set to a low value, large levels of overhead can result from the high frequency of sampling. The TAU Performance System [48] is a portable profiling and tracing toolkit for performance analysis of parallel programs written in Fortran, C, C++, Java, and Python. The primary way TAU collects measurement data from applications is by auto-instrumenting the code at the compile stage, and links in the TAU measurement runtime. TAU can measure at a granularity which ranges from the entire application down to single lines of code, but commonly occurs at function and loop boundaries. Instrumentation and measurement tools such as TAU can collect very detailed performance data from parallel applications. Performance analysis tools process the performance data and transform it into a format that can be more easily accessible to the performance analyst. Since processing the data can incur a large runtime overhead, some tools opt to process the performance data offline [24, 40, 45]. Performance analysis can also be accomplished online [2, 19, 56]. Online analysis usually supports runtime optimizations. In order for online analysis to be worth the runtime overheads, the improvements from optimizations should outweigh the overhead costs. In the case of performance analysis using low level hardware performance counters, analysis can be performed either online or offline. PerfExplorer [24], a framework for parallel performance data mining and knowledge discovery, was developed in order to perform analysis on large collections of performance experiment data. The framework architecture enables the development and integration of data mining operations that can be applied to parallel performance profiles. PerfEx-
plorer is built on a performance data management framework called PerfDMF [23], which provides a library to access the parallel profiles and save analysis results in a relational database. PerfDMF includes support for nearly a dozen performance profile formats, including TAU profiles. PerfExplorer is integrated with existing analysis toolkits (R [57], Weka [65]), and provides for extensions using those toolkits. Both PerfDMF and PerfExplorer are free, open-source tools included in the TAU distribution.
2.2
Power Monitoring and Analysis Tools
For large-scale server systems, timely predictions of power consumption are critical for preventing thermal emergencies, reducing cooling costs, and maximizing the lifetime and reliability of the system. Power can be measured by using live measurement techniques; however, tools and necessary equipment are not readily available or easy-to-use. An alternative is to measure power using thermal sensors, but such methods are highly inaccurate because of the effects of thermal inertia and slow thermal sensor readings. Research has shown that power can be accurately modeled using on-chip performance hardware counters [8, 9, 25]. Most modern-day processors are equipped with complete hardware-based support for performance monitoring in the form of performance counters. Thus, modeling power using performance counters includes the benefits of low overhead and high-accuracy measurements. Several strategies exist for reducing total power dissipated and energy consumed by a microprocessor. Power and energy saving techniques can be applied at the level of circuits, architectures, system software, and at the application layer [62]. Power analysis and optimizations at the system software and application layers have not been adequately explored, but some progress has been made in recent times. Seng and Tullsen [47] studied the effects of power and energy savings for both standard compiler optimizations and individual optimizations on the Pentium 4. Their experiments suggest that compiling for the best performance is equated with high energy savings. Valluri and John [61] performed a similar but more in-depth study on the Alpha 21264 processor. They found that optimizations that improve performance by reducing the instruction count are optimized for low energy. They also found that optimizations that improve performance by increasing the amount of overlap in execution of instructions increase average power dissipation in the processor. LUNA [17] is a high level power analysis framework for multicore NoC architectures. LUNA has been employed by the compiler to generate power profiles in the network that were used to generate directives which are stored at each router to direct the operation of dynamic-voltagescalable (DVS) links. The COPPER project [4] applies dynamic compilation strategies for dynamic power management. They introduce techniques for compiler controlled dynamic register file reconfiguration and profile-driven dynamic clock frequency and voltage scaling. At the application layer, PowerPack [13] provides library routines that allow users to embed ACPI calls in applications and reduce the CPU’s processing speed via DVS. Very few tools provide an automated framework that would enable the non-expert to successfully apply these optimization techniques to achieve low energy consumption and power dissipation rates in their applications.
3.
COMPONENT-BASED PERFORMANCE AND POWER MODELING ENVIRONMENT
In this section we introduce our hardware counter-based performance and power models that are ultimately aimed at guiding compiler optimizations and automated algorithm adaptation. Most modern day processors are equipped with complete hardware based support for performance monitoring. Major hardware vendors including Intel, AMD, IBM, Compaq and Cray provide this base level of support for performance monitoring in their processors. In the subsequent discussion, we focus on the Itanium 2 processor (Madison), but the same general approach can be applied to different architecture (we are in the process of defining and validating models for the SiCortex platform).
3.1
Performance Model
The performance model is designed to enable an application tuning cycle consisting of iterative application runs of data collection that identify locations and explanations for performance inefficiencies. The performance model presented here is based on a methodology applied to bottleneck analysis as discussed in [28] and [22]. Jarp [28] applies a methodology for bottleneck analysis using hardware performance counters. The user initially counts the most general events and drill down to more fine grained events. Event counters are structured in a way that enables the decomposition of more general events. Our performance model emphasizes more floating point inefficiencies and so extend the model shown in [28] in this respect. To identify regions of code where there is a higher then average level of stall cycles in the processor back-end, the following formula can be applied: GlobalStalls = Stall Cycles/T otal Cycles
(1)
For applications that are floating-point based, we derive several floating point inefficiency metrics. These metrics can be easily extended for integer based programs. The following metric computes the percentage stall cycles due to floating point inter-register dependencies, latencies of load instructions, and stalls at the floating point unit: %F LP Stalls = F LP Stalls/T otal Cycles
(2)
The following metric identifies the regions of code that have a higher then average percentage of floating point stalls and a high count of floating point operations. Note that this metric is problem size dependent and so should be used in tuning applications where the problem size does not vary. DependentF LP Stalls = F LP OP S∗ (F LP Stalls/T otal Cycles)
region being measured. The regions with the highest inefficiency are the regions that the programmer and compiler should focus on optimizing. We use hardware counters to perform the memory bottleneck analysis based on the following formula: M emory Stalls = (L2 data ref erences L2 all − L2 misses) ∗ L2 M emory Latency + (L2 misses − L3 missed) ∗ L3 M emory Latency + (L3 misses − N umber of remote memory accesses) ∗ Local M emory Latency + (N umber of remote memory accesses) ∗ Remote memory access latency + T LB misses ∗ T LB miss penalty Remote M emory Accesses Ratio = N umber of remote memory accesses/L3 misses The coefficients in this formula are the different latencies (in cycles) for the different levels of memory for the Itanium 2 processor (Madison), and the interconnection latencies of the SGI NumaLINK 4 for local and remote memory accesses. The value for remote memory latency accesses is an estimation of the worst-case scenario for a pair of nodes with the maximum number of hops and is system dependent.
3.2
Power Model
In our study of modeling processor power consumption and energy efficiency, we use PerfExplorer to compute a power metric based on [26]. Isci and Martinosi [26] construct a model of power consumption based on performance hardware counters and on several on-die components of an Intel Pentium 4 processor.We apply a modified version of this power model for a more complex processor (i.e. Madison 9M Intel Itanium 2 processor) and on a multiprocessor system at NCSA. We extend the power model to use transistor counts as initial values for the architectural scaling factor instead of component area ratios [26]. The architectural scaling factor in the model is applied to the maximum power value for each component (see Eq. 5). Given that transistor activity and leakage current are important factors for both dynamic and static power consumption, respectively, we base the architectural scaling factor on transistor counts for each component. Furthermore, we simplify our power model and do not initially take into account the power-saving effects of clock gating. Our power model is based on on-die components and initially considers the caches and core logic of the processor. Our power model metric is as follows: P ower(Ci ) = AccessRate(Ci ) ∗ArchitecturalScaling(Ci ) ∗ M axP ower T otalP ower =
(3)
The following metric computes a problem size independent floating point inefficiency value: IndependentF LP Stalls = (F P OP S/Retired Inst)∗ (4) (Stall Cycles/T otal Cycles) These metrics are calculated using PerfExplorer for each
n X
P ower(Ci ) + IdleP ower
(5)
(6)
i=0
In Eq. 5, power is computed for each component(Ci ) of the processor. The maximum power value is the published thermal design power (TDP) for the processor. The power for each component is weighted based on the access rates for the different cache levels and core logic. Table 2 lists the access rate metrics for each component. Eq. 6 computes the total power consumed by the processor and is based on the sum of the power consumed by n components and the
Components Core Logic L1 Cache L2 Cache L3 Cache
Metrics Total Instructions Retired/∆Cycles L1 Total Cache Access/∆Cycles L2 Total Cache Access/∆Cycles L3 Total Cache Access/∆Cycles
Table 2: Component access rate metrics. idle power. For multiprocessor or multicore systems, the total power across all processing elements can be modeled by summing the total power computed in Eq. 6 for each processor or core.
3.3
Components
Next we describe the components involved in the performance instrumentation, data gathering, database management, and performance and power analysis. Our ultimate goal is to provide components that automate all steps in the process of collecting and analyzing performance information, enabling the definition of custom analyses, such as identification of the sources of inefficiency or estimating power and energy use.
3.3.1
TAU Performance Component
The TAU performance analysis system includes a component for use in component applications [35]. This component addresses evaluation and optimization issues in highperformance component environments, through the use of wrappers and proxies. The wrapper approach builds on TAU’s dynamic performance mapping features. At the time port bindings are made by the CCA framework, it is possible to inform the port performance wrappers of the connection (i.e., user) identity. This can occur either at the user or provider interface, or both. With this information, a performance mapping can be created to associate measured performance data with the specific service invocation. The proxy approach creates a proxy component for each component the user wants to analyze. The proxy component shares the same interface as the actual component. When the application is composed and executed, the proxy is placed directly “in front” of the actual component. Since the proxy implements the same interface as the component, the proxy intercepts all of the method invocations for the component, and measures its performance.
3.3.2
Performance Database Components
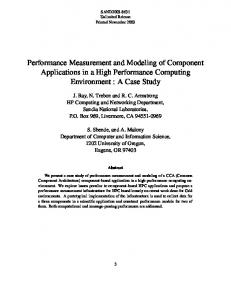
We have defined interfaces for storing and querying performance data and associated metadata (see Fig. 1). The DB interface provides methods for establishing a connection to a database, and storing and accessing data. The data is described through the Property and PropertySet interfaces. The comparator interfaces compare and/or match properties of two problems under user-specified conditions. A set of components implement these interfaces. In our current implementation, we are using the database component mainly to store performance data into the database at the end of an application run for later (offline) analysis with the PerfExplorer component described in Section 3.3.3. In the future, we plan to provide utility components based on the basic database component (whose interfaces are very close to generic SQL) to support domain-specific database
Figure 1: Database interfaces excerpt. operations.
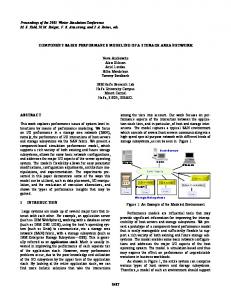
3.3.3 PerfExplorer Analysis Component We have created a simple component interface to the PerfExplorer engine. At present, the component accepts a Python analysis script as input, which contains the actual analysis implementation. The Ccaffeine GUI snapshot in Fig. 2 illustrates the current implementation. The next step is to design interfaces that allow the implementation of different components for analysis without having to rely on a separate Python script. This would enable greater flexibility, not only in terms of language choice, but in exposing more of PerfExplorer’s functionality through a multi-language API that is not restricted by Jython’s limitations.
3.3.4 The Application In our experiments we treated the application as a single black-box component. We instrumented the entire PETSc library with TAU and PDT. Work is in progress to extend the automated performance instrumentation to the TOPS interfaces and components [16, 50] and collecting the performance data automatically through the performance proxy
Figure 2: An example of an analysis component using the PerfExplorer component.
mechanism described in Section 3.3.1. In general, we cannot expect to have fully instrumented numerical libraries and must employ the performance proxy approach to automatically collect performance information for arbitrary computations.
4.
EXPERIMENTAL RESULTS
Our case studies were conducted on the Altix 3600. The Altix 3600 is a distributed-shared memory system consisting of 256 nodes with two Itanium 2 processors per node, for a total of 512 processors. A single address space is seen by all the processors/nodes and its global memory is based on a cache-coherent Non-Uniform Memory Access (ccNUMA) system implemented via the NUMAlink. Each node has a local memory; two nodes are connected via a memory hub to form a computational brick (C-brick). The C-bricks are connected via memory routers in a hierarchical topology. The Itanium 2 (Madison 9M) processor has 16 KB of Level 1 instruction cache and 16 KB of Level 1 data cache. The L2 cache is unified (both instruction and data) and is 256 KB. The Level 3 cache is also unified. The different characteristics of the main components of the Itanium 2 processor can be measured via the hardware counters.
4.1
Driven Cavity Flow Simulation
The Portable, Extensible Toolkit for Scientific Computing (PETSc) [5, 6] is a suite of numerical libraries for the parallel solution of scientific applications modeled by partial differential equations (PDEs). Our initial experiments in power issues for PETSc focus on the solution of largescale linear systems, which often dominates overall runtime for PDE-based applications. We profile a 2-D simulation of driven cavity flow [15], where the resulting system of nonlinear PDEs has the form f (u) = 0,
(7)
where f : Rn → Rn . We have selected this model problem because it has properties that are representative of many large-scale, nonlinear PDE-based applications in domains such as computational aerodynamics [1], astrophysics [18], and fusion [55]. We use fully implicit Newton-Krylov methods (see, e.g., [41]) to solve Equation (7) through the twostep sequence of (approximately) solving the Newton correction equation (f 0 (uk−1 )) δuk = −f (uk−1 ), in the sense that the linear residual norm ||f 0 (uk−1 ))δuk + f (uk−1 )|| is sufficiently small. and then updating the iterate via uk = uk−1 + δuk .
As mentioned earlier, the most time-consuming portion of the simulation is the solution of large, sparse linear systems of equations. Table 3 confirms this fact – the primary sources of inefficiency as determined by Eqs. 2 and 4 are methods used in the solution (and preconditioning) of the linear systems. The table shows events for which both efficiency metrics exceed the average by more than 50% and whose inclusive time accounts for more than 50% of the total wall clock time. I1 designates the derived metric value for the event computed by Eq. 2, while I1avg is the average value for that metric over all events. Similarly, I2 is the derived metric value computed by Eq. 4, and I2avg is the corresponding average value over all events. These results are for the weak scaling case, in which the problem size increases with the number of processors. P 1 2 4 8 16 32
Function KSPSolve KSPSolve KSPSolve KSPSolve MatLUFactorNumeric KSPSolve MatLUFactorNumeric KSPSolve MatLUFactorNumeric
I1/I1avg 2.21 1.73 1.76 1.52 1.73 1.26 1.53 1.26 1.53
I2/I2avg 8.89 4.22 3.38 2.27 2.74 1.52 1.52 1.52 1.52
% of T 56.72% 68.52% 79.07% 89.53% 55.74% 95.63% 71.63% 95.63% 71.63%
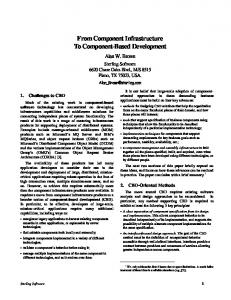
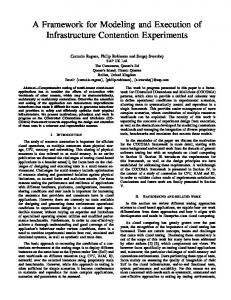
Table 3: The highest inefficiency regions in the driven cavity application, P designates the number of processors and T is the total wall clock time. The same methods are identified as having lower than average local to remote memory reference rations by using the memory stalls model described in Section 3.1; these are inherently memory-bound operations. The multigrid solution method performs a redundant sequential LU factorization at the coarse grid level, so the size of the matrix being factorized on each processor increases as the number of processors grows, resulting in the appearance of the MatLUFactorNumeric event as one of the top sources of inefficiency for tests involving more processors. To avoid this scalability issue, one could use a parallel LU method for solving the coarse problem, or could increase the number of levels in the multigrid solver as more processors are used to keep the coarse mesh size constant. Subsequently, the fine grid linear solution method becomes the main source of inefficiency. In the remainder of this section we focus on the effect of using different linear solution methods for the fine grid solution. We profiled three different linear system solution methods, using the performance and power models described in Section 3 to evaluate the effect of different solution methods on the performance and power use. Figure 3 shows the total execution time for the application when using each of three Krylov subspace linear solvers in conjunction with a multigrid preconditioner: FGMRES(30), GMRES(30), and BiCGS. The experiments were performed on the Cobalt Itanium cluster at the National Center for Supercompuing Applications at the University of Illinois at Urbana-Champaign. Figure 4 shows a metric derived from the power models described in Section 3.2. For one processor, the linear solution method with the best performance in terms of execution time (FGMRES) was not the best one in terms of power efficiency (rather, for a very small degradation of performance, BiCGS provides better efficiency in terms of FLOP/Joule). For larger number of processors, the best performing method
Figure 3: Total execution time of the driven cavity application. The problem size on each processor is 16 × 16 (weak scaling). among the three we tried is also the one with the best power efficiency. We should note that by default, the FGMRES method is used; the ability to easily try multiple methods and automatically evaluate their performance using any metrics of interest can lead to better performance without having to dedicate large amounts of developer time to analyzing the performance of the application.
feedback analysis in order to support more automated optimizations. Optimizing compilers often rely on analytical models of both applications and platforms to guide program transformations. The static estimate of execution cost provides support for finding optimal parameters for one optimization phase [37] and/or the best ordering of optimization phases [64]. Compiler-internal analytical models have many features in common with stand-alone performance analysis and prediction tools but are unique in that they must combine precision with high efficiency. Because of the increasing complexity of applications and hardware and the limited information available, versatile, accurate and fast compiletime cost modeling has always been a grand challenge for compiler developers. Energy/power models with various accuracies have been proposed for processors [10, 46, 59], memory subsystems [21, 30, 51], buses [69] and operating systems [33]. The main method [32,58] is to quantify power consumption per instruction and inter-instruction effects. Current power models work well for simple in-order, embedded processors and an energyaware compilation (EAC) framework [29] based on them was recently proposed. However, out-of-order superscalar processors pose significant challenges. In most cases, realistic power consumption evaluation relies on cycle-accurate simulators [3] extended with power models [11, 63]. The major difficulty in building effective cost models is the required deep knowledge of the applications, the platforms and their interactions. Modeling parallel programs is significantly harder, given the non-deterministic behavior of concurrent executing threads and their interactions. Multicore/multithreaded platforms add another level of difficulty to accurate modeling, even without energy-awareness. Our biggest future challenge, however, is to integrate the traditional model with a cost model for power. In practice, model-based optimizations are widely regarded to be less successful than empirical tuning [68] except when handling small kernels like the well-studied matrix-matrix multiplication. Thus, they may be used to complement dynamic compilation and empirical optimizations.
6.
Figure 4: FLOP/Joule for the driven cavity application.
5.
FUTURE DIRECTIONS: COMPILER PERFORMANCE AND POWER COST MODELING
We will continue evolving the component interfaces and corresponding implementations, both for database management and analysis. Based on our experiences with the current script-based PerfExplorer component, we will design SIDL interfaces for performance modeling that can eventually be used for interacting not just with PerfExplorer, but with other available performance analysis tools. Our future work will include the application of our performance and power measurement infrastructure for compiler
CONCLUSIONS
We have described the initial implementation of componentbased infrastructure for automated performance monitoring, data management, and analysis. We presented performance and power analysis results for a 2-D driven cavity simulation involving Newton-Krylov methods. Based on our early experiences with designing and implementing components for handling different tasks involved in performance and power analysis, we believe that combining the extensive functionality of tools such as TAU and PerfExplorer with componentbased software engineering can potentially greatly influence the efficiency and effectiveness of performance analysis and tuning of scientific applications. The ability to easily define derived performance metrics and analyses, as well as the automation of the difficult and time-consuming tasks involved in performance data gathering and analysis, will further allow compilers to gain access to information that can lead to more effective optimizations, targeting the metrics that reflect the application developers’ specific performance goals. The success of this effort will depend largely on the quality of the component interfaces for database access and performance analysis, as they must be able to eventually support
a wide range of applications and tools.
Acknowledgments This work was supported in part by the Mathematical, Information, and Computational Sciences Division subprogram of the Office of Advanced Scientific Computing Research, Office of Science, U.S. Dept. of Energy, under Contract DEAC02-06CH11357 and in part by a CISE-BPC supplement to NSF 0444345.University of Oregon research is sponsored by contracts DE-FG02-07ER25826 and DE-FG02-05ER25680 from the MICS program of the U.S. DOE, Office of Science and NSF grant #CCF0444475. University of Houston research is sponsored by the NSF grants #CCF-0444468 and #CCF-0702775. The authors wish to thank the following people for their discussions and implementation work: Dan Jackson, Lawrence Stewart, Canturk Isci, Sunita Chandrasekaran, and Danesh Tafti.
7.
ADDITIONAL AUTHORS
8.
REFERENCES
[1] W. K. Anderson, W. D. Gropp, D. K. Kaushik, and et al. Achieving high sustained performance in an unstructured mesh CFD application. In SC99, 1999. [2] M. Arnold, S. Fink, D. Grove, M. Hind, and P. F. Sweeney. Adaptive optimization in the jalapeno jvm. In OOPSLA ’00: Proceedings of the 15th ACM SIGPLAN conference on Object-oriented programming, systems, languages, and applications, pages 47–65, New York, NY, USA, 2000. ACM Press. [3] T. Austin, E. Larson, and D. Ernst. Simplescalar: An infrastructure for computer system modeling. Computer, 35(2):59–67, 2002. [4] A. Azevedo, R. Cornea, I. Issenin, R. Gupta, N. Dutt, A. Nicolau, and A. Veidenbaum. Architectural and compiler strategies for dynamic power management in the copper project. In IWIA ’01: Proceedings of the Innovative Architecture for Future Generation High-Performance Processors and Systems (IWIA’01), page 25, Washington, DC, USA, 2001. IEEE Computer Society. [5] S. Balay, K. Buschelman, V. Eijkhout, W. D. Gropp, D. Kaushik, M. G. Knepley, L. C. McInnes, B. F. Smith, and H. Zhang. PETSc users manual. Technical Report ANL-95/11 - Revision 2.3.3, Argonne National Laboratory, 2007. http://www.mcs.anl.gov/petsc. [6] S. Balay, W. D. Gropp, L. C. McInnes, and B. F. Smith. Efficient management of parallelism in object oriented numerical software libraries. In E. Arge, A. M. Bruaset, and H. P. Langtangen, editors, Modern Software Tools in Scientific Computing, pages 163–202. Birkh¨ auser Press, 1997. [7] D. E. Bernholdt, B. A. Allan, R. Armstrong, F. Bertrand, K. Chiu, T. L. Dahlgren, K. Damevski, W. R. Elwasif, T. G. W. Epperly, M. Govindaraju, D. S. Katz, J. A. Kohl, M. Krishnan, G. Kumfert, J. W. Larson, S. Lefantzi, M. J. Lewis, A. D. Malony, L. C. McInnes, J. Nieplocha, B. Norris, S. G. Parker, J. Ray, S. Shende, T. L. Windus, and S. Zhou. A component architecture for high-performance scientific computing. Int. J. High-Perf. Computing Appl., ACTS Collection special issue, 20:163–202, 2006.
[8] W. Bircher and L. John. Complete system power estimation: A trickle-down approach based on performance events. In ISPASS 2007: IEEE International Symposium on Performance Analysis of Systems & Software, pages 158 – 168, April 25-27 2007. [9] W. L. Bircher, M. Valluri, J. Law, and L. K. John. Runtime identification of microprocessor energy saving opportunities. In ISLPED ’05: Proceedings of the 2005 international symposium on Low power electronics and design, pages 275–280, New York, NY, USA, 2005. ACM. [10] C. Brandolese, W. Fornaciari, F. Salice, and D. Sciuto. An instruction-level functionally-based energy estimation model for 32-bits microprocessors. In Design Automation Conference, pages 346–351, 2000. [11] D. Brooks, V. Tiwari, and M. Martonosi. Wattch: a framework for architectural-level power analysis and optimizations. In ISCA ’00: Proceedings of the 27th annual international symposium on Computer architecture, pages 83–94, New York, NY, USA, 2000. ACM Press. [12] V. Bui, O. Hernandez, B. Chapman, R. Kufrin, D. Tafti, and P. Gopalkrishnan. Towards an implementation of the OpenMP collector API. In PARCO, 2007. [13] K. W. Cameron, R. Ge, and X. Feng. High-performance, power-aware distributed computing for scientific applications. Computer, 38(11):40–47, 2005. [14] Common Component Architecture (CCA) Forum. http://www.cca-forum.org/. [15] T. S. Coffey, C. T. Kelley, and D. E. Keyes. Pseudo-transient continuation and differential-algebraic equations. SIAM J. Sci. Comput., 25(2), 2003. [16] D. Keyes (PI). Terascale Optimal PDE Simulations (TOPS) Center. http://tops-scidac.org/, 2006. [17] N. Eisley, V. Soteriou, and L.-S. Peh. High-level power analysis for multi-core chips. In CASES ’06: Proceedings of the 2006 international conference on Compilers, architecture and synthesis for embedded systems, pages 389–400, New York, NY, USA, 2006. ACM. [18] B. Fryxell, K. Olson, P. Ricker, and et al. FLASH: An adaptive-mesh hydrodynamics code for modeling astrophysical thermonuclear flashes. Astrophys. J. Suppl., 2000. [19] D. Griswold. The java hotspot virtual machine architecture, 1998. [20] O. Hernandez, F. Song, B. Chapman, J. Dongarra, B. Mohr, S. Moore, and F. Wolf. Instrumentation and compiler optimizations for MPI/OpenMP applications. In International Workshop on OpenMP (IWOMP 2006), 2006. [21] P. Hicks, M. Walnock, and R. M. Owens. Analysis of power consumption in memory hierarchies. In ISLPED ’97: Proceedings of the 1997 international symposium on Low power electronics and design, pages 239–242, New York, NY, USA, 1997. ACM Press. [22] K. Huck, O. Hernandez, V. Bui, S. Chandrasekaran, B. Chapman, A. D. Malony, L. McInnes, and
[23]
[24]
[25]
[26]
[27]
[28]
[29]
[30]
[31]
[32]
[33]
[34]
[35]
B. Norris. Capturing performance knowledge for automated analysis. In Supercomputing, 2008 (under review). K. Huck, A. Malony, R. Bell, and A. Morris. Design and implementation of a parallel performance data management framework. In Proceedings of the International Conference on Parallel Computing, 2005 (ICPP2005), pages 473–482, 2005. K. A. Huck and A. D. Malony. PerfExplorer: A performance data mining framework for large-scale parallel computing. In Conference on High Performance Networking and Computing (SC’05), Washington, DC, USA, 2005. IEEE Computer Society. C. Isci and M. Martonosi. Runtime power monitoring in high-end processors: Methodology and empirical data. In Proceedings of the 36th Annual IEEE/ACM international Symposium on Microarchitecture, December 03-05 2003. C. Isci and M. Martonosi. Runtime power monitoring in high-end processors: methodology and empirical data. In 36th Annual IEEE/ACM International Symposium on Microarchitecture ( MICRO-36), 2003. M. Itzkowitz. The sun studio performance tools. Technical report, Sun Microsystems Inc., November 2005. S. Jarp. A methodology for using the itanium-2 performance counters for bottleneck analysis. Technical report, HP Labs, August 2002. I. Kadayif, M. Kandemir, G. Chen, N. Vijaykrishnan, M. J. Irwin, and A. Sivasubramaniam. Compiler-directed high-level energy estimation and optimization. Trans. on Embedded Computing Sys., 4(4):819–850, 2005. M. B. Kamble and K. Ghose. Analytical energy dissipation models for low-power caches. In ISLPED ’97: Proceedings of the 1997 international symposium on Low power electronics and design, pages 143–148, New York, NY, USA, 1997. ACM Press. R. Kufrin. PerfSuite: An accessible, open source, performance analysis environment for Linux. In 6th International Conference on Linux Clusters (LCI-2005), Chapel Hill, NC, April 2005. S. Lee, A. Ermedahl, and S. L. Min. An accurate instruction-level energy consumption model for embedded risc processors. In LCTES ’01: Proceedings of the ACM SIGPLAN workshop on Languages, compilers and tools for embedded systems, pages 1–10, New York, NY, USA, 2001. ACM Press. T. Li and L. K. John. Run-time modeling and estimation of operating system power consumption. In SIGMETRICS ’03: Proceedings of the 2003 ACM SIGMETRICS international conference on Measurement and modeling of computer systems, pages 160–171, New York, NY, USA, 2003. ACM Press. C. Liao, O. Hernandez, B. Chapman, W. Chen, and W. Zheng. OpenUH: An optimizing, portable OpenMP compiler. In 12th Workshop on Compilers for Parallel Computers, 2006. A. Malony, S. Shende, N. Trebon, J. Ray, R. Armstrong, C. Rasmussen, and M. Sottile. Performance technology for parallel and distributed component software. Concurrency and Computation:
Practice and Experience, 17:117–141, Feb - Apr 2005. [36] L. C. McInnes, J. Ray, R. Armstrong, T. L. Dahlgren, A. Malony, B. Norris, S. Shende, J. P. Kenny, and J. Steensland. Computational quality of service for scientific CCA applications: Composition, substitution, and reconfiguration. Technical Report ANL/MCS-P1326-0206, Argonne National Laboratory, Feb 2006. [37] K. S. McKinley, S. Carr, and C.-W. Tseng. Improving data locality with loop transformations. ACM Trans. Program. Lang. Syst., 18(4):424–453, 1996. [38] J. Mellor-Crummey, R. Fowler, G. Marin, and N. Tallent. Hpcview: A tool for top-down analysis of node performance. The Journal of Supercomputing, 23:81–101, 2002. Special Issue with selected papers from the 2001 Los Alamos Computer Science Institute Symposium. [39] B. Mohr and F. Wolf. KOJAK - a tool set for automatic performance analysis of parallel applications. In Proc. of the European Conference on Parallel Computing (EuroPar), pages 1301–1304, 2003. [40] W. E. Nagel, A. Arnold, M. Weber, H.-C. Hoppe, and K. Solchenbach. VAMPIR: Visualization and analysis of MPI resources. SUPERCOMPUTER, 12(1):69–80, January 1996. [41] J. Nocedal and S. J. Wright. Numerical Optimization. Springer-Verlag, 1999. [42] B. Norris, J. Ray, R. Armstrong, L. C. McInnes, D. E. Bernholdt, W. R. Elwasif, A. D. Malony, and S. Shende. Computational quality of service for scientific components. In Proc. Int. Symp. on Component-Based Software Engineering, Edinburgh, Scotland, 2004. [43] Pallas GmbH. Vampirtrace 2.0 Installation and User’s Guide, November 1999. [44] Perfsuite. http://perfsuite.ncsa.uiuc.edu/. [45] V. Pillet, J. Labarta, T. Cortes, and S. Girona. PARAVER: A Tool to Visualize and Analyze Parallel Code. In P. Nixon, editor, Proceedings of WoTUG-18: Transputer and occam Developments, pages 17–31, March 1995. [46] G. Qu, N. Kawabe, K. Usarni, and M. Potkonjak. Function-level power estimation methodology for microprocessors. In 37th Design Automation Conference, 2000. [47] J. S. Seng and D. M. Tullsen. The effect of compiler optimizations on pentium 4 power consumption. In INTERACT ’03: Proceedings of the Seventh Workshop on Interaction between Compilers and Computer Architectures, page 51, Washington, DC, USA, 2003. IEEE Computer Society. [48] S. Shende, A. Malony, A. Morris, S. Parker, and J. de St. Germain. Performance Evaluation of Adaptive Scientific Applications using TAU. In Parallel Computational Fluid Dynamics - Theory and Applications, pages 421–428. Elsevier B.V., 2006. [49] S. Shende and A. D. Malony. The tau parallel performance system. International Journal of High Performance Computing Applications, 20(2):287–331, 2006. [50] B. Smith et al. TOPS Solver Components. http://www.mcs.anl.gov/scidac-tops/
solver-components/tops.html, 2005. [51] C.-L. Su and A. M. Despain. Cache design trade-offs for power and performance optimization: a case study. In ISLPED ’95: Proceedings of the 1995 international symposium on Low power design, pages 63–68, New York, NY, USA, 1995. ACM Press. [52] T. Suganuma, T. Yasue, M. Kawahito, H. Komatsu, and T. Nakatani. Design and evaluation of dynamic optimizations for a java just-in-time compiler. ACM Trans. Program. Lang. Syst., 27(4):732–785, 2005. [53] C. Szyperski. Component Software: Beyond Object-Oriented Programming. ACM Press, New York, 1999. [54] D. K. Tafti and G. Wang. Application of embedded parallelism to large scale computations of complex industrial flows. In Proceedings of the ASME Fluids Engineering Division, pages 123–130, Anaheim, CA., November 1998. ASME-IMECE. [55] X. Z. Tang, G. Y. Fu, S. C. Jardin, and et al. Resistive magnetohydrodynamics simulation of fusion plasmas. Technical Report PPPL-3532, Princeton Plasma Physics Laboratory, 2001. [56] C. Tapus, I.-H. Chung, and J. K. Hollingsworth. Active harmony: towards automated performance tuning. In Supercomputing ’02: Proceedings of the 2002 ACM/IEEE conference on Supercomputing, pages 1–11, Los Alamitos, CA, USA, 2002. IEEE Computer Society Press. [57] The R Foundation for Statistical Computing. R Project for Statistical Computing. http://www.r-project.org, 2007. [58] V. Tiwari, S. Malik, and A. Wolfe. Power analysis of embedded software: a first step towards software power minimization. IEEE Trans. Very Large Scale Integr. Syst., 2(4):437–445, 1994. [59] V. Tiwari, S. Malik, A. Wolfe, and M. T.-C. Lee. Instruction level power analysis and optimization of software. J. VLSI Signal Process. Syst., 13(2-3):223–238, 1996. [60] H. Truong and T. Fahringer. Scalea: a performance analysis tool for parallel programs. Concurrency and Computation: Practice and Experience, 15(11-12):1001–1025, 2003. [61] M. Valluri and L. John. Is compiling for performance == compiling for power, 2001. [62] V. Venkatachalam and M. Franz. Power reduction techniques for microprocessor systems. ACM Comput. Surv., 37(3):195–237, 2005. [63] N. Vijaykrishnan, M. Kandemir, M. J. Irwin, H. S. Kim, and W. Ye. Energy-driven integrated hardware-software optimizations using simplepower. In ISCA ’00: Proceedings of the 27th annual international symposium on Computer architecture, pages 95–106, New York, NY, USA, 2000. ACM Press. [64] D. L. Whitfield and M. L. Soffa. An approach for exploring code improving transformations. ACM Trans. Program. Lang. Syst., 19(6):1053–1084, 1997. [65] I. H. Witten and E. Frank. Data Mining: Practical Machine Learning Tools and Techniques. Morgan Kaufmann, San Francisco, 2nd edition, 2005. http://www.cs.waikato.ac.nz/~ml/weka/.
[66] F. Wolf and B. Mohr. Automatic performance analysis of hybrid mpi/openm p applications. Journal of Systems Architecture: the EUROMICRO Journal, 49(10-11):421–439, 2003. [67] A. Wolfe. Toolkit: Intel’s heavy-duty dev tools. Queue, 2(2):12–17, 2004. [68] K. Yotov, X. Li, G. Ren, M. Cibulskis, G. DeJong, M. Garzaran, D. Padua, K. Pingali, P. Stodghill, and P. Wu. A comparison of empirical and model-driven optimization. In PLDI ’03: Proceedings of the ACM SIGPLAN 2003 conference on Programming language design and implementation, pages 63–76, New York, NY, USA, 2003. ACM Press. [69] Y. Zhang, R. Chen, W. Ye, and M. Irwin. System level interconnect power modeling. In Eleventh Annual IEEE International ASIC Conference, 1998.
The submitted manuscript has been created by UChicago Argonne, LLC, Operator of Argonne National Laboratory (”Argonne”). Argonne, a U.S. Department of Energy Office of Science laboratory, is operated under Contract No. DE-AC0206CH11357. The U.S. Government retains for itself, and others acting on its behalf, a paid-up, nonexclusive, irrevocable worldwide license in said article to reproduce, prepare derivative works, distribute copies to the public, and perform publicly and display publicly, by or on behalf of the Government.