Performance Modeling of a JavaEE Component Application using Layered Queuing Networks: Revised Approach and a Case Study Alexander Ufimtsev
Liam Murphy
Performance Engineering Laboratory School of Computer Science and Informatics, University College Dublin, Belfield, D4, Ireland
Performance Engineering Laboratory School of Computer Science and Informatics, University College Dublin, Belfield, D4, Ireland
[email protected]
[email protected]
ABSTRACT Nowadays component technologies are an integral part of any enterprise production environment. Performance and scalability are among the key properties of such systems. Using Layered Queuing Networks (LQN), one can predict the performance of a component based system from its design. This work revises the approach of using LQN templates, and offers a case study by using the revised approach to model a realistic component application.
Categories and Subject Descriptors D.2.13 [Software Engineering]: Reusable Software—Reuse models; D.2.1 [Software Engineering]: Requirements/ Specifications—Methodologies; D.2.8 [Software Engineering]: Metrics—Performance measures; D.2.9 [Software Engineering]: Management—Software quality assurance
software layers. Such complexity makes it difficult to provide software performance guarantees - moving functionality to middleware and third party components reduces the overall understanding of the system. Nowadays ’buggy’ and poorly implemented code contributes less problems to enterprise software development than a problematic architecture or ”short-sighted design”, as well as poor capacity planning [9]. Unfortunately, design problems are not easily resolvable at the final development stages. Therefore, a system designer should be able to assess the performance properties of the system (both software and hardware) early. He or she needs to ’plan ahead’, leaving room for possible future improvements and requirement changes.
performance modeling, JavaEE, component systems, ECPerf, Layered Queuing Network.
Use of Layered Queuing Networks for modeling of componentbased software can help system designers to assess the outcome of performance decisions, starting from very early stages of development. This work builds upon ’layered queuing network templates’ [8, 11] by analyzing key strengths and weaknesses of the approach and also by conducting a case study on a realistic application.
1.
2. LQN OVERVIEW
Keywords
INTRODUCTION AND MOTIVATION
Many large software development projects fail to deliver the product on time, within budget, and with satisfactory QoS. Useful software engineering practices such as model checking, verification, and continuous testing help satisfy the functional requirements of the projects. However, some of the non-functional requirements can only be checked when integrated with other components and during system testing, which is typically done during the final stages of development. Performance is one of the non-functional requirements that is commonly difficult to check outside a test environment.
Layered Queuing Networks (LQN) is an extension of Queuing Networks that allows the software to be represented in layers, thus separating resources from a model and dividing a model into multiple submodels. LQN is abstract enough not to suffer from drawbacks of other popular formalisms, notably Stochastic Petri Nets (SPN). Basic LQN notation consists of three basic elements: circles denote resource type (CPU, disk, network), rectangles - software blocks. The right rectangle usually denotes an object/bean, while rectangles to the left from it denote an action happening with that object, such as method or function call. Also, control rectangle usually indicates the type of resource it utilizes. Arrows depict control flow within the network.
Software products nowadays include various components developed by third parties and running on a stack of multiple Permission to make digital or hard copies of all or part of this work for personal or classroom use is granted without fee provided that copies are not made or distributed for profit or commercial advantage and that copies bear this notice and the full citation on the first page. To copy otherwise, to republish, to post on servers or to redistribute to lists, requires prior specific permission and/or a fee.
Key advantages of LQN:
Fifth International Workshop on Specification and Verification of Component-Based Systems (SAVCBS 2006), November
• Layered architecture of LQN ’naturally’ maps to componentized, multi-tiered, and multi-layered enterprise level software stacks;
10-11, 2006, Portland, Oregon, USA. Copyright 2006 ACM ISBN 1-59593-586-X/06/11 ...$5.00.
• LQN is easily extend able to include newly discovered 11
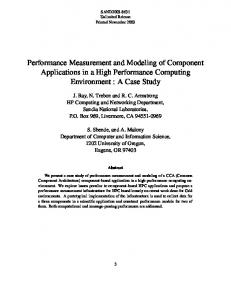
is currently available from SPEC under the name of SPECjAppServer2004. ECPerf is designed to be a typical enterprise application. It has four implemented domains in its code: Manufacturing, Supplier & Service Provider, Customer, and Corporate. Each domain has separate database and applications. They provide the foundation for the ECperf workload. Customers contact the business through any number of methods, including directly through the web. All of the worldwide offices and plants make frequent access to data held in the other offices or plants, and must, at times, compare/collate/verify their data against that held worldwide. The company also interacts with completely separate supplier companies. Each supplier has its own independent set of computing resources. The overall setup can be seen in Figure 1.
bottleneck resource or device into existing model; • LQN avoids state explosion as some other formalisms (SPN-like) via higher level of abstraction; • LQN is a formalism and provides robust analytical and simulation-based tools. LQN’s disadvantages: • Does not allow any type of dynamism in the running system, provides only steady state solutions; • Does not have a notion or possibility to model timeouts, locks, and workload variation within a run. To introduce some sort of dynamism to LQN one must have to solve LQN for different states first and then bind them together with a form of Markov chain, with probability of the system changing its state from one to another. • Requires a lot of data to be accurately collected, interpreted, and put into a model to produce accurate results.
3.
PROBLEM STATEMENT AND APPROACH
The purpose of this work was to understand how suitable were LQN templates for modeling JavaEE applications and what improvements to the approach are needed. Java Enterprise Edition (JavaEE) is a superset of Java Standard Edition (JavaSE), designed for multi-tier solutions [6]. It provides developers with the underlying infrastructure required by the enterprise systems. J2EE’s core is a family of component models: on the client side, JavaBeans and applets; on the web server tier, J2servlets and Java Server Pages (JSPs); on the application server tier Enterprise JavaBeans (EJB).
Customer Domain This domain emulates business interactions with the clients. Clients can be of two types: individuals and distributors. Both interact with by placing orders. The difference between the two is in the quantity of items ordered. Approximately 57% of work on the system is related to orders from distributors (i.e contain large number of items), 43% is from individual customers. Customer domain implementation of ECperf contains seven beans: OrderSes, OrderEnt, OrderLineEnt, ItemEnt, OrderCustomerSes, OrderCustomerEnt, and CartSes.
Java EE’s ECperf application was selected to be modeled for a number of reasons. First, ECperf is an industrystandard JavaEE benchmark meant to measure the scalability and performance of JEE servers and containers. It stresses the ability of EJB containers to handle the complexities of memory management, connection pooling, passivation/activation, and caching. ECperf is highly portable and runs on majority of application servers, which makes it perfect for future evaluation of the approach on different software and hardware configurations. Second, ECPerf creators stress its ability to represent real-life business applications. ECPerf is designed as a typical web business application that permits customers direct specification of product configuration, ordering, and status checking. It also automates manufacturing, inventory, supplier chain management, and customer billing. Third, as a benchmark application it provides necessary workload drivers and all the performance data aggregators in useful and professional manner.
4.
Manufacturing Domain The manufacturing domain emulates business product lines, which process the orders received by customer domain. There are two types of production lines: Planned lines and Largeorder lines. The planned lines run on schedule and produce a pre-defined number of widgets. On the other hand, the largeorder lines run only when a large order is received from a customer such as a distributor. This domain is implemented with ten beans: WorkOrderSes, LargeOrderSes, ReceiveSes, PartEnt, AssemblyEnt, WorkOrderEnt, LargeOrderEnt, ComponentEnt, InventoryEnt, and BOMEnt. Supplier Domain The Supplier Domain decides which supplier to choose based on the parts that need to be ordered, the time in which they are required and the price quoted by suppliers. It is implemented in the system with seven beans: BuyerSes, ReceiverSes, SupplierEnt, SupplierComponentEnt, POEnt, POLineEnt, and SComponentEnt.
APPLICATION DESIGN
Originally developed by Sun Microsystems, ECPerf is now being developed and maintained by SPEC Corporation1 . It 1
Figure 1: High-Level Overview of Testing System
http://www.spec.org 12
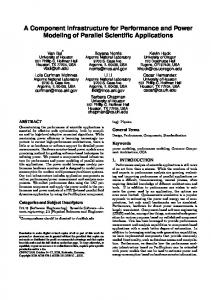
ECperf workload is generated by so-called ’Driver’ script, that runs ’agents’. Standard ECperf configuration features three agents, one per domain: ordersAgent (customers), mfgAgent (manufactures), and loAgent (large orders). Strictly speaking, loAgent is not a new domain, but rather belongs to both customers and manufactures. Agents, in their turn, start up and control the client instances that issue requests to the servers (See Figure 2). The number of planned lines and order lines depends on scale parameter.
Table 1: Top cumulative time-consuming methods Time (%) Domain Name WorkOrderEnt.process 19 mfg mfg WorkOrderCmpEJB.process 19 WorkOrderSesEJB.scheduleWO 16.1 mfg supplier BuyerSes.purchase 5.3 5.3 supplier BuyerSesEJB.purchase ComponentEnt.takeInventory 5.3 mfg orders OrderSesEJB.newOrder 5.3 orders OrderEntHome.create 5.3 OrderCmpEJB.ejbCreate 5.3 orders WorkOrderSesEJB.scheduleWO 4.8 mfg
Table 2: Top average method time Domain mfg orders supplier mfg orders
Name WorkOrderEntHome.create OrderCustomerEntHome.create ReceiverSesHome.create WorkOrderEntHome.create OrderCustomerEntHome.findByPK
Time (%) 0.4 0.2 0.1 0.1 0.1
Figure 2: ECperf Workload Overview All the loops wait for a certain period of time. It is hardcoded for one second for large order agent, configured to 100 ms for mfgAgent and for orderEntry it is set to a negative exponential distribution
Corporate Domain
T c = −ln(x)/Ir
This domain manages the global list of customers, parts and suppliers and is implemented in three beans: CustomerEnt, DiscountEnt, RuleEnt. The domain is used for obtaining customer credit status, various discounts and billing.
5.
where ln - natural log (base e), x - random number with at least 31 bits of precision, Ir - mean Injection Rate. Figure 3 shows an overview of manufacturing activity in LQN notation. System sleep is necessary to introduce emulation of activity stations that gradually change workorder state from ’scheduled’ to ’updated’, and finally to ’completed’. WorkOrderSes session bean also creates, searches, and updates a few entity beans.
PERFORMANCE AND CODE ANALYSIS
While performing analysis it is important to concentrate on so-called ”critical paths” within the system. Critical paths in ECPerf were obtained by analysing its source code and execution traces while running the system with minimal possible workload. The latter was necessary to avoid abnormal behavior due to monitoring overhead and clarity of the derived call graph. It should be noted that despite the use of smallest possible workload the amount of users in the system was equal to eight. Therefore, concurrent resource usage behavior was preserved. The source code was analysed using Juliet 2 , while execution graph and times were obtained with JProbe 3 tool. The measurements had shown that that only two domains make a significant performance impact: cumulative execution time of beans in manufacturing and customer domains consume around 80% of overall ECPerf execution time (See Table 1). The other two domains did not seem to have any significant influence on the overall system performance. Also, Table 2 shows top five non-cumulative averaged method times. It can be noted that even the worst performing individual methods use very little resources on their own. Since a lot of complex services was pushed to middleware, what becomes important is the ”orchestration” of services provided by other methods and containers.
Figure 3: High-level overview of Manufacturer System Activity
5.1 Workload Generation 2 3
(1)
Large orders agent just pulls information from the database about large orders once per second and updates its statistics
http://infotectonica.com/ http://jprobe.quest.com 13
the model was chosen as an average of the real database size before and after test run. We presume this is correct since database never becomes a bottleneck device throughout the test. We also had to average in all the retries and transaction rollback that happened. The rest of the testsuit was modeled using the following refined principles: • Communication is broken into two types: local and remote. Remote one is modeled with a network resource/processor. Local calls that don’t exercise Remote Method Invocation (RMI) are modeled as simple LQN calls without any resource consumption.
Figure 4: Large Orders Agent activity
• Container services is an aggregate term for any additional activities performed by container. It is not modeled separately, but spread across execution times.
Order entry represents a significant amount of system activity. The stream of order entry transactions is split in the following way:
• Reflection - included in container services times.
• newOrder - 50%
• Connection pooling - two essential queues are modeled: container threads and database threads.
• getOrderStatus - 20% • changeOrder - 20%
• Transaction manager - again, included in overall container services for model simplicity. No specific model for the actually transaction rollback is specified.
• getCustStatus - 10%
• Security - security checks are modeled with submodels of beans.
There is also 10% chance that order is going to be large, 50% chance that people buy goods right away and another %50 - that they will use a shopping cart. In 90 percent of cases, people delete the content of their shopping cart. The Metric for the Customer Domain is Transactions/min. The metric for the Manufacturing Domain isWorkorders/min, whether produced on the Planned lines or on the LargeOrder lines. The numbers described are based on real world experience of Sun Microsystems building typical enterprise applications. This particular transaction mix and probabilities of state changes is built into ECPerf and should not be altered.
• Garbage Collection (GC) is not addressed in the current version of model, since the complexity and closed source code of JVM makes it hard to derive correct models. GC time is generally spread across container services. • Naming - modeled through container services • Database - modeled with an average response time. It is possible, however, to model it with any specified distribution of response times.
newOrder call path is presented in Figure 5. Please note that other paths, such as changeOrder, orderStatus, customerStatus, and createNewShoppingCart were not expanded due to cluttering of space. Numbers on call arrows show probabilities.
6. MODELING APPROACH The proof of concept use of LQN for modeling of EJB-based applications has been demonstrated by Xu et al. [11]. Produced LQN-EJB templates can be instantiated according to specific function requirement in each scenario for system usage, and then be assembled into a complete LQN model for the whole scenario. General information on functional aspects of EJB technology as well as specific models for each bean type were presented in [11].
5.2 Addressing Ambiguity A few features or implementation details of ECperf presented a modeling challenge. First, since ECperf was designed after typical web-based enterprise applications, it intentionally did not keep the database size stable. In fact, it kept growing throughout each test and had to be reinitialized before a new one. Second, even the initial database size, e.g. the initial number of customers and products depends on the expected (configurable) workload. This is another reason why databases have to be swept clean and repopulated with data upon startup of another test. Third, ECperf authors made some provisions for unstable environment. If a transaction fails for whatever reason (timeouts, database lock, etc.), ECperf handles this exception and retries it from 5 to 20 times before failing.
A system is modeled by presenting the beans as tasks with estimated parameters, then instantiating the template to wrap each class of beans in a container, and finally adding the execution environment including the database. Calls between beans, and calls to the database, are part of the final assembly. The model may be calibrated from running data, or by combining • knowledge of the operations of each bean; • pre-calibrated workload parameters for container services, communication, and database operations.
All of the above uncertainties had to be abstracted in order to keep the scope of the use case feasible. Database size for 14
Figure 5: Part of the Orders Domain
15
7.
MODEL CALIBRATION AND TESTING
7.1 Hardware platform The testing environment includes four x86 machines: • application server Pentium III-866 Mhz with 512 Mb RAM; • database Pentium III-800Mhz with 512 Mb RAM; and client • client Pentium IV-2.2 Ghz, 1024 Mb RAM. The client machine is more or as powerful as servers to ensure it does not become a bottleneck when generating the test load.
7.2 The software environment The following software was used for testing purposes: • operating system: Debian GNU/Linux 3.1 ’sarge’, kernel v 2.6.8-3;
Figure 6: Results of ECPerf benchmarking
• database server : MySQL v. 5.0.7beta-1; • application server : JBoss v. 4.01sp1; • JVM : Java2SDK 1.4.2 09. Measurements on the container and program execution were obtained by running JProbe 5.2.1 Freeware profiler for Linux. The following options were used for JVM startup: • The initial Java heap size was 480M B; • parameter -XX:+PrintCompilation was set to monitor the runtime behavior of the JVM.
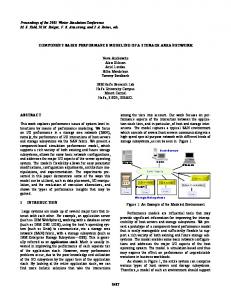
7.3 Benchmarking results Performance benchmarking of ECPerf produced the following results (See Figure 6). The X-axis shows the value of SCALE parameters while Y-axis shows the number of business operations per minute (BBops/min). Scale value is not equal to number of users, but rather user num = f (scale). In our case, user num = 5 ∗ scale. The minimal number of users in the system is 5, and the maximum measured is 250. The second line of in benchmarking figure shows standard deviation of the results obtained. It can be noted that results become quite unstable once SCALE goes over 10, while overall performance does not seem to increase. Also, once load reaches 50 users (SCALE=10) the system starts producing errors (time outs, etc) due to overload. Therefore, system achieves its peak performance with SCALE=7, or 35 users. Figure 7 shows response times for Manufacturing and Orders for the respective workload.
Figure 7: Response Time of ECPerf
16
7.4 Resource Utilization
load reaches its peak, some transactions might timeout and be subsequently retried. Since transactions are resourceexpensive, it might deviate the system’s throughput away from the ’ideal’ situation as demonstrated by the model.
Various resource were used during benchmarking, including CPUs of the test machines, network, HDDs, etc. Except for SCALE=1, the CPU of the application server was the bottleneck. CPU usage of client and db machines reached 17 percent at max with average utilization of 5-7 per cent. Network utilization was around 1%. Disk usage for both database and application server was also negligible.
7.5 Model Calibration The model constructed in Section 7 was calibrated from the profiling data under a minimal workload. During the measurement phase JProbe profiling tool introduced significant overhead, so the execution demand values extracted from profiling data are adjusted to remove the contribution of overhead. This was done by using a Profiling Ratio Factor (PFC) based on the assumption that the profiling overhead is proportionally distributed across the operations within some section of the scenario. The factor was obtained for each section by measuring the service time with and without profiling and taking the ratio. For the configuration of Jboss, PFC varied from 1 (for low-level operations) to 7.49 for business method related operations. Ultimately, when profiling was on and every method call in JBoss and ECperf was logged, the response times slowed down 7.49 times. By proportionally dividing each response time obtained with the monitoring on PFC, we can get averaged execution times for individual methods. It should be noted that this approach becomes highly inaccurate for monitoring a lot of methods simultaneously. The best results are shown when P F C → 1, which happens when monitoring is turned on for a very small number of methods 1...10.
Figure 8: ECPerf Response Time
8. RELATED WORK The following solutions have been offered so far. Lui et al. [7] proposed a method for predicting performance of J2EE applications at design level, which seems to rely mostly on profiling information instead of models. Denaro et al. [2] came up with generic framework for performance testing of distributed component architectures. The evaluation of the approach is not formal and based on creating a stub application, which then is run in the real environment.
The problems also included the fact that the cycle times in ECPerf were very dynamic and depended on the response time.
9. CONCLUSIONS AND FUTURE WORK We have presented an evaluation of a Layered Queuing Network (LQN) templates approach by building a model of ECPerf - a JavaEE component application. Various modeling problems have been addressed within the limitations allowed by LQN formalism. We showed that despite our efforts, ECperf performance prediction model was overoptimistic when compared to a real system. This suggests a missed resource congestion point due to inaccurate modeling assumptions or LQN limitations.
7.6 Result Analysis Calibrated LQN simulation gave quite close results to the tested real-life configuration (See Figure 8). The upper line is a modeled result, while the lower - a real system test, which is identical to Figure 6 on the scale from 1 to 7. The modeled results were aggregated using predefined data in Subsection 5.1. For small and average workloads the LQN results were a bit more pessimistic than real ones, but they are quite close. We consider that a good result taking into account that measurements for the model where conducted on the system only once with minimum workload possible, e.g. SCALE = 1. However, at the higher loads LQN result becomes more optimistic. The worrying trend is that LQN model continues to predict higher performance than the real system. At SCALE = 7 the real system reaches its optimal workload and its throughput stabilises. The LQN model shows almost linear increase in predicted performance. We were unable to identify the reasons for such behavior, though we noticed that the variance for the overall response time in the model greatly increased when the workload reached its peak. This could be due to lack of locking in LQN, or a missed bottleneck in the model. The most likely ’offenders’ are transaction and security features of application server, and database record locking. We suspect that when the
We plan to improve the existing model by adding JavaEE container services, such as transaction & security. This way we hope to eliminate the current inaccuracies within the LQN templates model. Additional services outside JVM layer can also be added to the model. For instance, Virtual Memory Manager was shown to have a significant effect on component-based application performance [10].
10. ACKNOWLEDGMENT The support of the Informatics Commercialization initiative of Enterprise Ireland is gratefully acknowledged.
11. REFERENCES [1] Cecchet, E., Marguerite, J., Zwaenepoel, W.: Performance and Scalability of EJB Applications Proc of 17th ACM Conference on Object-Oriented Programming, Seattle, Washington, (2002). 17
[2] Denaro, G., Polini, A., and Emmerich, W.: Early performance testing of distributed software applications Proc of the Fourth international Workshop on Software and Performance, Redwood Shores, California, (2004) 94-103 [3] Descripton of LQN XML Schema http://www.sce.carleton.ca/rads/lqn/lqndocumentation/schema/ [4] ECperf Kit Sun Microsystems http://java.sun.com/developer/releases/j2ee/ecperf/ [5] Gorton, I., Liu, A.: Performance Evaluation of Alternative Component Architectures for Enterprise JavaBean Applications in IEEE Internet Computing, vol.7, no. 3, pages 18-23, 2003 [6] Java Enterprise Edition Sun Microsystems http://java.sun.com/javaee/ [7] Liu, Y., Fekete, A., Gorton, I.: Predicting the Performance of middleware-based applications at the design level Proc of Fourth International Workshop on Software and Performance, Redwood Shores, California (2004) 166-170. [8] Oufimtsev, A. and Murphy, L.: Predicting Performance of EJB-based Systems Using Layered Queueing Networks Proc. of OOPSLA conference, ACM, Oct. 2004 (poster) [9] The State of J2EE Application Management: Analysis of 2003 Benchmark Survey Survey Analysis by Ptak, Noel & Associates http://ptaknoelassociates.com/members/J2EE app mgmt survey.pdf [10] Ufimtsev, A., Murphy, L., Kucharenka A.: Impact of Virtual Memory Managers on Performance of J2EE Applications In Proceedings of Component-Based Software Engineering (CBSE) conference, Vesteras, Sweden, June 2006 [11] Xu, J., Oufimtsev, A., Woodside, M., Murphy, L.: Performance Modeling and Prediction of Enterprise JavaBeans with Layered Queuing Network Templates Proc of SAVCBS Workshop, FSE, Lisbon (2005)
18