for Disaster Evaluation and Response (E-DECIDER), the ... large earthquake disasters. E-DECIDER ..... interpolated and extrapolated to create additional movie.
A Distributed Approach to Computational Earthquake Science: Opportunities and Challenges Andrea Donnellan, Jay Parker, Margaret Glasscoe, Eric De Jong Jet Propulsion Laboratory, California Institute of Technology Marlon Pierce and Geoffrey Fox Indiana University Dennis McLeod University of Southern California John Rundle, University of California, Davis Lisa Grant Ludwig University of California, Irvine Abstract—Advances in understanding earthquakes increasingly requires the integration of models and multiple distributed data products. Increasingly, data are acquired through large investments and utilizing their full potential requires a coordinated effort by many groups and experts who are often distributed both geographically and by expertise.
and forecasting. However, the uncoordinated but improving state of current data collections, robustness of data repositories, and the lack of formal modeling tools capable of ingesting multiple data types hampers earthquake research activities. A growing number of research groups and communities are recognizing the need to integrate the heterogeneous data and models. These groups fall at different parts of the continuum from raw data to science models and decision support products. Such groups include but are not limited to QuakeSim the Asia Pacific Economic Cooperation (APEC) Cooperation for Earthquake Simulation, Earthquake Data Enhanced Cyber-Infrastructure for Disaster Evaluation and Response (E-DECIDER), the Alaska Satellite Facility, Computational Infrastructure for Geodynamics (CIG), EarthScope, the Southern California Earthquake Center (SCEC), the Scripps Orbit and Permanent Array Center (SOPAC), and the University NAVSTAR Consortium (UNAVCO) We draw on experience from interactions between QuakeSim, SOPAC, ACES, E-DECIDER, and ASF, which illustrate how improved computational infrastructure facilitates integration of data and models and also highlights new challenges.
1. INTRODUCTION Earthquake science depends greatly on numerous data types spanning spatial scales from microscopic to global and timescales of fractions of seconds to millions of years. Integrating these many components creates a rich environment for the application of cyberinfrastructure to the study of earthquake physics. The inadequate preparation and response to recent major earthquakes in Haiti, Chile, and Japan have shown that the field is ripe for transformation: formerly isolated groups must work more effectively with each other. Data providers need to better understand how their data are consumed and fused with other data sources by downstream geophysicists. Geophysicists must understand how to relate their work to emergency planners and responders. Experts focused on the processes of particular areas of the globe must find ways to translate their knowledge to other regions and research teams. All must be focused on identifying and tackling grand challenges that span areas of expertise. Collaboration alone is not enough: the field needs a common framework designed to foster the desired connections. This is especially imperative as datasets and sources grow and as new spaceborne missions and ground based networks contribute a wealth of new data.
These groups add value in different ways. They also focus on different parts of the end-to-end data flow. Data come in as raw products and processing centers turn these into higher-level data products. Other organizations model the data and/or turn them into standardized output or interpretations. The Scripps Orbit and Permanent Array Center (SOPAC) at UC San Diego and UNAVCO, a university-governed consortium process and archive geodetic data and data products, and have map-based interfaces for selecting data products and viewing products summarized as velocity vectors and single-station time series. SOPAC is a major partner in the GPS Explorer web portal (http://geoapp.ucsd.edu/), which provides map-based access to GPS networks and stations, together with derived strain maps and extraction of time series parameters
Numerous and growing online seismic, geologic, and geodetic data sources from government agencies and other resources around the world provide an exceptional opportunity to integrate varied data sources to improve our understanding of earthquakes. The data support comprehensive efforts in data mining, analysis, simulation, 1
including seasonal terms, and earthquake-induced position jumps. UNAVCO serves GPS data products from the Plate Boundary Observatory and Earthscope, as well as satellite InSAR raw data and Lidar landscape images. SOPAC and UNAVCO focus on processing and delivery of the geodetic data products, not integration with physics-based models.
applications, ranging from seismic wave propagation to viscoelastic crustal deformation. It supports science gateways where users may run preinstalled software on remote supercomputers. It does not attempt to integrate observational data products, any map-based tool or webservice interface, as applications are generally designed to run from a command line.
The Alaska Satellite Facility (ASF) downlinks, archives, and distributes satellite data. Its mission is to promote, facilitate, and participate in the advancement of remote sensing in order to support national and international Earth science research, field operations, and commercial remotesensing applications that benefit society. ASF is the designated Distributed Active Archive Center for several imaging radar data products, including data from NASA’s Uninhabited Aerial Vehicle Synthetic Aperture Radar (UAVSAR). ASF recognizes the need to provide high quality data and services in a timely manner, which is a key requirement for groups such as QuakeSim.
Integrating geophysical modeling and earthquake forecasting tools with remote sensing data is useful for science analysis and pre- and post-earthquake risk evaluations. Delivered as Open Geospatial Consortium (OGC) standards-compliant data products through a web portal/web services infrastructure these capabilities allow easy access and use by scientists and decision-makers. Ensuring that the system is readily supportable and extensible in the future provides a powerful means to study the earthquake cycle and respond to earthquakes. A complete system offers a new opportunity to gain an understanding of the entire earthquake cycle including earthquake nucleation and precursory phenomena. The complexity of phenomena and range of scales from microscopic to global involved in the earthquake generation process make creating such a system and understanding earthquakes a grand challenge.
NASA’s QuakeSim project focuses on computational infrastructure for modeling and mining remotely sensed and other earthquake related data. QuakeSim is unique in that its web environment integrates modeling applications with a fault database and with geodetic data products (GPS and InSAR). The observational data products are produced elsewhere (such as SOPAC or the Alaska Satellite Facility). The fault data are from published studies and catalogs, and the database is integrated with the model construction tools. The user environment assists interpretation of observed deformation in terms of geophysical processes, such as elastic crustal response to fault motion. Forward models and inversions are integrated with the geodetic data types, so that a model deformation produces a synthetic interferogram with the same type of display as a real interferogram. QuakeSim development has resulted in many successes but has also identified a number of key challenges related to data, computational infrastructure, and infrastructure for modeling, analysis, and visualization.
For the rest of this paper we draw on experience from QuakeSim, and E-DECIDER, which have identified key challenges in striving to integrate models and data from different sources and developing applications for improved data ingestion, science analysis, and support to emergency responders. Such challenges include the need for more open processes, greater integration and accountability of different groups on each other, managing data and interfaces to overcome heterogeneity and bandwidth limitations, tracking data product provenance, system robustness, and engagement of users. The solutions are partially technical and partially sociological.
Data analysis and model outputs are ingested in the Earthquake Data Enhanced Cyber-Infrastructure for Disaster Evaluation and Response (E-DECIDER). EDECIDER is developing a decision-support platform that utilizes remote sensing data and NASA modeling software to help emergency managers more effectively respond to large earthquake disasters. E-DECIDER builds on the QuakeSim project to develop tools and services that target disaster planning and emergency response communities.
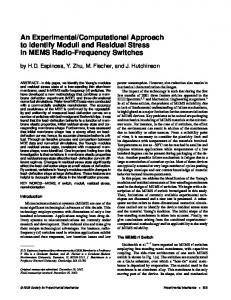
We focus here primarily on the interseismic part of the earthquake cycle that is addressed by remotely sensed crustal deformation data. However, the challenges and opportunities extend to other data types and parts of the earthquake cycle. The primary data product types used are earthquake fault data, seismicity, Global Positioning System (GPS) data, and Interferometric Synthetic Aperture Radar (InSAR) data (Figure 1). Fault data include geometry and slip parameters. Seismicity includes time, magnitude, depth, and possibility mechanism of earthquakes. GPS provides precise positions of survey grade monuments at networks of stations. Daily solutions are typically produced which provide time series of the solutions at each station. These time series are also converted to velocity and jump estimations. Subdaily results are also now routinely produced. InSAR repaat pass interferometry can be collected from spaceborne or airborne platforms. Interferograms represent the line of sight ground range phase change between a position on the ground and the
Other organizations such as ACES and CIG focus more on the modeling than data aspects of earthquakes. ACES is a coordinated international effort linking complementary nationally based programs, centers, and research teams focused on earthquake research. ACES aims to develop realistic supercomputer simulation models for the complete earthquake generation process, thus providing a "virtual laboratory" to probe earthquake behavior. The focus of CIG is the development of computational geophysics 2
instrument. If the instrument has an exact repeat pass and errors such as from the atmosphere are removed, the interferogram reflects the component of ground surface motion toward or away from the instrument. UAVSAR is an airborne L-band radar platform.
usage if they don’t work well at the outset. The ideal scenario is to develop tools with friendly users and then further develop documentation and expand the user base as the tools become more functional. Science use cases come with a set of challenges that can be different than for end users. Emergency responders, for example, need a well-developed set of tools that can be used routinely, while science studies often deviate from routine tool usage. Part of the scientific process involves exploring data or models in new ways. As a result, keeping up with new tools to satisfy ever changing scientific approaches is challenging. Scientists need toolboxes to develop new approaches more than standardized workflow, and the infrastructure and personnel needed to develop toolboxes that allow for flexible analysis of the data is quite extensive.
A robust system for ingesting data and modeling earthquakes is modular and extensible, supporting science and disaster response user communities. The goal is to have robust automated tools in place so that when an event such as an earthquake does occur response can occur in a routine manner and delays are mitigated. Earthquakes from around the world, many of them large enough to be potentially detectible using remote sensing techniques, but otherwise insignificant, provide an opportunity to establish and test routine automated processes.
Figure 1. Example data sources Technologies such as cloud computing, workflow and webservices, and semantic “markup” provide an opportunity to address the outlined challenges and require a comprehensive set of activities. These include 1) developing robust bridging services in a service-oriented architecture to integrate data from multiple sources (Figure 1); 2) Developing a fundamental framework for model optimization through the integration of multiple data types; 3) Developing cyberinfrastructure within science gateways to handle the computing requirements of the optimization framework including the need to access large datasets; 4) Ensuring data handling issues of model contribution, provenance, version tracking, commenting, rating, etc. and; 5) Developing capabilities for using output in downstream applications.
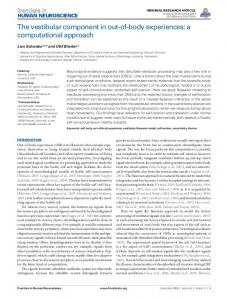
Figure 2. Tool to plot line of sight deformation (unwrapped interferogram values) along a user-selected profile from a map display of a UAVSAR interferogram. Scientists don’t have the time or necessarily the desire to develop tools for other users making creation of such tools a challenge. It is important to identify routine tasks that scientists typically carry out during data or model exploration and create tools that minimize duplication of effort in order to add efficiency to the scientific process. Creating infrastructure to broaden user bases is important for realizing the benefits derived from large investments in data collection from ground-based, airborne, or spaceborne projects or missions.
2. SCIENCE AND END-USER WORKFLOW AS A DRIVER
Use cases grouped under three modes of science understanding, forecasting, and response illustrate different user needs and the potential interaction with computational infrastructure and tool developers.
Basic and applied science tasks illustrate diverse needs for coupling tools and data. Carrying out science problems within a computational environment helps to identify issues and is effective for further development of tools and functionality. There must be an adequate number of easily accessible tools available to make this appealing to scientists and end-users such as emergency responders. Endusers have low tolerance for tools that don’t immediately address their needs and may be less inclined to adopt their
Use case I: Science Understanding: A scientist identifies regions of active crustal deformation from GPS and InSAR (Interferometric Synthetic Aperture Radar)/UAVSAR data products. GPS products can be in the form of position time series or station velocities. The scientist scans through the 3
velocity data plotted in vector form on a map in different reference frames to guide thinking as to where active crustal deformation is occurring. The scientist also plots different cross sections through ground range change interferograms to understand details of crustal deformation (Figure 2). The scientist inverts crustal deformation data for fault motions constrained by paleoseismic fault data and then develops simulations based on fault locations and behavior. The scientist may search GPS time series for transient anomalies that indicate previously unknown characteristics of crustal behavior. The possibilities are numerous and the scientist generally wants to explore the data in new ways. Many steps are routine, however, and a scientific user affiliated with computational tool developers can assess which tasks are carried out frequently enough to warrant new tool development.
region of damage. This envelope can also be used to guide acquisition of UAVSAR and GPS data for both emergency and science response. Possible locations of future aftershocks can be assessed, as the fault models are refined. The damage zone from the event can be defined as a polygon and formatted for ingestion into loss estimation tools. Damage and potential aftershock assessments can be refined as new information becomes available. Computational infrastructure can be used to compute deformation gradients for tilt and slope change maps. Optical and radar change detection and edge detection from radar images can also be carried out. The products can be made available to emergency responders and must be easily accessible and intuitively interpretable by responders.
Use case II: Forecasting: Scientist identifies active faults from multiple data sources such as GPS, UAVSAR, InSAR, paleoseismic fault data, and seismicity. This is likely to be an outgrowth of the above scientific understanding and exploration. Once techniques are developed, pattern analysis is carried out to search for anomalous features in GPS time series and seismicity data. The scientist can conduct simulations of interacting faults and statistical analysis of these interactions. Earthquake probabilities are evaluated for short to decade time scales. This goal has been considerably advanced in recent years as a result of the RELM experiment conducted by the Southern California Earthquake Center [1][2]. In addition, the US Geological Survey intends to bring a short-term forecast capability online in the near future [3]. Ultimately these probabilities are integrated into the Working Group on California Earthquake Probabilities (WGCEP) Uniform California Earthquake Rupture Forecast (UCERF) [4]. These probabilities are the basis of risk estimation and for setting rates of earthquake insurance in California. Studies in this series have been conducted at approximately four-year intervals since 1988. The analysis techniques must be well understood and well defined or standardized in order to incorporate the probabilities into UCERF, which is an official earthquake probability model published by the US Geological Survey.
Numerous processes result in deformation of the Earth’s surface, and models require an increasing number of types of data to guide them. Integrating and modeling the evergrowing and increasingly multisource geodetic GPS and InSAR data volumes is necessary to improve crustal deformation models. The data are of many different forms and sizes. Fault data, for example, yield information about fault geometry, slip rates, and earthquake recurrence. At the other end of the spectrum interferometric radar data tend to be in large binary image files on the order of 1 GB/image. QuakeSim applications use data from many sources including: fault data, GPS time series and velocities, seismicity data, seismic moment tensor information, and interferometric synthetic aperture radar (InSAR) images.
Use case III: Response: When an event occurs, deformation can be estimated from models that use available seismic information. Initially that information is location, depth, and magnitude of the event. As a result, assumptions must be made about the possible mechanism. Where fault data are available the likely mechanism can be constrained to known faults. In time, an earthquake mechanism is produced, providing two orthogonal geometries of slip. Of particular interest is the danger posed by aftershocks. Structures weakened by the main shock can collapse when subjected to strong aftershocks. Many examples of this occurred as a result of the September 4, 2010 M7.1 Canterbury NZ earthquake and the February 22, 2011 M6.3 aftershock [5]. The calculated deformation can be used to estimate the envelope of maximum displacement, and hence most likely
Figure 3. Quakesim QuakeTables architecture.
3. DATA STORAGE AND ACCESS
Efficiently analyzing, integrating, and modeling geodetic and geologic data requires digital storage of the data, including the fault specifications, and automated access to the data through network services (Figure 3). As the data sources, volumes and regions of interest grow it is necessary for applications, not just people, to access the data for remote automated processing. The data are distributed and under the cognizance of a wide array of agencies and institutions. Developing standards through formal and informal collaborations and partnerships is a challenge, but is key to maximizing the use of solid Earth science data. Remotely sensed data provide estimates of crustal 4
deformation that are key to improving fault models. The crustal deformation data provide a means of recording and understanding the aseismic part of the earthquake cycle in which strain accumulates or is released. GPS data provide long-term estimates of crustal deformation of a network of California and global sites. Time series of daily changes in position of these sites provide detailed information about temporal crustal changes. Current InSAR data products provide detailed images and spatial distribution of crustal deformation sparsely sampled in time. A spaceborne InSAR mission dedicated to studying surface deformation would provide routine high-resolution interferograms of ground motions adding a significant increase in the temporal and spatial resolution of InSAR data products. Even so, airborne UAVSAR data products are large and complex enough that maximizing their utility is best done when tools are developed that take into account bandwidth for access and different user groups.
●
● ●
All data products should be coupled with selfdescribing network service interfaces. A great deal of useful data and metadata about earthquakes, for example, is bound in human-readable web pages instead of machine-readable formats (e.g., ontologies). Services should be documented, published, and discoverable. Services for analyzing lower level data products should also be designed with the same approach. These services generate products that may be consumed downstream.
Data presented in a map view that can be browsed eases selection of the data (Figure 4). Information about data is often encoded into long file names, and often locations over which the data are collected are encoded as station names or flight paths. Without the user having familiarity with the identification scheme it is often difficult to locate data of interest. A map view of the data makes it easier for a user to efficiently scan for data over regions of interest. Problems arise when data are collected over different time spans and overly other data in the same region, or multiple data interpretations exist. Pop-up lists, menus, or time slider bars can alleviate some of these issues. The data must be human browseable, but also accessed through APIs, which connect data directly to various applications.
QuakeSim applications use data products, rather than raw data, making QuakeSim reliant on suppliers for data products such as UAVSAR Repeat Pass Interferometry, InSAR, and GPS position time series and velocities. This then requires the supplier, such as the ASF DAAC in the case of UAVSAR, and the user, such as QuakeSim, to take into account the necessary interfaces between the data products and applications. System robustness is important as system components rely on remote sources. An outage at the data provider results in tools not working unless adequate redundancy and other safeguards have been put in place. System robustness is particularly important if the system is to be used for earthquake emergency response. Understanding the origin and processing of the data products is important for assessing their quality for ingestion into models. Data products often change with time as new processing techniques or new interpretations become available. One key challenge is keeping up with and documenting improved data products from newer processing techniques as they become available. Ideally, there is a feedback loop from modelers to data product providers that enables modelers to identify issues with the data and request reprocessing of data. This separation of labor will have superior results to the common bottleneck that occurs when tectonic modelers must also be experts in data production. Both data processing techniques and model development are so complicated that they can take careers to develop and as a result teams of people with varied roles rather than individuals must contribute to the final analysis.
Figure 4. QuakeTables database showing UAVSAR map browser and links to data products.
4. COMPUTATIONAL INFRASTRUCTURE A user friendly computational infrastructure is necessary for identifying and pulling in data from numerous sources, simplifying or automating data assimilation, mining, and modeling workflow, and providing feeds and interfaces for generalized data users. The scaling of compute power should occur on the back end and be transparent to the user.
Data products, even for the same data type, are not standardized and are often not adapted for machine interfaces. This requires manual input, or often, at best scraping of web pages for information. While this is not the right approach, it is often the only available approach. Standardized service interfaces are needed for interfacing data with modeling and visualization tools. Data formats should be standardized through community use cases. Data product needs for earthquake science are as follows:
Geophysical analysis typically requires a user to do the following either in an automated manner or with user intervention: 1) Select data in terms of types, time, and space; 2) Subset data to relevant focus of interest; 3) Move 5
data for mining, modeling, or visualization; 4) Analyze data by modeling, inverting, or data mining; 5) Visualize data and results; and 6) Track data and models. For small data sets or regions of interest these steps can be done manually and in fact such investigations provide excellent examples for developing workflow for larger and more complicated cases. Current data volumes and in particular those for existing or planned InSAR missions motivate the need for an end-to-end architecture in which data can be systematically analyzed, modeled, and interpreted. Automation requires interfaces between the widely distributed data sets, data products, and applications. Without such a system in place, data from large projects and missions will be under or not utilized.
effective computational infrastructure. Tools must be intuitive and easily accessible. Standalone tools can be public and reside outside of any required login. This mode of operation is often preferred by users as it avoids the need to remember another login and password combination and allows for greater privacy. However, there are also limitations. Chief of these is that project tracking is not possible. The user would be required to maintain projects locally, which is reasonably easy with simple input and output files, but becomes rapidly complicated when project components are coupled to various applications at the back end. For example, a user may set up and run a model, which is then coupled to various output format and map views. Linking project components is easier if it is done at the back end within a logged in environment. It also is more efficient in an environment where large data sets are accessed and/or displayed and can facilitate sharing of projects between users.
In an end-to-end computational infrastructure users should be able to evaluate data, develop science models, produce improved earthquake forecasts, and respond to disasters in intuitive map-based interfaces. Fault models can be constrained and improved not just by geology, but also by feature identification from InSAR/UAVSAR and inversions of both GPS and InSAR crustal deformation data [6][7]. Forecasting is improved by development of better interacting fault models, pattern analysis, and fusion of both seismicity and crustal deformation data. Intuitive computational infrastructure can enable new observations by providing tools to conduct simulation experiments and produce new information products for use in a wide variety of fields ranging from earthquake research to earthquake response. Timely and affordable delivery of information to users in the form of high-level products is necessary for earthquake forecasting and emergency response. It is also necessary for exploiting crustal deformation to enable new discoveries and uses.
Large jobs, necessary to model complex fault systems or crustal deformation, are currently run on supercomputers, which reside at high performance computing facilities. These resources are often oversubscribed and users’ models can spend a long time in a queue before the job runs. Local machines may not be adequate for running large models, however. Investment needs to be made into more high performance computers and facilities or investment needs to be made in an elastic cloud-computing infrastructure that has high communication bandwidth between nodes. Iterative MapReduce [8][9][10]Error! Reference source not found. that interoperates between HPC and cloud environments can be deployed to handle large datasets and model runs. Large model runs using large data sets pushed to applications only work when high bandwidth infrastructure is available. Subsetting the data or having the storage and compute node close by or connected by a high-bandwidth connection can provide greater access to users not connected to high-bandwidth infrastructure. Pushing around large amounts of data only works if network connections are fast, so maximizing the utility of the system requires careful consideration about subsetting of data or otherwise keeping applications and date in close by proximity.
Computing requirements can be minimal for a few users working on small cases, or can be large, either for many users such as after an event or for large problems such as inversion of interferograms. Initial needs will be modest, as early users may invert small time/space problems such as 12 radar strips and the overlapping GPS stations, with the radar down-sampled by as much as 2500:1. With experience, users need models with increasing area, resolution, stations, and time-spans. Doing so will require spawning dozens of analyses or inversion jobs with different initial conditions. For example, 25 initial conditions, 20 radar strips spread over both time and space, 20,000 interesting data points per strip, and 5000 iterations each requiring evaluation of 100 fault/volcano/aquifer model fault patches, requiring a forward model of about 500 operations per pixel per inversion requires 2.5x10¹⁵ flops, which is 1 Gflop for 29 days. The data products should not or will not necessarily be local to the computation. Distributed data and services that allow exploration of concepts and model fitting to multisource data are increasingly necessary. Collaboration by groups and careful design would build in efficiencies. There are numerous practical issues to establishing an 6
Figure 6. GPS vectors plotted for southern California relative to station CHIL in the San Gabriel Mountains. Fault traces are from UCERF-2 [4]. Science Visualization “movies” driven by GPS or InSAR data display both transient and secular crustal deformation. Movies combine images, maps, multi-spectral data, terrain elevation models, and crustal deformation representations to create three-dimensional and stereoscopic time varying representations of scientific data. Movies enable scientists to view and compare observational data and models at a variety of temporal and spatial scales and change your points of view in space and time.
Figure 5. QuakeSim fault map browser used by crustal deformation model tool. Data-intensive computing infrastructure provides a modeling and visualization environment to a broad geophysical community, supporting multiple data types without the need to download large data sets. Access to GPS, InSAR, faults models, and seismicity is just starting to be coordinated. Currently, large amounts of data must move to an investigator's computer, and integration into models is ad hoc. Modeling interacting-fault simulations largely takes place under local efforts at the research group level, with comparisons taking place largely at infrequent workshops. Web-service based interfaces allow public, independent verification and comparison of simulators and statistical forecast methods, feeding directly into regional hazard models.
Changes that occur over decades, centuries, millennia and geologic epochs can be viewed in a few minutes on screen. Movies can be sped up, slowed down, edited, repeated and looped to focus on particular events. Individual movies focus on global, regional and local aspects of observational data and models. These aspects can be edited and combined, beginning with a global context and zooming in to provide regional and local views. Vertical and horizontal scales can be exaggerated to enhance small changes. Infrared and radar observations can be mapped into the visible spectrum. Contrast, intensity, color hue and saturation and be modified to highlight specific features of the data. Data can be interpolated and extrapolated to create additional movie frames to track changes. However, care must be taken to assure that the use of these techniques does not create artifacts that confuse the viewer. Challenges arise developing procedures that use data to drive the automated production of movies.. GPS stations are sparsely located,(Figure 6,) requireing interpolation between the stations. GPS time series do not exist for the same time frame for all stations. Stations have been added to the network over a time period longer than a decade. This introduces meshing complexity or adds artifacts to the visualization from station outages. GPS time series must be properly interpolated both spatially and temporally to provide the most physically accurate animation. InSAR data are also sparse and typically for short time frames, but can further guide accurate mapping of crustal deformation. UAVSAR observations in southern California have identified numerous localized zones of shear that could not be identified with the spatial sampling provided by GPS.
5. VISUALIZATION Effective visualization is particularly necessary for interpreting complicated data or models. Computational Infrastructure needs to support distributed scientists with visualization of simulation and situational data using both GIS and traditional 3D physical simulations where both are time dependent. Challenges exist both in visualizing complex data as well as in producing visualizations that are properly constrained by data. Visualization tools should be flexible so that the user can view and compare the observational data and model output in different ways. For example, GPS velocity vectors, when plotted relative to different stations illuminate different features responsible for the deformation. When GPS vectors are plotted relative to the San Gabriel Mountains compression to the west in the Ventura basin becomes clearly apparent (Figure 6). Shear zones on either side of the San Gabriel Mountains are also apparent. Similar plots, but relative to stations in the Mojave Desert highlight the Eastern California Shear Zone.
7
6. CONCLUSIONS
REFERENCES
Acquisition, processing, organization, and storage of remotely sensed data, represent a significant investment and the benefits of the data will not be realized without additional investment in computational infrastructure. It is not likely, nor is it desirable, to design, develop and install a single monolithic computational infrastructure to access analyze and model the geophysical and geodetic data. Data are acquired and organized by teams of experts, while other experts analyze data products or develop models or simulations. The various experts are typically distributed geographically, and are often grouped in various centers of expertise providing data sets, data products, models, or other information, for which flow of data, products, or information can be upstream or downstream from any given component.
[1] James R. Holliday, Chien-Chin Chen, Kristy
Tiampo, John B. Rundle and Donald L. Turcotte and Andrea Donnellan, A RELM earthquake forecast based on Pattern Informatics, Seism. Res. Lett., 78, 87-93 (2007). [2] Ya-Ting Lee, Donald L. Turcotte, James R.
Holliday, Michael K. Sachs, JB rundle, ChienChih Chen, and Kristy F. Tiampo, Results of the Regional Earthquake Likelihood Models (RELM) test of earthquake forecasts in California, Proc. Nat. Acad. Sci USA, 108, 16533-16538 (2011) DOI: 10.1073/pnas.1113481108. [3] Thomas H. Jordan and Lucile Jones, Operational earthquake forecasting: Some thoughts on why and how, Seis. Res. Lett., 81, 571-574 (2010)
Successful modeling and analysis requires connecting the components together. For example, fault modeling connects observational data sets to downstream simulation and forecasting techniques. Data access, analysis and modeling centers need to develop modular distributed data systems with a common computational framework and infrastructure that connects upstream or downstream data, data products, applications, and analysis tools. A modular distributed data system design framework and infrastructure does not currently exist to support solid Earth research, but steps are being taken in this direction, as groups realize the need to interface their components to others.
[4] Field, E.H., T.E. Dawson, K.R. Felzer, A.D. Frankel, V. Gupta, T.H. Jordan, T. Parsons, M.D. Petersen, R.S. Stein, R.J. Weldon II, and C.J. Wills, The Uniform California Earthquake Rupture Forecast, Version 2 (UCERF 2), By 2007 Working Group on California Earthquake Probabilities, USGS Open File Report 2007-1437, CGS Special Report 203, SCEC Contribution #1138, 2008. [5] Hiroaki Iizuka, Yuki Sakai and Kazuki Koketsu, Strong ground motions and damage conditions associated with seismic stations in the February 2011 Christchurch, New Zealand earthquake, Seism. Res. Lett., 82, 875881 (2011).
Increases in data volumes, data processing algorithm complexity, and model sophistication require more compute power, communication bandwidth, and human and machine friendly interfaces. As large data sets are accessed it is necessary to either keep the data close to the models or provide high bandwidth connections between the data sources and the models. Data and products should be organized for interactive human and machine searches and connected with self-describing network service interfaces. Map views of all data products should include pop-up lists, menus, overlays, time and spectral slider bars. Services should be discoverable, documented, and published in machine-readable formats. The ideal remotely sensed geodetic data environment should support both science users and emergency/disaster response community users.
[6] Donnellan, A., Parker, J.W. and Peltzer, G., Combined GPS and InSAR models of postseismic deformation from the Northridge earthquake, Pure Appl. Geophys., 159, 2261-2270 (2002) [7] Wei, M, D Sandwell and B Smith-Konter, Optimal combination of InSAR and GPS for measuring interseismic crustal deformation, Adv. Space Res., 46, 236-249 (2010). [8] SALSA Group. Iterative MapReduce. 2010 [accessed 2010 November 7]; Twister Home Page Available from: http://www.iterativemapreduce.org/.
ACKNOWLEDGEMENTS This work was carried out at the Jet Propulsion Laboratory, California Institute of Technology, Indiana University, University of Southern California, and University of California’s Davis and Irvine campuses under contract with NASA. The work was sponsored by NASA’s Advanced Information Technologies and Applied Sciences Programs. We thank UNAVCO, SOPAC, Alaska Satellite Facility DAAC, and University of Nevada, Reno for productive ongoing discussion and collaboration.
[9] J.Ekanayake, H.Li, B.Zhang, T.Gunarathne, S.Bae, J.Qiu, and G.Fox, Twister: A Runtime for iterative MapReduce, in Proceedings of the First International Workshop on MapReduce and its Applications of ACM HPDC 2010 conference June 20-25, 2010. 2010, ACM. Chicago, Illinois. http://grids.ucs.indiana.edu/ptliupages/publications/hpd c-camera-ready-submission.pdf. 8
[10] Bingjing Zhang, Yang Ruan, Tak-Lon Wu, Judy Qiu, Adam Hughes, and Geoffrey Fox, Applying Twister to Scientific Applications, in CloudCom 2010. November 30-December 3, 2010. IUPUI Conference Center Indianapolis. http://grids.ucs.indiana.edu/ptliupages/publications/PID 1510523.pdf.
Image Animation Laboratory (DIAL), and Cartographic Analysis Laboratory (CAL). Eric is a Planetary Scientist in NASA’s Jet Propulsion Laboratory Science Division and a Visiting Associate in Planetary Science at Caltech. He received his B.S. in Plasma Physics from the Massachusetts Institute of Technology in 1967; M.S. in Plasma Physics from Stanford University in 1967, Ph.D. in Interdisciplinary Science from The University of California, Santa Barbara in 1982, and served as a Post-Doc in Planetary Science at Caltech in Pasadena Ca. in 1989.
[11] Thilina Gunarathne, Judy Qiu, and Geoffrey Fox, Iterative MapReduce for Azure Cloud, in CCA11 Cloud Computing and Its Applications. April 12-13, 2011. Argonne National Laboratory, Chicago, ILL. http://grids.ucs.indiana.edu/ptliupages/publications/cca_ v8.pdf.
Marlon Pierce is the Assistant Director for the Science Gateways Group in Research Technologies Applications at Indiana University. Pierce received his Ph.D. Florida State University (Physics) in 1998 in computational condensed matter physics. His current research and development work focuses on computational sciences with an emphasis on Grid computing and computational Web portals. Prior to forming the Science Gateway Group, Pierce served as assistant director for the Community Grids Laboratory at Indiana University's Pervasive Technologies Institute.
BIOGRAPHIES Andrea Donnellan has been a geophysicist at NASA's Jet Propulsion Laboratory since 1993, and a research professor at the University of Southern California since 1998. She is Principal Investigator of NASA's QuakeSim project and other earthquake related projects. Donnellan received a B.S in geology with a mathematics minor from the Ohio State University in 1986. She received her master's and Ph.D. in geophysics from Caltech's Seismological Laboratory in 1988 and 1991 respectively and an M.S. in Computer Science from the University of Southern California in 2003. Donnellan held a National Research Council postdoctoral fellowship at NASA’s Goddard Space Flight Center from 1991–1993.
Geoffrey Fox received a Ph.D. in Theoretical Physics from Cambridge University and is now professor of Informatics and Computing, and Physics at Indiana University where he is director of the Digital Science Center and Associate Dean for Research and Graduate Studies at the School of Informatics and Computing. He previously held positions at Caltech, Syracuse University and Florida State University. He has supervised the PhD of 62 students and published over 600 papers in physics and computer science.
Jay Parker joined the Satellite Geodesy and Geodynamics Systems Group at JPL in 1996, and has been part of the JPL technical staff since 1989. He completed both a master's and PhD in Electrical Engineering from the University of Illinois (Urbana-Champaign), and graduated with a Bachelors of Science from the California Institute of Technology in 1981. His professional interests lie in applications of fast and accurate numerical models to geophysical remote sensing.
Dennis McLeod is currently Professor of Computer Science at the University of Southern California, and Director of the Semantic Information Research Laboratory. He received his Ph.D., M.S., and B.S. degrees in Computer Science and Electrical Engineering from MIT. Dr. McLeod has published widely in the areas of data and knowledge base systems, federated databases, database models and design, ontologies, knowledge discovery, scientific data management, information trust and privacy, and multimedia information management.
Margaret Glasscoe is the Principal Investigator of EDECIDER (Earthquake Data Enhanced Cyber-Infrastructure for Disaster Evaluation and Response). Glasscoe earned her B.S. in Geological Sciences and B.A. in Print Journalism from the University of Southern California in May of 1997. She completed her master's degree in Geology at UC Davis in December 2003. Her thesis work included use of the GeoFEST code to model the deformation in the Los Angeles Basin. Glasscoe began working at JPL as an intern during the summer of 1996, became a staff member in the Data Understanding Systems Group in early 2000, and joined the Solid Earth Group in the Earth and Space Sciences Division at JPL in 2004.
John Rundle is an Interdisciplinary Professor of Physics, Civil Engineering and Geology at University of California, Davis. He is a Distinguished Visiting Scientist at the Jet Propulsion Laboratory, Pasadena, CA (1995-present). He is a Fellow of both the American Physical Society (2005) and the American Geophysical Union (2008). John received his B.S.E from Princeton University (Magna Cum Laude, Phi Beta Kappa, Tau Beta Pi), and his M.S. and Ph.D. from the University of California at Los Angeles. His research is focused on understanding the dynamics of earthquakes through numerical simulations; pattern analysis of complex systems; dynamics of driven nonlinear Earth systems; and adaptation in general complex systems.
Eric M. De Jong is Chief Scientist for JPL’s Instrument Software and Science Data Systems Section; and Research Director for JPL’s: Visualization and Image Processing (VIP) Center, Image Processing Laboratory (IPL), Digital
Lisa Grant Ludwig is an Associate Professor in Public Health at the University of California, Irvine. She was 9
Associate Director of the California Institute for Hazards Research. Lisa earned a Ph.D. from Caltech in 1993 in Geology with Geophysics, M.S. degrees from Caltech in 1990 in Geology and in 1989 in Environmental Engineering and Science, and a B.S. from Stanford in 1985 in Applied Environmental Earth Sciences. Lisa's research interests include natural hazards, paleoseismology, active faults, San Andreas fault, southern California faults, San Joaquin Hills, seismic hazard, environmental health and geology.
10