energies Article
Distributed Measuring System for Predictive Diagnosis of Uninterruptible Power Supplies in Safety-Critical Applications Sergio Saponara Dipartimento Ingegneria della Informazione-Università di Pisa, via G. Caruso 16, Pisa 56122, Italy;
[email protected]; Tel.: +39-050-2217602 Academic Editor: Rodolfo Araneo Received: 7 January 2016; Accepted: 21 April 2016; Published: 28 April 2016
Abstract: This work proposes a scalable architecture of an Uninterruptible Power Supply (UPS) system, with predictive diagnosis capabilities, for safety critical applications. A Failure Mode and Effect Analysis (FMEA) has identified the faults occurring in the energy storage unit, based on Valve Regulated Lead-Acid batteries, and in the 3-phase high power transformers, used in switching converters and for power isolation, as the main bottlenecks for power system reliability. To address these issues, a distributed network of measuring nodes is proposed, where vibration-based mechanical stress diagnosis is implemented together with electrical (voltage, current, impedance) and thermal degradation analysis. Power system degradation is tracked through multi-channel measuring nodes with integrated digital signal processing in the transformed frequency domain, from 0.1 Hz to 1 kHz. Experimental measurements on real power systems for safety-critical applications validate the diagnostic unit. Keywords: uninterruptible power supply (UPS); predictive maintenance; measurements on power transformers; battery monitoring; power electronics and components
1. Introduction To avoid any denial of service, power supplies for safety critical applications (e.g., industrial automation, oil & gas, transport, defense) [1–9], need continuous monitoring to predict possible faults. Power supply systems, particularly for power levels of hundreds of kVA or above, are made of a complex interconnection of several cabinets. Each cabinet contains multi-phase switching power converters (AC/DC, DC/DC, DC/AC, AC/AC), or power isolation transformers, or energy storage modules based on back-up battery units for UPS service. Safety regulations, and the high economical cost of a denial of service, require that the power supply system should be continuously working. Maintenance operations should be limited to the “ordinary maintenance”, synchronized and timely scheduled with the maintenance of the whole system. A failure mode and effect analysis (FMEA) [10,11] study, carried out on real-world power supply systems for oil & gas and transport, provided by an industrial partner, CEG Elettronica (Bibbiena, Arezzo, Italy), proved that the key blocks to be monitored for fault diagnosis are: -
Multi-phase power transformers, used in UPS for power conversion and for isolation [12,13]. Battery modules, used for energy back-up in the UPS system [14–16].
At the state-of-the-art, high reliability designs are often based on redundant system architectures and on components with a high mean time before failure (MTBF). However, components with high MTBF are expensive devices, and high redundant architectures lead to systems with increased size, weight and cost. Energies 2016, 9, 327; doi:10.3390/en9050327
www.mdpi.com/journal/energies
Energies 2016, 9, 327
2 of 18
This work presents first a scalable architecture for UPS systems and then, to achieve predictive diagnosis capability, a distributed network of measuring and processing nodes. For each cabinet forming the UPS system, they acquire a multi-dimensional “image” of the vibrations, and of the electrical (voltage, current and impedance) characteristics of the module under analysis: power transformers or batteries. Local signal processing is carried out in the frequency-transformed domain to track the life-cycle degradation of such “images” that are correlated to the structural degradation of the power system components. Temperature conditions are also measured to check thermal faults. A controller area network (CAN) interconnects all the acquisition and signal processing nodes with a central unit acting as supervisor. Wireless networking is also available thus increasing the scalability and flexibility of the proposed diagnostic equipment. Thousands of experimental tests have been carried out on real power supply systems to validate the performance of the new diagnostic instrumentation. In the rest of the paper, Section 2 presents a critical analysis of the state-of-the-art for UPS predictive diagnosis and highlights the main contribution of the proposed work. Section 3 proposes a new architecture for an UPS system in safety-critical applications, with a description of its key building blocks, and of the distributed network of measuring nodes for diagnosis of the energy storage unit and of the power transformers. With reference to the energy storage unit, Section 4 discusses the measuring approach for the diagnosis of battery modules degradation. Section 5 discusses the theory of vibration measurement to check the degradation of power transformers and highlights the specifications for the design of the relevant predictive diagnostic unit. Section 6 presents a hardware-software realization of the new instrument. Section 7 shows experimental measurements carried out on components (power transformers and battery modules) of real-world UPS systems. Section 8 draws some conclusions. 2. Critical Analysis of the State-of-the-Art for UPS Predictive Diagnosis Most state-of-the-art works in the predictive diagnosis field just address a single type of component of an UPS system, e.g., only power transformers in [7,8,17–41] or only battery modules for energy storage in [14–16,42–47]. A comprehensive system solution for UPS predictive diagnosis is still missing. Moreover, known works often address only some types of faults: e.g., [32–41] address only electrical and thermal faults, whereas [23,28,31] address only mechanical faults through visual inspection or acoustic analysis. For diagnosis of power transformers just the measurement of some electrical parameters is foreseen in state-of-the-art such as in [34,35,39], which measure the primary or secondary currents or their ratio, or in [36], which measures the insulation dielectric losses, or in [40,41], which measure no-load power losses, or in [33], which measures the stray reactance variations. Some techniques, such as those proposed in [31,40,41], cannot be implemented when the device under test (DUT) is working, but they require to switch-off the power system and to analyze the DUT in special test conditions. However, this will increase the denial of service statistics of the power system. In [23,28,31] acoustic measurements of vibrations are proposed for the diagnosis of mechanical degradation of components, but they are done in a controlled laboratory environment and not in the real operating one. As demonstrated in Section 5 by our test campaign with acoustic acquisition systems, the noise level of the real operating environment (industrial, railway) is high. Therefore, an acoustic diagnostic system directly operating in the real working environment typically leads to a too high rate of missed detections and/or false alarms. Recent works [17–25] exploit vibration measurements for mechanical fault diagnosis of power transformers, but they use a large set of sensors, e.g., at least 10 in [17–19], 15 in [22], or 40 in [21] for each transformer. Recent works on power transformer analysis [17–25], and battery analysis [45–47], adopt computation intensive probabilistic algorithms, not implementable in low-cost embedded computing systems. Moreover, the above works usually follow a centralised approach instead of a distributed networking approach as in this paper. Using lots of sensors, with complex processing algorithms needing dedicated workstations, and exploiting a centralized solution, leads to:
Energies 2016, 9, 327
-
3 of 18
An increase of the cost and the size of the diagnostic system. Poor system scalability with an increase of the effort for its installation and maintenance.
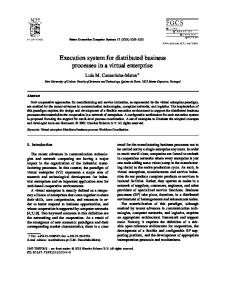
As a result, the above systems are often limited to stand-alone and off-line use. As an example, Energies 2016, 9, 327 3 of 17 in [22] data from the sensors are acquired and then processed off-line, for each device under test, on a dedicated workstation. As a result, the above systems are often limited to stand‐alone and off‐line use. As an example, To overcome the above issues, as it will be detailed in Sections 3–7 this work proposes a distributed in [22] data from the sensors are acquired and then processed off‐line, for each device under test, on network of acquisition nodes with integrated signal-processing capability. These nodes allow a dedicated workstation. monitoring systems byas revealing mechanical (vibration), and thermal To complex overcome power the above issues, it will be the detailed in Sections 3–7, this electrical work proposes a distributed network of acquisition nodes with integrated signal‐processing capability. These nodes degradations of both power transformers and energy storage unit. For the mechanical degradation monitoring complex systems by revealing the node, mechanical (vibration), electrical and three allow accelerometers are used inpower this work for each measuring thus reducing cost and complexity thermal degradations of both power transformers and energy storage unit. For the mechanical vs. known works as [21] using a number of sensors ten times higher. degradation three accelerometers are used in this work for each measuring node, thus reducing cost Main features of the proposed solution are its scalability and easy adaptability to the power supply and complexity vs. known works as [21] using a number of sensors ten times higher. size and physical placement of sensors. As it will be demonstrated by experimental measurements Main features of the proposed solution are its scalability and easy adaptability to the power in thesupply next sections, the system capability to detect degradations is not affected by changes of the size and physical placement of sensors. As it will be demonstrated by experimental operating conditions of the components under test or of the sensors placement. It is simple to install measurements in the next sections, the system capability to detect degradations is not affected by and its cost is negligible if compared to the cost of the DUT, since few sensors are used. By operating changes of the operating conditions of the components under test or of the sensors placement. It is in real-time, while the power system is working, denial of service is avoided. simple to install and its cost is negligible if compared to the cost of the DUT, since few sensors are used. By operating in real‐time, while the power system is working, denial of service is avoided. This work extends the author’s previous contributions in [7,8], which are limited to vibration This work extends the author’s previous contributions in [7,8], which are limited to vibration analysis of transformers only. Instead, in this work the whole power system is considered by analysis of transformers only. the Instead, in transformers this work the and whole power system is considered by 4, monitoring and analyzing both power the energy storage unit (Sections monitoring and analyzing both the power transformers and the energy storage unit (Sections 4, 6 and 6 and 7.2) against faults due to mechanical, electrical or thermal degradations. Moreover, the new 7.2) against faults due to mechanical, electrical or thermal degradations. Moreover, the new scalable scalable architecture of UPS systems with predictive diagnostic capability, described in this work in architecture of UPS systems with predictive diagnostic capability, described in this work in Section Section 3, is new vs. [7,8]. The hardware-software embedded realization of the innovative diagnostic 3, is new vs. [7,8]. The hardware‐software embedded realization of the innovative diagnostic node nodeaddressing addressingthermal, thermal, electrical and mechanical measurements for type any type of faults in power electrical and mechanical measurements for any of faults in power transformer or energy storage units, proposed in Section 6, is new vs. [7,8]. In previous works, the transformer or energy storage units, proposed in Section 6, is new vs. [7,8]. In previous works, the diagnostic node node architecture is limited to acceleration measurements for power mechanical diagnostic architecture is limited to acceleration measurements for transformer power transformer mechanical degradation only. Furthermore, the analysis of power transformers in [7,8] is limited to a degradation only. Furthermore, the analysis of power transformers in [7,8] is limited to a preliminary study, whereas in Section of enriched this work with it is more enriched with more measurements experimental in study,preliminary whereas in Section 7 of this work it7 is experimental measurements in different conditions. different conditions. 3. Innovative Power Supply System for Safety‐Critical Applications 3. Innovative Power Supply System for Safety-Critical Applications The UPS architecture in Figure 1 is scalable in terms of sustained currents and voltages, ranging
The UPS architecture in Figure 1 is scalable in terms of sustained currents and voltages, ranging from 10 kVA up to 150 kVA. These values cover small and large size installations in transport, from 10 kVA up to 150 kVA. These values cover small and large size installations in transport, industrial industrial automation, oil & gas applications [12,13]. Table 1 summarizes the main parameters of the automation, oil & gas applications [12,13]. Table 1 summarizes the main parameters of the scalable scalable UPS and of some of its key blocks, the AC/DC rectifier and the DC/AC inverter blocks. UPS and of some of its key blocks, the AC/DC rectifier and the DC/AC inverter blocks.
Figure 1. Double conversion architecture of the proposed UPS; power transformers positioning is also Figure 1. Double conversion architecture of the proposed UPS; power transformers positioning is shown.
also shown.
Energies 2016, 9, 327
4 of 18
Table 1. Main parameters of the proposed UPS. UPS System Size (kVA)
Input Voltage (Vac)
Input Freq. (Hz)
Input Current Distortion, %
Input Voltage (Vdc)
Output Voltage (Vac)
Output Freq. (Hz)
Efficiency (%)
10 to 150
400 V ˘ 20%
50 Hz/ 60 Hz ˘ 10%
5% with 12 pulses bridge + THD filter
384 V ˘ 20% (e.g., from batteries)
3 ˆ 400 V ˘ 5% (see inverter output data)
50 Hz/ 60 Hz ˘ 1%
88 to 93
SCR-Based Rectifier (AC/DC) Output Current Max. (A)
Efficiency (%)
50 to 350
93 to 97 IGBT-Based Inverter (DC/AC)
Input Voltage (Vdc)
Efficiency (%)
Output Voltage (Vac)
Output Voltage Stability (static)
Output Voltage Stability (dynamic)
Total Harmonic Distortion (THD)
384 V ˘ 20% (min. 307 V)
95 to 96
3 ˆ 400 V
1% static *
5% dynamic, reset to 1% in 40 ms *
1.5% linear load **,