César I. Prieto-Castro1, Daniel Valencia1, Rubén Lobato2, José E. Alonso2. 1Instituto ..... [11] Valderrabano A., D. Baez, J.M. RamÃrez, âPattern. Recognition in ...
A Feature Extraction Method Based on Morphological Operators for Automatic Classification of Leukocytes Pilar Gómez-Gil1, Manuel Ramírez-Cortés1, Jesús González-Bernal1, Ángel García Pedrero1, César I. Prieto-Castro1, Daniel Valencia1, Rubén Lobato2, José E. Alonso2 1 Instituto Nacional de Astrofísica, Óptica y Electrónica 2 Instituto Mexicano del Seguro Social {pgomez, jmram, jagonzalez, agarciapedrero}@inaoep.mx
Abstract In this paper we present preliminary results obtained from the application of morphological operator pecstrum, for the extraction of discriminating characteristics in leukocytes and similar artificial images. Experts have identified six categories of leukocytes, very similar in shape and size, which makes them extremely difficult to distinguish automatically or even by non-expert humans. A feature vector based on a 7-component pecstrum, normalized area, and nucleus - cytoplasm area ratio, was tested using 4 kinds of recognizers: Euclidean distance, k-nearest Neighbor, Back Propagation Neural Net and Support Vector Machine. Using 36 patterns for training and 18 for testing, recognition of 87% was obtained in the best case, which is encouraging, given the complexity of the problem. The amount of samples used at this point for experiments is not statistically representative, however these results are promising and more experiments will be carried out.
1. Introduction The use of differential counting and assessment of blood white cells morphology from bone marrow is an important source of data for clinical cytology in a wide range of pathologies in the medical fields of oncology and hematology (see, for example [1-3]). In order to accomplish these activities, an important attribute to consider in leukocytes analysis is the age of the cell, which is strongly reflected in a morphological evolution of its nucleus and cytoplasm. Cytology experts have identified six categories of this type of cells, according to their maturity stage,
that ordered from youngest to oldest are named: Myeloblast, promyelocyte, myelocyte, metamyelocyte, band, and polymorphonuclear leukocytes (PMN) [4]. Some typical examples of these categories are shown in figure 1, where nucleus and cytoplasm of each cell are in different colors. Myeloblast is the earliest recognizable myeloid cell, and normally it has a large round to oval nucleus. Promyelocyte is slightly larger than a myeloblast. Its nucleus, although similar to a myeloblast, shows slight chromatin condensation and less prominent nucleoli with respect to the size of the cytoplasm. Myelocytes are slightly smaller than promyelocytes and have eccentric round-oval nuclei, often flattened along one side. In a typical image of a myelocyte, the proportion of the area occupied by the nucleus with respect to the cytoplasm is about 50-50 %. Metamyelocytes (10-18µ) are slightly smaller than myelocytes. They have kidney shaped indented nuclei and relatively dense chromatin, especially along the nuclear membrane. Bands are usually characterized by a U-shaped or deeply indented nucleus. Opposite sides or lobes are of roughly equal size or diameter, and there is no nuclear constriction greater than one half of the lobe diameter. Polymorphonuclear (PMN) leukocytes or segmented neutrofiles are characterized by definite lobation with thin thread-like filaments of chromatin joining the 2-5 lobes. From the previous description of typical forms of leukocytes, we can notice that definition of characteristics to discriminate among them is not straightforward. It is required to use a feature extractor able to consider shapes and at the same time, be tolerant enough to variation among patterns due to translations and rotation of the images. An additional problem associated to the creation of automatic leukocyte recognizers is the lack of public databases of leukocytes images to use for experimentation [5]. The scarce published research that we have found related
Published at the Proceedings of the 2008 Seventh Mexican International Conference on Artificial Intelligence (MICAI). IEEE Computer Society. Pp. 227-232. Octuber 2008. ISBN: 978-0-7695-3441-1.
to this kind of problem (for example [14]), is normally carried out using private databases which in many cases present a unbalanced number of images with respect to classes, or have been digitized under very different conditions. In this research we explore the use of mathematical morphology as a tool to create a feature extractor able to discriminate leukocytes. To automatically deal with this classification could be very useful in the construction of other automatic systems, as classification of different kinds of leukemia, counting of cells etc. The paper is organized as follows: Section 2 describes theory associated to Morphology and its operator spectrum, Section 3 describes the feature vector. Section 4 describes the experiments developed to test the performance of the proposed feature vector, and analyzes the results. Section 5 discusses conclusions and perspectives.
of the morphological content of the image [8, 9]. Pecstrum has been used in the last years with different purposes: analysis of partial discharges in high voltage systems [10], automatic recognition of automotive plates [11], texture analysis in several applications, such as images of debris particles in polymers and composite materials [12, 13], and cytology of bone marrow images for the counting of white blood cells based on morphological granulometries [14]. Binary mathematical morphology is based on two basic operators: Dilation, and erosion. Both are defined in terms of the interaction of the original image A to be processed, and the structuring element B. Next both basic operators are defined.
2.1 Morphological dilation It is defined as the set union of the objects A obtained after the translation of the original image for each coordinate pixel b in the structuring element B:
A ⊕ B = U b∈B Tb ( A) (1)
Figure 1. Maturity stages of white blood cells. (a) Myeloblast. (b) Promyelocyte. (c) Myelocyte. (d) Metamyelocyte. (e) Band, (f) Polymorphonuclear leukocytes (PMN).
2. Morphology and pecstrum Mathematical morphology aims to quantitatively describe operations effective for the shape of objects in an image [6, 7]. Operations are described by combinations of a basic set of numerical manipulations between an image A and a small object B, called a structuring element, which can be seen as a probe that scans the image and modifies it according to some specified rule. The shape and size of B, typically much smaller than the image A, together with the specific rule, define the characteristics of the performed process. A very interesting morphological operator is the pattern spectrum or pecstrum. This operator decomposes the target image in morphological components, according to the shape and size of the structuring element, providing a quantitative analysis
Binary dilation can be interpreted as the combination of two sets by using the vector additions of set elements, called the Minkowski Addition. This operation is expressed as: A ⊕ B = { r | r = a + b ∀ ∈ A and b ∈ B } (2)
2.2 Morphological erosion. Erosion is the morphological dual of the dilation. It is defined in terms of the Minkowski substraction as: A Θ B = { r | ( r + b) ∈ A ∀b ∈ B } (3) This definition can be expressed in terms of set intersections as: A Θ B = I b∈B T−b ( A) (4)
2.3 Opening filter. An important operator, which is the backbone of the pattern spectrum, is the opening morphological filter, defined as an erosion operation followed by a dilation using the same structuring element. The opening operator is defined as: A o B = ( A Θ B) ⊕ B (5)
Published at the Proceedings of the 2008 Seventh Mexican International Conference on Artificial Intelligence (MICAI). IEEE Computer Society. Pp. 227-232. Octuber 2008. ISBN: 978-0-7695-3441-1.
Dilation tries to undo erosion operation. However, some details closely related with the shape and size of the structuring element will vanish. Furthermore, an object disappearing as consequence of erosion can not be recovered.
r x = {AL M Rnc M P (n, B)} (10) where: AL = Leukocyte normalized area
Rnc = Nucleus-cytoplasm ratio P(n, B) = 7 components of Pecstrum of nucleus. If
2.4 Closing filter. Closing morphological operator, which is the dual of the opening, is defined as dilation followed by an erosion operation using the same structuring element: A • B = ( A ⊕ B) Θ B (6)
the image generates less than 7 components, the missing values are set to 0.0.
Opening and closing filters have been used as discriminators for filtering, segmentation, edge detection, differential counting, or numerical analysis of shapes.
2.5 Pecstrum. Pattern
spectrum
of
a
compact
binary
2
image A ⊆ R , relative to a convex binary pattern
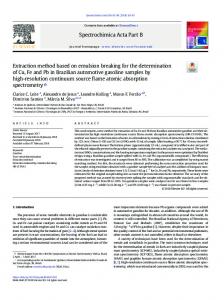
(a) Ellipse
B ⊆ R 2 called the structuring element, is defined as the differential size distribution function:
Px (n, B ) =
dM ( A o nB ) , n≥0 dn
(7)
where M represents the area measured in the intermediate operations, and nB is the n-times dilated structuring element. Pecstrum has the property of invariance to translation and rotation when B is an isotropic structuring element. Scale is determined by the size of the structuring element. The discrete version is given by:
P(n, B ) =
M [ A o nB ] − M [ A o (n + 1) B] M [ A]
(b) Star
(8)
Figure 2 shows the obtained pecstrum for two images. It was calculated using a structuring element formed by a small circle with diameter of 6 pixels.
3. A feature vector for leukocytes discrimination A composed feature vector based on the discussed morphological information is proposed as follows:
Figure 2. Pattern spectrum of two geometric forms. This vector contains information that in general human experts could consider to classify a leukocyte: • shape of the nucleus, represented by the pecstrum
P(n, B) • relationship among the area of the cytoplasm and the area of the nucleus, represented by Rnc • size of the cell, represented by AL
Published at the Proceedings of the 2008 Seventh Mexican International Conference on Artificial Intelligence (MICAI). IEEE Computer Society. Pp. 227-232. Octuber 2008. ISBN: 978-0-7695-3441-1.
Figure 3 (a) shows an image of a leukocyte, and 3 (b) the results obtained for the computation of the composed feature vector described before. The segmented image is plotted in the up-left part of figure (b). The obtained feature vector is plotted in the lower chart of the figure, which is: r x = {AL M Rnc M P(n)}
and (9-19-6) were found to fit best the data. SVM was extended to multi-class classification using the method proposed by [15] known as DAGSVM (Directed Acyclic Graph Support Vector Machine). Matlab function svmtrain() was used as a nucleus for the implementation of DAGSVM. The KNN was tested for k=1, 3 and 5.
= {0.2700, 0.2878, 0.2709, 0.6216, 0.0858, 0.0075, 0.0009, 0.0, 0.0}
Table 1 shows means and variances of the feature characteristics for each class of leukocytes, obtained from the dataset described at section 4.1.
4. Experimental description and results 4.1 Data Set. Input data was obtained from hand-segmented images of white blood cells in different maturity stages, some examples are shown in figure 4. Data set consists of 54 patterns corresponding to 7 artificial and 2 real images for each class. Artificial images were needed due to the lack of a public database to carry out the experiments. An artist generated the artificial segmented images hand-painting them in black and white pixels, using Paint. Figure 4 (a) shows examples of segmented real cells corresponding to each class. Figure 4 (b) shows examples of artificial cells.
(a) Original image
4.2 Pattern classification To test the performance of the proposed feature vector we used 4 different classifiers based on Euclidean distance, K-nearest neighbor (KNN), Feedforward Neural Networks (FFNN) and Support Vector Machines (SVM) respectively. All classifiers were built using Matlab V 7.0. The FFNN was trained using the Matlab function TRAINLM (Levenberg-Marquardt backpropagation). By experimentation, FFNN architectures of (9-15-6)
(b) Plot of composed feature vector for (a) Figure 3. An example of a feature vector.
Table 1. Mean and variance of composed feature vectors for the training data.
Leukocyte type: Myeloblast: Mean Variance Promyelocyte: Mean Variance Myelocyte: Mean Variance Metamyelocyte:Mean
AL
Rn
P(1)
P(2)
P(3)
P(4)
0.1860 0.0203 0.2939 0.0331 0.2105 0.0321 0.2048
0.8347 0.0643 0.5075 0.0029 0.4984 0.0114 0.4629
0.8156 0.1005 0.841 0.0642 0.9234 0.0254 0.5170
0.0726 0.0516 0.0615 0.0158 0.0336 0.0132 0.3760
0.0371 0.0162 0.0361 0.0089 0.0198 0.0049 0.0678
0.0124 0.0089 0.0234 0.0183 0.0091 0.0016 0.0234
P(5) 0.0084 0.0062 0.0114 0.0058 0.0026 0.0018 0.0070
P(6) 0.0074 0.0058 0.0073 0.0046 0.0026 0.0021 0.0042
P(7) 0.0049 0.0031 0.0046 0.0028 0.0025 0.0003 0.0026
Published at the Proceedings of the 2008 Seventh Mexican International Conference on Artificial Intelligence (MICAI). IEEE Computer Society. Pp. 227-232. Octuber 2008. ISBN: 978-0-7695-3441-1.
Band: PMN:
Variance Mean Variance Mean Variance
0.0384 0.2127 0.0226 0.1796 0.0198
0.0136 0.2028 0.0047 0.1736 0.0447
0.0507 0.5190 0.1691 0.3893 0.0179
0.0751 0.3510 0.1063 0.4186 0.0099
Three-fold cross validation was used to obtain the classification results shown in Table 2. Best results were obtained by a FFNN with 19 hidden nodes. A similar work [14] reported a classification rate around 77%. However, a fair comparison is not possible due to differences in the databases used.
0.0249 0.1210 0.0601 0.1573 0.0398
0.0035 0.0088 0.0026 0.0346 0.0119
0.0007 0 0 0 0
0.0008 0 0 0 0
0.0017 0 0 0 0
Neural Networks (FFNN) and Support Vector Machines (SVM) respectively. Three-fold cross validation was used to get the classification rates for each classifier.The best result was obtained by a FFNN with 19 hidden nodes, getting 87.6% of corrected classification. The reported work is part of a ongoing project on the cytology of human bone marrow images. The tools described in this paper will be used as the base for a second part in the project, oriented to the differential counting of white blood cells, and its use in the diagnosis and follow up of several pathologies, under the supervision of medical experts.
6. References Figure 4. Examples of patterns for each class, from left to right: Myeloblast, promyelocyte, myelocyte, metamyelocyte, band, and polymorphonuclear leukocytes (PMN). (a) Real images. (b) Artificial images.
Table 2. Three-fold cross validation Classifier Euclidean Distance K-NN with K= 1 K-NN with K= 3 K-NN with K= 5 FFNN with 19 hidden nodes FFNN with 14 hidden nodes DAGSVM
Classification Rate 77.7% 70.4% 72.2% 70.4% 87.6% 84.9% 71.6%
5. Conclusions and perspectives. A composed feature vector based on morphological information for classification of hand-segmented leukocytes images was presented. This feature vector was constructed with the morphological pecstrum as the central part, and some geometric considerations. The composed feature vector shows very good attributes to reflect the evolution in time of the white blood cells. The proposed feature extraction was tested using 4 different classifiers based on Euclidean distance, K-nearest neighbor (KNN), Feed-forward
[1] G. Bogdanovic, D. Jakimov, B. Stojiljkovic, V. Jurisic “The cell growth, morphology and immunocytochemistry of novel cell line established from a bone marrow of the patient with therapy-related myelodysplastic syndrome”, Medical Oncology, Vol. 24, No. 4, 2007. [2] Navarro, M.A.Ruiz, A. Cabello, R. Collado, R. Ferrer, J. Hueso, J. Martínez, A. Miguel, M.T. Orero, P. Pérez, A. Nolasco, F. Carbonell, “Classification and scoring systems in myelodysplastic syndromes: A retrospective analysis of 311 patients”, Leukemia Research, Vol. 30 , No. 8 , pp. 971 - 977, 2006. [3] T.C. Bortolheiro, “Morphological classification of myelodisplastic syndromes”, Rev. Bras. Hematol. Hemoter, Vol. 28, No.3, pp. 194-197, 2006. [4] Bennet J., “Classification of acute leukemias and the myelodisplastic syndromes”, International Journal of Hematology, vol. 72, pp.131-133, 2000. [5] Mayumi-Ushizima, D. and Costa-Rosatelli, M. “ELearning in Medical Diagnosis,” XVIII Brazilian Symposium on Computer Graphics and Image Processing SIBGRAPI 2005. Natal – RN- Brazil [6] J. Goutsias, L. Vincent, D. S. Bloomberg , “Mathematical morphology & its applications to image & signal processing”. Computational imaging & vision series, Vol 18, Lavoisier Libraire, 2000. [7] Ledda A., J. Quintelier, P. Samyn, P. D. Baets, W. Philips, “Quantitative image analysis with mathematical morphology”, Proceedings of ProRISC 2003, Veldhoven, The Netherlands: 399-406, 2000.
Published at the Proceedings of the 2008 Seventh Mexican International Conference on Artificial Intelligence (MICAI). IEEE Computer Society. Pp. 227-232. Octuber 2008. ISBN: 978-0-7695-3441-1.
[8] Ledda and W. Philips, “Majority Ordering and the Morphological Pattern Spectrum”, ACIVS, Proceedings Lecture Notes in Computer Science 3708: 356-363, 2005. [9] P. Maragos, “Pattern spectrum and multiscale shape representation,” IEEE Transactions on Pattern Analysis and Machine Intelligence, vol. 11, pp. 701-716, 1989. [10] L. Yunpeng, L. Fangcheng, L. Chengrong, “Pattern recognition of partial discharge based on its pattern spectrum”, International Symposium on Electrical Insulating Materials, Conference Proceedings, June 5-9, Kitakyushu, Japan, 2005. [11] Valderrabano A., D. Baez, J.M. Ramírez, “Pattern Recognition in Automotive Plates¨, Proceedings of the Midwest Symposium on Circuits and Systems, University of Notre Dame, pp. 56-59, august 10-12, 1998.
[12] Asano A., “Texture analysis using morphology pattern spectrum and optimization of structuring element”, Proc. 10th International Conference on Image Analysis and Processing. 1999. [13] Ledda A., P. Samyn, J. Quintelier, P. De Baets, and W. Philips, ”Polymer Analysis with Mathematical Morphology”, IEEE Benelux Signal Processing Symposium, Conference Proceedings, Hilvarenbeek, The Netherlands, pp. 87-92, 2004. [14] N. Theera-Umpon, P.D. Gader, “Counting white blood cells using morphological granulometries”, Journal of Electronic Imaging, Vol. 9, No. 2, pp. 170-177, 2000. [15] Platt, J., Cristianini, N., Shawe-Taylor, J. “Large Margin AGS for Multiclass Classification.” Advances in Neural Information Processing Systems, 12 ed. S.A. Solla, T.K. Leen and K. R. Muller, MIT Press, 2000
Published at the Proceedings of the 2008 Seventh Mexican International Conference on Artificial Intelligence (MICAI). IEEE Computer Society. Pp. 227-232. Octuber 2008. ISBN: 978-0-7695-3441-1.