A Noise-Robust Feature Extraction Method Based on Pitch-Synchronous ZCPA for ASR Muhammad Ghulam, Takashi Fukuda, Junsei Horikawa and Tsuneo Nitta Graduate School of Engineering, Toyohashi University of Technology 1-1 Hibari-gaoka, Tempaku cho, Toyohashi, Japan
[email protected] Filter Bank
Abstract In this paper, we propose a novel feature extraction method based on an auditory nervous system for robust automatic speech recognition (ASR). In the proposed method, a pitchsynchronous mechanism is embedded in ZCPA (ZeroCrossings Peak-Amplitudes), which has previously been shown to outperform the conventional features in the presence of noise. A noise-robust non-delayed pitch determination algorithm (PDA) is also developed. In the experiment, the proposed pitch-synchronous ZCPA (PS-ZCPA) was proved more robust than the original ZCPA method. Moreover, a simple noise subtraction (NS) method is also integrated in the proposed method and the performance was evaluated using the Aurora-2J database. The experimental results showed the superiority of the proposed PS-ZCPA method with NS over the PS-ZCPA method without NS.
1. Introduction The use of auditory-based feature extraction methods for automatic speech recognition (ASR) has been increased in recent years for their robustness in the presence of noise. Seneff’s model [1] uses a generalized synchrony detector (GSD) to identify formant peaks and periodicities of the speech signal. EIH model [2], proposed by Ghitza, uses an array of level-crossing detectors attached to the outputs of band-pass filters to generate an interval histogram. The EIH model produces dominant periodic temporal structures by analyzing zero-crossing intervals in each frequency band. The ZCPA method [3], which is an improvement of the EIH model, uses peaks rather than the level-crossings to measure the intensity of each zero-crossing interval. The ZCPA method was proved more robust and computationally efficient than the EIH model. It is well known that an auditory nervous system has a pitch-synchronous mechanism [4], which can be useful for speech detection, however, neither the ZCPA method nor the EIH model utilizes the mechanism. The proposed PS-ZCPA method extracts the pitch-synchronous features by using the ZCPA method. In the ZCPA method, the positive zerocrossings in each subband are detected, and their intervals are calculated. The peaks within the intervals are also detected at the same time. Then a histogram of the intervals for all bands is collected with the peaks contributing as a weighting factor. In the proposed PS-ZCPA method, at first, a noise-robust, non-delayed pitch determination algorithm (PDA) is applied to extract the pitches of the speech signal, and also to detect the voiced (V) and the unvoiced or silent (U/S) segments of the signal. The highest peak (Phighest) in each pitch interval for each subband is also detected. The peaks that are
1 2
Speech data
features Zero crossing detector
i
Peak detector
Higher peaks extractor
Interval histogram
Σ
ZCPA n
Pitch detector
Pitch interval
PS-ZCPA
N
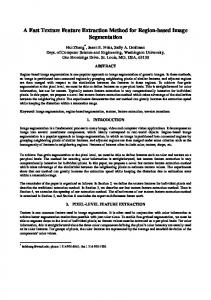
Fig. 1: Block diagram of the proposed PS-ZCPA method above a threshold determined by the Phighest, rather than all the peaks as in the ZCPA method, are to contribute in histogram bin count. For the unvoiced or silent segments, features are extracted same as with the ZCPA method. In heavily corrupted noisy environments, the temporal structure in high frequency bands for the ZCPA method is deteriorated, and the information from those bands is often unreliable. In this paper, we integrate a noise subtraction method in temporal domain to the proposed PS-ZCPA method to overcome this kind of noise effect. The paper is organized as follows. Section 2 presents the system configuration, where both the proposed PDA and the PS-ZCPA method are described; section 3 gives the experimental results; section 4 introduces noise subtraction in the proposed method. A comparative experimental result on the proposed methods using the Aurora-2J database is given in section 5. Finally, section 6 draws some conclusions.
2. System overview Fig. 1 shows the block diagram of the proposed PSZCPA-based feature extraction method. Speech signal is passed through a bank of N band pass filters (BPFs) with the center frequencies (fc) are uniformly distributed on a Bark scale. The proposed method is divided into two parts: a) pitch determination, and voiced and unvoiced/silent segments detection, and b) feature extraction. 2.1. Pitch determination and voiced (V) / unvoiced or silent (U/S) segments detection For pitch determination, outputs from first n filters are used. The frame length is set to 35ms, and the frame rate is 10ms. At first, each filter output is half-wave rectified, and centerclipped, and then an auto-correlation function (ACF) is applied to give an auto-correlogram. A summary autocorrelogram is obtained by summing up all the autocorrelograms. A novel noise-robust, non-delayed pitch determination algorithm is then applied to the summary auto-
2.2. The proposed PS-ZCPA-based feature extraction method The proposed PS-ZCPA method uses pitch-synchronized peaks to extract the features. The spectrum is estimated using the ZCPA method. The original ZCPA-based features are computed by the following procedure: (1) detects all the zero crossings from each filter output (subband signal), (2) calculates the inverse of the successive positive zero-crossing interval lengths that corresponds with subband signal, and (3)
Current frame
AmplitudeÆ
Pitch of the previous frame = 11.9 ms (191 samples)
Utterance:/asahi/ Speaker: male SNR: 10 dB
So reduce weight
SampleÆ
Don’t have 3 rd multiple Pitch pos. (close to the previous frame pitch) 2nd multiple
Summary auto-correlogram
lag
lag
Global maximum
Produces no pitch!
(a) Eliminating half-pitch error, by reducing weight AmplitudeÆ
correlogram to find out the pitches. If the pitch is equal to zero for a certain frame, then the frame is considered to be an unvoiced/silent frame, otherwise the frame is a voiced frame. The basic idea of auto-correlation based pitch tracking is that the correlogram will have a large peak at the lag corresponding to the pitch period. But in real world, it may happen that there are many large peaks at half or double pitch periods. In this paper, a noise-robust PDA is developed to overcome the shortcomings for pitch detection in real world. The basic steps of the PDA are as follows: i) Find the local maximums (Lmax). The Lmax are greater than the values at ±3 lags, and higher than a threshold. ii) Find the global maximums (Gmax). The Gmax are greater than the Lmax with some threshold at ±2 ms. If the maximum of the Gmax lies outside half of the frame length, then there is no pitch. iii) Increase the weight of the Gmax that have peaks with height less than 110% of that Gmax at their multiple (up to 4th multiple) lags. iv) Find the Gmax with maximum weight. The lag of that Gmax corresponds to the pitch period. The key features of the proposed PDA are given below: i) The proposed PDA adopts a non-delayed approach. It means that while determining pitch at frame t, it does not check for any information of later frames, i.e., frames t+1, t+2, etc. ii) As pitches do not change abruptly in successive frames, the proposed PDA always check the pitch of the previous frame, t-1. iii) The proposed PDA makes a good use of the peaks located at multiple lags of a pitch candidate. An intensive observation shows that, for noisy data, a false pitch candidate may have peaks at its 2nd, 3rd, or 4th multiple lags. The proposed PDA not only increases the candidacy by corresponding weight, regarding to the presence of peaks at i-th multiple lag, but also decreases the candidacy in case where no peak is available at any multiple lag (for example, where a candidate has peak at its 2nd multiple lag, but does not have peak at its 3rd multiple lag). This increases the pitch accuracy and eliminates the possibility of generating half-pitch / double-pitch error. It is illustrated in Fig. 2(a). iv) At the end of a voiced segment of a noisy speech, it is very difficult to correctly determine the pitch. In this situation, where there is a pitch (p) at previous frame, but no pitch at current frame, the proposed PDA checks whether there is a large peak at around p, or at 2nd multiple of p in the current auto-correlogram. If there is any large peak at any of those lags, a pitch is set for the current frame (see Fig. 2(b)). This increases the accuracy of the voiced (V) segments detection.
Current frame Utterance:/asahi/ Speaker: male
Pitch of the previous frame = 11.75ms (188 samples)
SNR: 10 dB
SampleÆ
A large peak at double (≈)the previous pitch Pitch at 202 (near about prev. pitch)
Summary auto-correlogram Produces no pitch!
lag
≈half
at 381
Global maximum
lag
(b) Improving voiced segment detection by checking previous frame Fig. 2: Examples for the enhancement of pitch detection (for detail, see section 2.1). collect histograms of the inverse zero-crossing lengths over all the subband signals. At the last stage, the peak value in each zero crossing interval is detected, and then the histogram bin count for the corresponding interval is increased by the logarithmic value of the peak. However, in presence of heavy noise, the smaller peaks are corrupted by noise, which in turn have adverse effect on the performance. To overcome this shortcoming of the original ZCPA method, the proposed PSZCPA method does not consider the smaller peaks that are less than some threshold to contribute in the histogram bin count. In the proposed method, for a voiced segment, the highest peak (Phighest) within a pitch period is detected. Only those peaks that have height above n% of Phighest within that pitch period are to contribute in the histogram bin count in the same manner as with the ZCPA method. The other peaks (smaller ones) in that pitch period are of no contribution. The n should carefully be chosen so that no important information is lost, as well as less noise-corrupted peaks are accounted. For unvoiced/silent segments, as there are no pitches, the features are extracted same as with the ZCPA method. Fig. 3 illustrates this with an example.
3. Experiments 3.1 Experiments on the proposed PDA 10 isolated Japanese words spoken by 10 male speakers, and 3 connected Japanese words spoken by 3 female speakers
Unvoiced/Silent (U/S) portions, use ZCPA, as no pitches are there
SampleÆ
Voiced (V) portions, use PS-ZCPA
(a) Output of filter i Highest peak (P highest )
Amplitude
n% of P hig hest level
Only p eaks in this region for pitch p eriod i will have contribution in histogram bin count SampleÆ Pitch period, i 1 frame
(b) A voiced segment of the output of filter i Fig. 3: An illustration of the PS-ZCPA method. The utterance is /asahi/ by a male speaker. (a) Use the PSZCPA method for only voiced segments. (b) The peaks larger than some threshold have contribution in the histogram count. were used as test dataset. The sampling rate was 16 kHz. There were a total of 1028 frames of which 616 were voiced and the rest were unvoiced. White Gaussian noise was added to the clean speech at SNR = 10dB, 5dB, and 0dB.The reference pitches were extracted by manually checking the speech waveforms. 10 BPFs were used (highest fc = 2kHz) to calculate the summary auto-correlogram. The experimental results are shown in Table 1. The results are given in the number of frames, and also in the percentile form in the brackets. If the PDA generated pitch of a frame is not within 20% of the actual pitch period, then it is considered as a gross error. From Table 1, we can see that the proposed PDA yields high accuracy. It can be mentioned that the U/S to V error has less significant effect on the proposed PS-ZCPA method. 3.2 Experiments on the PS-ZCPA method 3.2.1 Database Train data set: A subset of “ASJ Continuous Speech Database” consisting of 4503 sentences spoken by 30 male speakers. The sampling rate is 16 kHz. Test data set: 100 isolated Japanese words from TohokudaiMatsushita database, spoken by 10 male speakers each. White Gaussian noise was added to the clean speech at SNR = 10 dB, 5 dB. 3.2.2. Experimental setup 20 FIR Hamming filters of order 61, with center frequencies uniformly spaced on the Bark scale between 250 Hz and 6.8 kHz were used in the experiment. Frequency range between 0 and 7 kHz was partitioned into 18 histogram bins uniformly distributed on the Bark scale. Frame length was set to30/fck,
Table 1: Error rate of the proposed PDA Gross error V to U/S U/S to V 0 (0%) 2 (0%) 3 (0.01%) 7 (0.01%) 5 (0.01%) 7 (0.02%) 20 (0.02%) 15 (0.02%) 10 (0.02%) 27 (0.03%) 21 (0.03%) 14 (0.03%)
Word accuracy [%]
Amplitude
SNR (dB) Clean 10 5 0
Clean
SNR=10dB
SNR=5dB
Fig. 4: Word accuracy where fck were the center frequencies of the filters in kHz. The value of n, described in section 4, was varied from 20 to 70. The frame rate was 10ms. We compared the proposed PSZCPA method with the conventional ZCPA method and also with MFCC. The feature vectors consisted of 12 cepstrum and corresponding delta and delta-delta features. MFCC included two additional features: delta power, and delta-delta power. 3.2.3 Results and discussion The experimental results in word accuracy (WA) [%] of the proposed PS-ZCPA, the ZCPA and MFCC are shown in Fig. 4. The value of n was set to 40, which gave a very competitive result. The optimum results for the PS-ZCPA method were obtained by adjusting n as n = 20, 40, 60 for clean, 10dB, and 5dB, respectively. From Fig.4, we can see that the performance of the proposed PS-ZCPA gradually increased with reduced SNR. For n = 40, some peak information is lost for clean speech, resulting in slightly reduced performance. But for larger n, more noise-corrupted peaks are neglected, making the proposed method more robust. For optimal result, we need to adjust the value of n for different values of SNR. To overcome this problem, we integrate a time-domain noise subtraction procedure, which is discussed in the following section, in the proposed PS-ZCPA method.
4. The PS-ZCPA method with noisesubtraction A noise-subtraction procedure is applied to the proposed PSZCPA method to reduce the effect of noise in the performance, and also to fix a value of n, described in the previous section, for the speech signals with different SNR for the optimum result. In heavily corrupted noisy environments, the temporal structure obtained by the ZCPA method in high frequency bands is deteriorated, and becomes unreliable in recognition. The noise-subtraction procedure that we developed, can easily adapt the noise threshold level with the change in SNR. The noise level is checked in each channel output, and hence the temporal structure even in high frequency bands is reliable.
Table 2: The performance of the PS-ZCPA method
Clean Training (%Acc) Clean 20 dB 15 dB 10 dB 5 dB 0 dB -5 dB Average
Subway 99.97 97.34 88.18 78.10 52.11 31.01 21.78 69.35
Babble 99.82 92.31 84.24 70.44 50.67 27.80 20.31 65.09
A Car Exhibition Average Restaurant 99.94 99.80 99.88 99.82 93.06 96.60 94.83 90.12 81.68 87.65 85.44 80.56 73.90 75.43 74.47 75.65 49.11 51.87 50.94 54.25 29.29 28.63 29.18 28.78 21.76 18.52 20.59 16.62 65.41 68.04 66.97 65.87
Street 99.80 94.57 81.89 74.76 50.11 30.40 18.31 66.35
B Airport 99.96 93.21 76.12 72.43 56.22 30.12 19.98 65.62
Station 99.76 91.90 80.10 70.52 48.34 27.76 19.56 63.72
C Average Subway M Street M 99.84 99.90 99.72 92.45 94.26 93.10 79.67 76.90 79.37 73.34 68.87 65.90 52.23 47.98 46.38 29.27 26.65 23.34 18.62 18.71 15.20 65.39 62.93 61.62
Average 99.81 93.68 78.14 67.39 47.18 25.00 16.96 62.28
Overall Average 99.85 93.65 81.67 72.60 50.70 28.38 19.08 65.40
(a) Without noise subtraction
Clean Training (%Acc) Clean 20 dB 15 dB 10 dB 5 dB 0 dB -5 dB Average
Subway 99.98 97.84 90.19 80.10 58.25 39.07 29.76 73.09
Babble 99.90 93.01 86.09 73.06 55.98 35.28 27.62 68.68
A Car Exhibition Average Restaurant 99.96 99.89 99.93 99.88 93.96 97.11 95.48 91.34 83.12 88.76 87.04 82.20 75.78 77.92 76.72 78.03 54.89 56.12 56.31 60.32 37.70 37.71 37.44 37.29 26.19 24.12 26.92 23.11 69.09 71.52 70.60 69.84
Street 99.87 95.67 83.24 76.87 56.28 39.17 26.94 70.25
B Airport 99.98 94.21 78.11 73.02 60.00 37.95 26.64 68.66
Station 99.86 93.09 81.93 73.21 53.20 33.86 24.63 67.06
C Average Subway M Street M 99.90 99.94 99.80 93.58 94.94 94.01 81.37 77.85 80.88 75.28 72.15 69.34 57.45 53.18 50.56 37.07 35.42 29.87 25.33 23.67 20.43 68.95 66.71 64.93
Average 99.87 94.48 79.37 70.75 51.87 32.65 22.05 65.82
Overall Average 99.91 94.52 83.24 74.95 55.88 36.33 25.31 68.98
5. Experiments The performances of the proposed PS-ZCPA method both with noise-subtraction (NS) and without NS (n=40%) were evaluated using the Aurora-2J database. The sampling rate was 8 kHz, and the utterances were connected digit-strings. The experimental results are shown in Table 2, where (a) and (b) show the results for the PS-ZCPA method without NS and with NS, respectively. From Table 3, it can be seen that the PS-ZCPA method with NS has higher accuracy than that of without NS. The reason behind that is the automatic adjustment of the threshold level for each filter output, above which the peaks are to contribute in the histogram bin count. For higher SNR, the value of n is activated, while for lower SNR, the average value of the noise-level (Pavg) becomes prominent. Table 3 represents the relative performance of the PS-ZCPA method without and with NS in comparison with the MFCC features. For example, the PS-ZCPA method with NS had 42.37% relative improvement over MFCC. Fig. 5 shows the spectrogram of the utterance /roku/ (‘six’) for clean (upper), and subway noisy speech having SNR = 10 dB (middle) with the PS-ZCPA method with NS, and for the same noisy speech (lower) with the PS-ZCPA method without NS. The degraded temporal structure in high frequency bands (marked ‘A’ in lower spectrogram) is solved using NS (middle spectrogram).
6. Conclusion A pitch-synchronous ZCPA-based feature extraction method was proposed. The proposed PS-ZCPA method was proved more robust than the original ZCPA method. A sophisticated channel-depended noise-subtraction method, which in turn was showed to be more efficient, was also integrated in the proposed method to handle the noise-threshold level for any kind of SNR. The future work will be to reduce the computational load of the proposed method.
PS-ZCPA with NS
Histogram binÆ
(b) With noise subtraction (NS) Table 3: Relative performance of the PS-ZCPA with and In the noise-subtraction procedure, the following steps were without noise-subtraction (NS) comparing to MFCC performed: Relative performance i) The average value (Pavg) of the peaks in the first 160ms A B C Overall (silent segments) for each filter output is calculated. PS-ZCPA 38.26% 38.22% 24.70% 35.72% ii) The zero level of each filter output is virtually switched PS-ZCPA with NS 45.03% 44.57% 31.78% 42.37% to the corresponding Pavg level. The histogram bin count is same as the PS-ZCPA method, where n is fixed to 20%. Clean
SNR=10dB
PS-ZCPA with NS
A PS-ZCPA without NS
SNR=10dB
TimeÆ
Fig. 5: Spectrogram for the speech /roku/. Acknowledgement This work was supported in The 21st Century COE Program “Intelligent Human Sensing”, from the ministry of Education, Culture, Sports, Science and Technology, Japan
References [1] S. Seneff, “A computational model for the peripheral auditory system: Application to speech recognition research”, in Proc. ICASSP, Tokyo, 1986, pp. 1983-1986. [2] O. Ghitza, “Auditory models and human performance in tasks related to speech coding and speech recognition,” IEEE Trans. Speech Audio Process., vol. 2, no. 1, pp. 115-132, Jan. 1994. [3] DS Kim, SY Lee, and R. M. Kil, “Auditory processing of speech signals for robust speech recognition in real- world noisy environments,” IEEE Trans. Speech Audio Process., vol. 7, no. 1, pp. 55-69, Jan. 1999. [4] T. Hashimoto, et al, “Pitch-synchronous response of cat cochlear nerve fibers to speech sounds,” Japanese J. Physiology, vol. 25, pp. 633-644, 1975.