ICCTP 2010: Integrated Transportation Systems— Green•Intelligent•Reliable © 2010 ASCE
A Forward Collision Warning Algorithm Based on Driver Characteristics Ruijuan CHI1,2, Jianqiang WANG1*, Furui YANG2, Lei ZHANG1 1
State Key Laboratory of Automotive Safety and Energy, Tsinghua University, Beijing 100084, China; PH (086) 010- 62795774; email:
[email protected] 2 College of Engineering, China Agricultural University, Beijing 100083, China; PH (086) 010- 62736730; email:
[email protected] * Corresponding author
ABSTRACT As a part of Driver Assistance Systems (DAS), the Forward Collision Warning System (FCWS) can effectively avoid forward collision accidents and improve traffic safety. Based on the Drivers’ Behavior Questionnaire (DBQ), five clusters were defined by the cluster analysis in this paper. Meanwhile, on the basis of the driver behavior experiments on the passenger vehicle, and TTC strategy, a forward collision warning algorithm in accordance with the driver characteristics is presented. In this research, it is the key of the strategy to determine the warning-start logic and statistically estimate the warning threshold. Finally, the experiment results demonstrate that the algorithm is able to embody various types of driver characteristics and enhance the acceptance of FCWS. 1. INTRODUCTION With the rapid development of road traffic and the automobile industry, the quantities of vehicles and the number of drivers are growing rapdily. Meanwhile, traffic accidents are becoming more serious. In order to avoid accidents or reduce the loss resulting from the accidents, researchers pay more and more attention to DAS, which is mainly based on the techniques of traffic environment sense, risk judgment, vehicle control and collision warning / avoidance, and have also obtained some achievements, such as FCWS. As a part of DAS, FCWS can effectively help to avoid forward collision accidents and improve the traffic safety (Sugimoto M, et al., 2000; Marchau V, et al., 2005; Kyongsu Yi, et al., 2001). As the key technique of FCWS, the main function of the forward warning algorithm is to determine the warning-start logic and the warning threshold (Zhang Lei, 2006, Kangwon Lee, 2004). At present, there are mainly two kinds of forward warning algorithm, i.e. safe time logic algorithm and safe distance logic algorithm (Song Xiaolin et al., 2008). The representative model of safe time logic algorithm is the TTC model established by Tokyo University of Agriculture and Technology (H. Yoshida et al., 2005, 2008). The safe distance logic algorithm has many kinds of
640
ICCTP 2010: Integrated Transportation Systems— Green•Intelligent•Reliable © 2010 ASCE
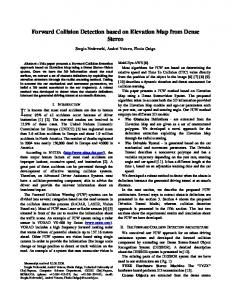
models, such as the model of fixed DHW, the model of fixed THW (Doi A,1994), and kinematics model (Ronald Miller, 2002; Yosuke Kobayashi, 2006). However, most warning algorithms used are fixed (Keiichi, 2006; Pongsathorn, 2006-2008), and cannot adapt to different drivers and changes of the same individual driver on different conditions. Besides, the characteristics of Chinese drivers and the traffic conditions of China are different from those of other countries. Hence, the present algorithms cannot be used directly in China. To solve this problem, this paper is committed to the research of FCWS based on driver characteristics. On the basis of driver behavior experiments on the passenger vehicle, as well as with the driver behavior questionnaire, a forward collision warning algorithm in accordance with the driver characteristics is presented in this paper. 2. DRIVER BEHAVIOR EXPERIMENTS In order to obtain the driving characteristics of individual drivers, driver behavior experiments based on the passenger vehicle were carried out and the experimental data of 33 drivers were obtained. Equipments for experiment. Equipment for the experiment included: a passenger vehicle, and corresponding test equipments, such as: Radar, GPS, Video Camera, Acceleration Sensor, Steering Angle Sensor, etc. (see Figure 1).
Figure 1. Passenger vehicle and equipment for experiment. Experiment design. The passenger vehicle experiment was carried out both on freeways and city roads. The contents of the experiment included typical conditions and free-driving conditions respectively (see Tables 1 and 2).
641
ICCTP 2010: Integrated Transportation Systems— Green•Intelligent•Reliable © 2010 ASCE
Table 1. Passenger vehicle experiment on freeway. Experiment Experimental Content Experimental Condition Typical Following at Lead vehicle: drive at 60km/h、70km/h、80km/h conditions cruise separately. condition Host vehicle: drive followed. Repeat three times. Total time: about 30 min. Following at Lead vehicle: accelerate from 60km/h to 80km/h accelerating (about 0.5m/s2), then decelerate from 80km/h to and 60km/h (about 0.5m/s2) . decelerating Host vehicle: drive followed. condition Repeat five times. Free-driving Following at Lead vehicle: drive freely. Try to reduce conditions free-driving lane-change. Host vehicle: drive followed according to his condition driving habit. Total time: above 40 min. Table 2. Passenger vehicle experiment on city road. Experiment Experimental Content Experimental Condition Typical Following at Lead vehicle: drive at 20km/h、30km/h、40km/h、 conditions cruise 50km/h separately. condition Host vehicle: drive followed, keep in the same lane. Total time: about 60 min. Following at Lead vehicle: accelerate from 20km/h to 40km/h, accelerating then decelerate to 20km/h. Accelerate from and 30km/h to 50km/h, then decelerate to 30km/h. decelerating Accelerate from 40km/h to 60km/h, then condition decelerate to 40km/h . Host vehicle: drive followed. Repeat five times. Free-driving Following at Lead vehicle: drive freely. Try to reduce conditions free-driving lane-change. condition Host vehicle: drive followed according to his driving habit. Total time: above 40 min.
642
ICCTP 2010: Integrated Transportation Systems— Green•Intelligent•Reliable © 2010 ASCE
Thirty-three nonprofessional drivers have taken part in the passenger vehicle experiment on freeways and city roads. Each driver drove for about 2 hours. 3. RESULTS OF DRIVER BEHAVIOR EXPERIMENTS After the experiment, the relationship among critical parameters, such as DHW, host vehicle speed, THW and TTC were statistically analyzed.
(a) Freeway(Driver 1) (b) Freeway(Total drivers) Figure 2. Distribution of speed - TTC at the point of accelerator pedal release.
(a) Freeway(Driver 1) (b) Freeway(Total drivers) Figure 3. Distribution of speed - TTC at the point of brake pedal activation. During the process of approaching the lead vehicle, two actions of the driver can embody the driver’s judgment for safety. One is the accelerator pedal release, and the other is the brake pedal activation. So it is important for FCWS to do research on when drivers begin to release the accelerator pedal and when they begin to activate the brake pedal. On approaching condition, from the distribution of speed - TTC when drivers begin to release the accelerator pedal (Figure 2a, 2b) and to activate the brake pedal (Figure 3a, 3b), it can be seen that TTC is centralized in
643
ICCTP 2010: Integrated Transportation Systems— Green•Intelligent•Reliable © 2010 ASCE
644
some area, although drivers are fluctuant and changed with time on these two actions. The results of the passenger vehicle experiment indicate that vehicle speed, DHW and THW at the point of braking all reduce slightly compared to at the point of accelerating (see Tables 3 and 4). On the other hand, TTCi (time-to-collision inverse) increases, which indicates that the latent risk of forward collision at the point of braking increases. Fluctuant ranges of DHW both are large, which means that DHW are not the only parameters for drivers to judge the dangerous condition. THW and TTCi can relatively embody drivers’ judgment mechanism. Drivers will take actions to avoid collisions when THW and TTCi departure the expect target and tend to dangerous conditions. Therefore, THW and TTCi (or TTC) can be used in designing the warning algorithm as the typical parameters to identify driver characteristics. Table 3. Statistical results of driver 1 at the point of accelerating. Mean Standard Deviation Max Min Vehicle speed (m/s) 17.03 4.19 23.19 9.01 DHW (m) 25.07 11.96 63.71 7.73 Relative speed (m/s) 1.69 0.73 3.51 0.44 THW (s) 1.44 0.44 2.76 0.84 -1 TTCi (s ) 0.07 0.02 0.11 0.05 Table 4. Statistical results of driver 1 at the point of braking. Mean Standard Deviation Max Vehicle speed (m/s) 11.89 3.10 16.19 DHW (m) 13.85 4.42 19.76 Relative speed (m/s) 1.46 0.71 2.58 THW (s) 1.20 0.38 1.89 -1 TTCi (s ) 0.11 0.05 0.18
Min 7.81 8.58 0.75 0.77 0.06
4. DRIVER BEHAVIOR QUESTIONNAIRE AND DRIVER CLASSIFICATION Driver behavior questionnaire (DBQ). As the driver is a complex agent, the driving characteristics are influenced by the driver’s skills, experience, vehicle state, traffic conditions and even the driver's physical and psychological state, and some other factors (Reason J., 1995; Herbert Yoo, et al., 1999; M. Canale, et al., 2002; Mark Brackstone, 2003). Not only are there differences among individual drivers, but even for the same driver, characteristics changes greatly under different conditions. The characteristic parameters identified simply from the vehicle state are not necessarily an accurate representation of the driver characteristics. In order to design the forward collision warning algorithm, which can reflect
ICCTP 2010: Integrated Transportation Systems— Green•Intelligent•Reliable © 2010 ASCE
the driver characteristics accurately, the real world experimental data were analyzed objectively to obtain the driver’s behavioral characteristics. Meanwhile, it is necessary to analyze and quantify the driver’s natural driving habits. Corresponding with the objective analysis, it is also a common research method to carry out the analysis of the data that was collected from the driver's subjective feeling characteristics. In this paper, the method of subjective questionnaire is taken, which is widely used in the field of driving behavior. With 51 drivers as study objects (including 33 drivers participating in the real world experiment, 6 females as part of the sample), based on DBQ put forward by Reason, et al., a self-administered driver's subjective questionnaire is designed to measure the driving behavior (J. T. Reason, et al., 1990). The questionnaire (as shown in Zhang Lei (2009)) includes 59 items and each item describes one driving behavior. The driver is asked to give the occurrence frequency of each act. In this section, the unified options based on Li Ke-specific sequence are designed, that is, we use six incremental numbers from 0 to 5 to indicate the frequency of one behavior, where, "0" means "never", "1" means "very less", "2" means "sometimes", "3" means " often", "4" means "frequently", "5" means "almost always". Quantitative description is achieved through this. Driver classification based on DBQ. Taking the clustering rules that existing in population prevalence into account, the same type or pattern of drivers will have a certain consistency in trends of characteristics. Thus, by analyzing the driver’s abnormal behavior patterns from the point of clustering, and matching different algorithm parameters in algorithm design, the results will be more representative and applicable, and can eliminate the influence of individual errors. Based on this idea, use pattern recognition method based on cluster analysis to conduct cluster studies of the abnormal behavior of the pilot samples, and establish the distribution of space of the pilot model. The result is shown in Figure 4. F1 represents the driver characteristic called error-prone, and F2 the driver characteristics called illegal-prone.
Figure 4. Analysis results of fuzzy clustering based on the driver internal characteristics pattern.
645
ICCTP 2010: Integrated Transportation Systems— Green•Intelligent•Reliable © 2010 ASCE
646
The five clusters above respectively represent five kinds of abnormal behavior trends of the driver. The 33 drivers involved in the real world experiments were also divided into five clusters. The various types of cluster centroids, the number of samples, as well as a description of trends in driver’s abnormal behavior are shown in Table 5. Table 5. The cluster centroid, sample size and characteristic description of the driver pattern. Cluster Cluster Centroid Sample Size
Characteristic Description
A
[0.13, -0.37]
6
neutral error-prone, neutral illegal-prone
B
[-0.73, 0.62]
12
small error-prone, big illegal-prone
C
[-1.20, -0.99]
5
small error-prone, small illegal-prone
D
[0.98, 1.29]
5
big error-prone, big illegal-prone
E
[1.30, -0.91]
5
big error-prone, small illegal-prone
5. FORWARD COLLISION WARNING ALGORITHM BASED ON DRIVER CHARACTERISTICS Based on the analysis of real world experimental data and the questionnaire results, forward collision warning algorithms based on driver characteristics are proposed. In this section, a TTC-based warning algorithm is presented. Confirming the warning-start logic and algorithm parameter is the key point. Warning-start logic. In order to accord with the reaction characteristics of drivers, the warning algorithm of FCWS needs to simulate the judgment progress of the driver to the risk of forward collision. According to analysis of the experiment results, the TTC distribution of different drivers is different, which can be used to determine whether to decelerate in order to avoid a collision. The warning-start logic in this paper is based on TTC. For a driver, there are three states for FCWS: (1) State of non-start IF TTC> W1 || Brake==1, THEN S=0
(1)
Brake----Brake signal from the host vehicle. W1----Start threshold for warning class 1. S----State class When TTC is bigger than W1 or the driver is braking, FCWS will not start. That is to say, the state class (i.e. S) is 0. (2) State of warning class 1 IF W1>TTC> W2 && Brake==0, THEN S=1
(2)
ICCTP 2010: Integrated Transportation Systems— Green•Intelligent•Reliable © 2010 ASCE
647
W2----Start threshold for warning class 2. With the increasing of the latent criticality of forward collision, when TTC is between W1 and W2. Meanwhile, if the driver does not brake, FCWS will start warning class 1. The yellow sign “Danger” displays on the dashboard and a normal alarm is given. The state class (i.e. S) is 1. (3) State of warning class 2 IF TTC