Forward Collision Warning System Based on THAS V-I Platform ZHANG Lei, WANG Jianqiang, LI Keqiang
Abstract-This paper presents a forward collision warning system based on Tsinghua Active Safety Vehicle Platform, THASV-II. The system includes several modules to implement different functions including obstacle detection, data collection, information
processing, warning signal generation, and
This paper presents a forward collision warning system based on Tsinghua Active Safety Vehicle Platform, THASV-II. The hardware modules are developed to implement different functions including obstacle detection, data collection, information processing, warning signal generation, and
human-machine interface display. In the collision warning algorithm design, a criterion named 'Safety Degree Value (SDV)' is investigated to present the driver's estimation of the safety state. Car-following tests involving 40 driver subjects are conducted on the THASV-II platform and the algorithm is proposed with the test data. The system generates audio and visual warning information with several warning levels and the simulation shows
human-machine interface display. A criterion named 'Safety
driver's braking behavior.
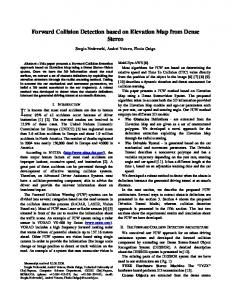
II. SYSTEM ARCHITECTURE The THASV-II platform provides adequate vehicle state information and a communication network based on CAN bus. The hardware of the forward collision warning system is
that the warning output of the system is in accordance with
Index Terms-forward collision warning system, car-following, collision warning algorithm, safety state.
I. INTRODUCTION A great percentage of road accidents are caused by the driver's distraction and operation mistakes. Providing adequate assistance for the driver by intelligent systems, such as forward collision warning system (FCWS), has been an effective approach to avoid road accidents [1]. Generally, FCWS is composed of several elements including sensors to receive the obstacle and vehicle signals, information processor and human-machine interface [2]. The system detects frontal obstacles by sensors such as radar and camera, and triggers warning signals when potential collision is predicted. Several frontal collision warning systems have been developed by some automotive manufacturers and research groups, such as the FCWS by MobileEye Vision Technologies, Israel [3], the VORAD system by Eaton, USA [4], and the Forwarn system by Delphi, USA [5]. All of the systems need interaction with the human driver and influence the driver's operation. Accordingly, more study on the driver's characteristic and behavior must be taken to improve the accuracy, comfort and adaptability of the FCWS.
Degree Value (SDV)' is investigated to present the driver's
estimation of the safety state. Based on the criterion and the data from car-following tests involving 40 driver subjects, a collision warning algorithm is proposed and several warning levels are designed in the system.
developed based on this platform. The modular architecture of the system is shown in Figure 1.
IO..a a Selsos
LIDAR
Vde Ste ECU
liltInI
Vehicle Speed
e
Acceieratiof Brake Signal
IIDARECU RtveSpeed
CNX FGWS ECU
RS232
Warning
m Fig. 1. The system architecture based on CAN bus
The vehicle state signals, such as vehicle speed, vehicle
ZHANG Lei, State Key Laboratory of Automotive Safety and Energy,
acceleration and brake signal, are collected by a ECU from the
WANG Jianqiang, State Key Laboratory of Automotive Safety and Energy, Tsinghua University, Beijing, China (e-mail: wjqlws@,tsinghua.edu.cn). Prof. LI Keqiang, State Key Laboratory of Automotive Safety and Energy, Tsinghua University, Beijing, China (phone: 0086-10-62788774; e-mail: likq@tsinghua. edu.cn).
onboard sensors of the platform. The information of the frontal obstacles including relative distance and relative speed is also collected by a ECU from the lidar. After signals
Tsinghua University, Beijing, China (e-mail:
[email protected]).
1-4244-0759-1/06/$20.OO ©2006 IEEE.
- 255 -
poesnaduelsobtcsfirto,althifrmin
used in the collision warning algorithm is transmitted to the
CAN bus. Another ECU, which is named FCWS ECU in Figure 1, receives the information and executes the algorithm to calculate the vehicle safety state. If some potential collision danger is predicted, the FCWS ECU will send warning commands to the warning interface via a serial port and the interface will provide audio and visual warning signals to the driver. The speed and distance are also displayed on the interface. Figure 2 shows the pictures of the platform vehicle, ECU,
In (1), TR, Tsys and aM are constants, so dSTop is concerned with the two vehicles' initial state (VF, VL, d) and aL. If no collision happens during this process, dSTop should satisfy: (2) dsTOP > 0
StOP
hS1re
have2
aL_< 2
L
2(d + 2
lidar, and warning interface fixed on the vehicle panel.
=_a(3)LM
V_L
+ VF (TR + SY))
From (3), only if the leading vehicle's deceleration is less than aLM, does the driver of the following vehicle have the ability to avoid collision. Thus, aLM is a threshold value which can present the safety degree when the two vehicles' state iS VF, VL and d. We assume that the two vehicles have the same maximal deceleration am, and then define a dimensionless
Fig. 2. The platform vehicle and the components of the FCWS. Left: The vehicle, ECU and lidar. Right: The warning interface equipped in the vehicleM
III. SAFETY DEGREE VALUE2 Analyzing the vehicle kinematics is a common method for investigating collision warning algorithms [6][7]. We develop a criterion named 'Safety Degree Value (SDV)' to describe the vehicle safety state during car-following. The SDV is defined by the braking kinematics analysis ofthe two vehicles, which is shown in Figure 3.
|-LeadingVele
,Speed < |g |
l
I
I
|
~~FoloingLVeIclI
K
aM
SDV =aLM
(4)
Substituting (3) in (4) and using VR and VF to replace VL we have: SDV =
(VF-~VR)
2aM (-d + F+ VF
(5) (T+TSS)
M 2aM The above analysis indicates that SDV is a criterion which could describe the following vehicle's safety state, and the parameters in (5) could be measured expediently. In order to investigate the variation of SDV during car-following and the relationship between SDV and driver behavior, car-following tests are conducted to obtain driver
SL e X ~~~~~~~~~~~behavior data.
IV. CAR-FOLLOWING TEST | E \
| 8 0 __ E_____,,
the tests, we use two instrumented vehicles, including a ~~~~~~~~~~In leading vehicle and a following vehicle, to perform the ~~~~~~~~car-following scenario on a test track, as in Figure 4. The THAS V-IlIplatform is equipped on the following vehicle.
\ \ \
Fig. 3. The braking kinematics analysis
leaint veil' sed IsLanthe At th iniia tim dtbk the following vehicle' speed istain. Thaue reltivedie'srspeedsbtwee
time TR and the delay of the braking system Tsys, the variable dsTop, which presents the distance when both of the two vehicles stop, can be given as: dSTOP
d+
-
2aL
2aM
-VF(TR+TSYS)
(1)
- 256 -
Fig. 4. The car-following test
A. Test Subject The test subjects are 40 common drivers including 35 males and 5 females. Table 1 shows the distribution of the driver age and driving year. TABLE 1
DRIVER AGE AND DRIVING YEAR DISTRIBUTION Age
Amount
Year
Amount
20-30 30-40 40-50
11 15 11
0-10 10-20 20-30
18 12 7
50-60
3
30-40
3
We also prove the above analysis by other drivers' data and
find the same phenomena and results. Because ofthe difference
in driving style, experience and age, drivers may have different behaviors of collision avoidance. The statistics of SDV can also indicate this difference. To each driver, we calculate the SDV at his first brake time during every approaching (the relative speed is more than zero). The data of all the drivers is gathered to analyze data distribution. The accumulated frequency of SDV indicates that more than 50% ofthe data is focused on the range between [0.4 0.7], as in Figure 6. This statistical result can be used in the design of collision warning algorithm. 100
B. Test Scenario B. Test Scenario During the tests, the movement of the leading vehicle is the same to different subjects. A test assistant drives the leading vehicle at 20, 30, 40, 50, 60km/h, and some acceleration and deceleration processes are also included in the scenario. Each driversubject drives the following vehicle to follow the leading 40
vehicle independently.
9~~~~~~~~~~~~~~~~~~~~~~~~0 ---~ ----~~ 6
L so ------------------
--------
-------------111----------
I-------I
--------
---------.--------.-----------I-----,----I--------|-a|_||a|||_|_--------
C. Data Collection THASV-II platform is used to obtain the data of the two vehicles, which includes vehicle speed, relative distance, relative speed, the following vehicle's acceleration, throttle angle, and brake signal. V. DATA ANALYSIS BASED ON SDV After obtaining real data by car-following tests, we also meaur terier' veag rspns tme te ehcl bak time, the vehicle maximal delay dlay and thevehcle system systm ime an axial deceleration ecelraton. Consequently, the SDV during the following can be calculated according to Equation (5). Figure 5 shows the SDV variation during onedriver's test.
-------- --------
20
10 02
-r
----r
.
.
---r .
-------
----
-----------
_
1
afe5 t- Degree alue
2
Fig. 6. The accumulated frequency of SDV VI. COLLISION WARNING ALGORITHM
It has been confirmed that varying the timing of forward collision warnings in accordance with the driver's alertness level ccouldd reduce unnecessary warnings [6]. Therefore, we wacrings []thereforee, eninecessar according level to the safety degree, design several warning levels provide different warning signals to the driver. Figure 7
~~~and
shows the
algorithm
_~~~~~~~~~~~~~~~~~~~~~~~~~~~~~~~D
flow chart.
.he
R..
A Il cSDV
dSwl l.
Al&UfimiPipmmm
FI>
Tiii Fig. 5. The variation of safety degree value (SDV)
Comparing the SDV curve with the driver's brake signal, we can find that the driver presses the brake pedal with the SDV
curve descending and releases the pedal with the curve ascending. Another apparent phenomenon is that, the SDV at each brake time is distributed in a relative small range, as in Figure 5. It means that, to a certain extent, the concept of SDV accords with the driver braking behavior and could present the olso agr
driver's~~~~~~ esiaino.owr
>SD V>
i4D
W^fgpFig. 7. The collision warning algorithm flow chart
The algorithm includes four levels presenting different safety states. We selected the safety degree values at 2500, 5000,
- 257 -
and 75% in Figure 6 as the algorithm parameters: So, SI and S2. Table 2 and Table 3 show the warning level meanings and parameter values respectively. The data of car-following tests is used to validate the effectiveness of the algorithm. Figure 8 (a) shows the two
4A
TABLE2 LEVEL MEANINGS
Level 1
Level 2
Level 3
Safe
Attentive
Danger
Emergent
0.54
1 0.46
4
--
--
------|----------r
-
-
I-
---7M
-
10
20
I-
-
30
Time [s]
0o
40
1N/ky
6
70
5l o
30
I
40
Time [s]
50
__,
60
70
REFERENCES
, , ., , S , | , /\ /, t ' l / ' a
----------------
a
20
More research will be conducted to improve the warning performance and the driver acceptance of the system in the future work.
--------
I' L0
_-
The simulation shows the validity of the algorithm.
2--------|----------|----------|---------|----------|------/---|-8 -
20
10
Fig. 8. (c) The warning signal and driver's brake signal
Fig. 8. (a) The speed of the two vehicles 1
25
L
This paper introduced a forward collision warning system based on the THASV-II platform. Several conclusions are obtained. l) A modular architecture of the system is established and all the messages can be transmitted via CAN bus. This system provides a flexible and open platform for the development of FCWS. 2) A criterion named 'Safety Degree Value' is proposed to present the driver's estimation of danger. The data analysis shows the corresponding relationship between the criterion and driver behavior. A 3) collision warning algorithm based on 'Safety Degree .. Value (SDV)' is investigated with function of level warning.
----
00
--------0
vehicles' speed and Figure 8 (b) shows the relative distance. The warning signal calculated by the algorithm with the real data is shown in Figure 8 (c). The three figures are in the same time line. It indicates that the warning signal is in accordance with the driver's braking behavior and the warning information is provided to the driver level by level. 16 Fthe llowing 1ehicle 114 1-the Leading Vehicle , ,7 -
> (i |r--e5ff5---------- ----- -----
a Si naSic 1nal: , , ~~~~~Warnihg
.5 2
TABLE 3 PARAMETER VALUES 0.68 *____________
----------
r
m
Level 0
I l
Driver:ETakeSinaI
X
,
X,
,
[1] A. Barrientos, A. Mora, I. Lafoz, R. San Martin and P. Mufioz, "CAWAS: Collision Avoidance and Warning system for Automotives based on
on Satellite," Proceedings of the 8th International IEEE Conference
Intelligent Transportation Systems, pp.656-661, Austria, September 2005. --[2] E. Lemaire, El-Miloudi El Koursi, P. Deloof, Jean-Pierre Ghys, "Safety l IAnalysis of a Frontal Collision Warning System," IEEE Intelligent l Vehicles Symposium, vol. 2, 453 - 458, June 2002. E. Dagan, 0. Mano, G. P. Stein, A. Shashua, "Forward Collision Warning ,[3] , \with a Single Camera," IEEE Intelligent Vehicles Symposium, pp. 37-42,
Italy, June 2004. [4] EATON VORAD, "The Benefit of Collision Warning System for Commercial Vehicles," Presentation at ITS America 2001 Annual Meeting, June 2001. l __l [5] Dephi Automotive Systems, "Collision Warning Systems. Forewarn ____ 20 30 40 Adaptative Cruise Control", 2001. io1 50 e r [6] Keiichi Yamamoto, "Development of alertness-level-dependent headway Timre [s] Fig. . (b Theelatve dstanc beteen he tw vehclesdistance warning system, " in JSAE Review 22 (2001) pp. 325-330 Qingfeng Huang, Ronald Miller, Perry McNeille, David Dimeo and * ~~~~~~~~~~~~~~[7] Gruia-Catalin Roman, "Development of a Peer-to-Peer Collision Warning System, " Ford Technical Journal, vol. 5, no. 2, March 2002 | IJ
Q
- -- |- - -- -- - -- -- -- -- - -- I- -- -- -- --- -l- -- -- ------- - ---n-- -------
--- l
e
I__ l__ l__ l__
- 258 -