present a framework which is a first attempt to formalize the evaluation of data quality. It is based on a graph model of the data integration system which allows ...
A Framework for Data Quality Evaluation in a Data Integration System 12
2
1
1
Verónika Peralta - Raúl Ruggia - Zoubida Kedad - Mokrane Bouzeghoub 1 Laboratoire PRISM, Université de Versailles, FRANCE 2 Instituto de Computación, Universidad de la República, URUGUAY e-mail: {vperalta, ruggia}@fing.edu.uy, {Zoubida.Kedad, Mokrane.Bouzeghoub}@prism.uvsq.fr
Abstract To solve complex user requirements the information systems need to integrate data from several, possibly autonomous data sources. One challenge in such environment is to provide the user with data meeting his requirements in terms of quality. These requirements are difficult to satisfy because of the strong heterogeneity of the sources. In this paper we address the problem of data quality evaluation in data integration systems. We present a framework which is a first attempt to formalize the evaluation of data quality. It is based on a graph model of the data integration system which allows us to define evaluation methods and demonstrate propositions in terms of graph properties. To illustrate our approach, we also present a first experiment with the data freshness quality factor and we show how the framework is used to evaluate this factor according to different scenarios.
1. Introduction The needs of accessing in a uniform way to information available in multiple data sources are increasingly higher and generalized. Such information requirements are often solved by implementing complex data manipulation processes, which involve views or queries on data from heterogeneous and autonomous sources. As the potentially retrieved data grows, users are more and more concerned about the quality of these results [20][8][1]. The quality of the resulting data depends mainly on the quality of the data sources and the characteristics of the manipulation process that builds the resulting data from the sources. More concretely, quality depends on the internal quality of the sources (their coherence, their completeness, their freshness, etc.), on the confidence about the producers of these sources, and also on the ways of production of the information returned to the user. In a context where the information is produced by sophisticated aggregation algorithms, the quality measurement requires a fine knowledge of the computing process of this information. Furthermore, the heterogeneity of the data sources (e.g. data formats and semantics) adds complexity to the evaluation of the quality of the finally returned information. For example, let us consider an Internet query asking for the most popular children videos. The result may be different depending on which sources are queried as well as on the algorithm used to decide which videos are popular and which are not. If we ask only a few sources that are specialized in Disney® videos, the result will be clearly incomplete. If we ask the most important video vendors’ sources, we risk at omitting some videos but we can think that the result is complete enough. We can search in the entire Internet or we can ask only the sites we trust, having different results, too. Finally, we can keep the intersection of such recommendations or the union of all of them; we can select the list of videos from the source that has the most recent statistics or follow another strategy. All these considerations influence the final result: the list of popular children videos.
To evaluate the quality of the data returned to the user in a Data Integration System (DIS), we should consider the quality of the different data sources and also to take into account the processes that extract, integrate and convey the data to the user. This paper addresses the problems of evaluating the quality of data resulting from a DIS. To achieve this, the paper proposes a framework which is a first attempt to formalize the different elements involved in data quality evaluation. Among these elements there are source databases, classes of user queries, processes that extract, integrate and convey data, metadata describing system features, quality measures and quality evaluation algorithms. In our framework, Data Integration Systems are modeled as workflows of calculation activities, in order to enable the representation of complex data manipulation operations. The quality evaluation algorithms are based on the workflow’s graph representation. They are defined in terms of graph methods and graph properties can be used to validate propositions. The idea behind the framework is to define a flexible context which allows to take into account new quality factors, DIS metadata and evaluation algorithms. To illustrate this approach we present a first experiment using data freshness as a specific quality factor, and we show how the framework is used to evaluate this factor according to different scenarios. The rest of the document is organized as follows: Section 2 introduces the framework and describes the quality evaluation basis using graph properties. Section 3 shows the application of the framework to the evaluation of data freshness. Finally section 4 discusses related work and section 5 concludes. 2. A Data Quality Evaluation Framework In this section we present a framework for data quality evaluation in the context of a DIS. The framework models the DIS processes and properties, which are necessary to evaluate data quality. Generally speaking, information systems can be viewed as information manufacturing systems [1] in which the information returned to the user is the product, the source data is the raw material and the algorithms or processes that compute the resulting information are the manufacturing processes. Different manufacturing processes can be studied and compared in order to select the best implementation for the system. In this context, the quality of data produced by each process becomes an important element for such comparison. The objectives of the framework are: (i) model alternative processes, (ii) calculate the quality of the information products built following each process, (iii) compare alternative processes, and (iv) decide if information products meet user quality expectations. The proposed framework performs the data quality evaluation through the application of different evaluation algorithms, each one specialized in the measurement of a quality factor. The algorithms take as input a calculation process and evaluate the quality of the data returned to the user following that process. We define the framework as follows: Definition 1. The quality evaluation framework is a n-uple:
where Sources is a set of available data sources, QueryClasses is the set of classes of user queries that the DIS must solve, CalculationDAGs is a set of dags representing the alternative processes that can implement the DIS, Properties is a set of properties describing system features and quality measures and Algorithms is a set of quality evaluation algorithms. The following subsections describe the framework and its components.
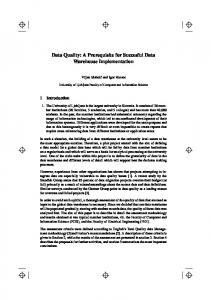
2.1. Modeling the Data Integration System A Data Integration System is an information system that integrates data of different independent data sources and provides the users with a uniform access to the data by the mean of a global model. User queries are expressed in terms of the global model. Examples of DIS are Mediation systems, where data is extracted from several sources, integrated and presented to the user; wrapper-mediator architecture [21] is commonly used to perform these tasks. Data Warehouse (DW) systems [9] also extract, transform and integrate information from various, possibly heterogeneous, sources and make it available for strategic analysis to the decision makers. Other examples are federations of databases [17] where a key characteristic is the preservation of data source autonomy and Web Portals which provide access to subjectoriented information acquired and synthesized from Web sources, generally caching important amounts of data [4]. The DIS can be viewed as a workflow in which the activities perform the different tasks that extract, transform and convey data to end-users. Each workflow activity takes data from sources or other activities and produces result data that can be used as input for other activities. Then, data traverses a path from sources to users where it is transformed and processed according to the system logics. The data produced by an activity can be immediately consumed by other activities or it can be materialized for being queried later. Note that this notion of activity can represent processes of different complexity; from simple SQL operations to complex transformation procedures that can execute autonomously. Figure 1 sketches the workflow representation of a DIS process. On the bottom diagram there are remote sources (Si). On the middle diagram there are the different activities (Ai) whose inputs are source data. The arrows indicate that the output node uses the data returned by the input node. The activities that directly take input data from sources are the wrappers that perform the data extraction from sources. The other activities take input data, directly or indirectly, from wrappers. On the top diagram there are the user query classes (Qi) representing families of queries that can be solved using the data produced by activities. Query Classes
Q1
DIS Activities
A7
Q2
Q3
Q4
A8
A9
A6 A5
Source Relations
A4
A1
A2
A3
S1
S2
S3
Figure 1 – A workflow representation of a DIS
Formally, we represent the DIS workflow by means of a directed acyclic graph (dag) that describes the involved activities, their inputs and outputs. The dag shows the data paths from sources to user queries within the different activities. Definition 2. A calculation dag is a dag G defined as follows: The nodes of G are of three types: source nodes (with no input edges) that represent the sources, target nodes (with no output edges) that represent query classes and activity nodes (with both input and output
edges) that represent the different activities that calculate the set of target nodes from the source nodes. The edges of G represent that a node is calculated from another (the data flows in the sense of the arrow). Example 1. Consider the DIS of Figure 1 which provides meteorological information. There are three sources: S1 with real time satellite meteorological predictions, S2 with official meteorological predictions from a french dissemination database and S3 with information taken by climatic sensors. The goal of the system is to provide meteorological information to solve four classes of queries: Q1 (historical information about climate alerts), Q2 (detailed data comparing predictions), Q3 (aggregated data about predictions) and Q4 (aggregated data about climate measurements). The DIS is composed of nine activities that process the information performing the data extraction, integration and aggregation. The activities A1, A2 and A3 are the wrappers, while A4 filters information keeping only the data about the metropolitan regions of France. Activity A5 integrates information extracted from sources S1 and S2, adding comparison indicators and checking some integrity constraints. A6 joins information produced by A4 and A5 and materializes the result. A7 aggregates information keeping historical materialized data about drastic changes in climate alerts. A8 also performs aggregations. Finally, A9 reorganizes input information ordering it by region. The edges entering to A6, for example, indicate that data produced by A4 and A5 is used as input in the integration process and the edges coming out A6 indicate that integrated data is used as input for activities A7 and A8 and it supports user queries of class Q2. 2.2. Quality Factors and Properties In this section we describe the quality factors and the metadata necessary to express system quality. To carry out data evaluation we firstly need to identify which quality factors to evaluate. The choice of the most appropriate quality factors for a given DIS depends on the user applications and the way the DIS is implemented. Several works study the quality factors that are more relevant for different types of systems, for example [20][18][1]. The selection of the appropriate quality factors implies the selection of metrics and the implementation of evaluation algorithms that measure, estimate or bound such quality factors. In order to calculate quality values corresponding to those factors, the algorithms need input information describing system properties such as, for example, the time an activity needs to execute or a descriptor stating if an activity materializes data or not. These properties can be of two types: (i) descriptions, indicating some feature of the system (costs, delays, policies, strategies, constraints, etc.), or (ii) measures, indicating a quality value corresponding to a quality factor, which can be an actual value acquired from a source, a calculated value obtained executing an evaluation algorithm or an expected value indicating the user desired value for the quality factor. The selection of the adequate properties depends on the quality factors that are relevant for the system and on the calculation processes. Example 2. Consider a system where users are interested in the evaluation of response time and freshness. To calculate the response time, it is necessary to know which activities materialize data and the execution cost of the activities that do not materialize data. To calculate the data freshness it is also necessary to know the refreshment frequencies and costs as well as the actual freshness of the data in the sources. Other examples of properties can include execution policies, source constraints and communication delays.
We define a property as follows: Definition 3. A property is a 3-uple where the Name is a String that identifies the property, Metric is a description of the measurement semantics and units and DataType describes the domain of the property values. The data types can be basic types as Integer, String or Date, or complex ones, for example the availability of a source can be represented as a sequence of time intervals. A property is related to certain nodes or edges of the calculation dag. For example, we can associate availability constraints to source nodes, availability expectations to target nodes and communication delays to the edges between sources and wrappers. Then, we need to model different types of nodes and edges in order to associate the different properties to such types of nodes and edges. The following definition formalizes the association of properties to the calculation dag. Definition 4. A labeled calculation dag is a calculation dag whose nodes and edges have associated a set of property values: G = (V, E, VT, ET, type, P, prop, propvalue)
where: − V and E are the set of nodes and edges of the calculation dag. − VT and ET are types of nodes and edges. − The type function assigns a set of types of nodes or edges to the nodes and edges of the dag. It is defined as: type: V ∪ E P (VT) ∪ P (ET), where P is the potency set. − P is a set of properties. − The prop function assigns a subset of properties to each node and edge type. It is defined as: prop: VT ∪ ET P (P). − The propvalue function assigns a value to each property of each node and edge of the dag (The property must be associated to a type of node/edge of the node/edge). It is defined as: propvalue: {x / x ∈ (V ∪ E)} × {p / p ∈ P ∧ (∃t) (t ∈ (VT ∪ ET) ∧ p ∈ prop(t) ∧ t ∈ type(x))} p.DataType 2.3. Evaluation Algorithms The quality evaluation is performed by evaluation algorithms that take as input a labeled calculation dag, calculate the quality values corresponding to a quality factor and return a calculation dag with an additional property (corresponding to the evaluated quality factor). In this way, different evaluation algorithms can be successively executed over a calculation dag in order to evaluate different quality factors. The calculation dag must be labeled with certain properties in order to execute a certain algorithm. For example, the activity nodes of a calculation dag must be labeled with their execution cost in order to execute certain algorithm that evaluates the response time of the system. We characterize an algorithm as follows: Definition 5. An evaluation algorithm is a n-uple: A =
where: − Name is a String that identifies the algorithm. − The Input is a labeled calculation dag.
− Precondition is a set of pairs indicating that the property must be associated to the type of nodes or edges in the input calculation dag. − QFactor is the quality factor that the algorithm evaluates. − Types is a set of types of nodes and edges to which the new property (corresponding to the quality factor) will be associated. − The Output is a calculation dag labeled as the one given as input and also labeled with the evaluated quality factor. Evaluation algorithms must satisfy Definition 5 but the framework does not constraint the way they can be implemented. For example, the data freshness quality factor can be evaluated in a bottom-up way, that is, calculating the freshness of the data produced by a node in terms of the freshness of the data coming from input nodes and adding some costs (for example the execution costs of activities). The response time quality factor can be evaluated in a top-down way, starting at target nodes and adding execution and communication costs of predecessor nodes until arriving to a materialized activity node or a source node. The proposed DAG representation facilitates the implementation because it enables to use graph primitives (predecessors, successors, get properties, etc.) and traversal methods (find the shortest path, depth-first search, etc.). For example, the response time quality factor can be expressed as the most expensive path from sources or materialized nodes, taking as cost function some combination of nodes and edges properties. The flexibility of Definition 5 and the facilities provided by the graph model are important properties of the framework because they enable the extensibility of the global environment with new algorithms. In the next section we present the evaluation of data freshness as an example of how the evaluation algorithms can be defined. 3. Using the Framework to Evaluate Data Freshness Factors In this section we apply the framework to evaluate data freshness. We first discuss freshness definitions and metrics. Then we show how to define data freshness in terms of the calculation dag and discuss some ideas about using the framework to enforce data freshness. 3.1. Data Freshness Intuitively, the concept of data freshness introduces the idea of how old is the data: Is it fresh enough with respect to the user expectations? Has a given data source the most recent data? Is the extracted data stale? When was data produced? Data freshness has not a unique definition in the literature. There are various definitions concerning different concepts and metrics, which are mainly due to the different objectives of the systems where they are used. In this section we analyze data freshness definitions and metrics. Data freshness comprises a family of quality factors each one representing some freshness aspect and having its own metrics. For that reason freshness is commonly mentioned as a quality dimension [10]. From a user point of view, we distinguish two sub-dimensions of this quality dimension. − Currency factor [16]: It captures the gap between the extraction of data from the sources and its delivery to the users. For example, currency indicates how stale is the account balance presented to the user with respect to the real balance at the bank. − Timeliness factor [20]: It captures how often data changes or how often new data is created in a source. For example, timeliness indicates how often the product prices change in a store or how often new books are added to a library.
Analogously, other sub-dimensions can be defined. For example, consider a source that is frequently updated but continues having old data that is never updated (sometimes not representing real-world phenomena). The oldest data may introduce some noise on query evaluation. A freshness factor that captures how old is the oldest data in a source can be useful. A metric is a specific instrument that can be used to measure a given quality factor. There might be several metrics for the same quality factor. Table 1 describes the metrics proposed in the literature for measuring data freshness, classified by sub-dimension. In [3] we present a larger description of each metric and we discuss how existing systems define and evaluate freshness. Factor Currency
Timeliness
Table 1 – Summary of freshness factors and metrics Definition The time elapsed since data was extracted from the source (The difference between query time and extraction time) [16][19] Obsolescence The number of updates transactions/ operations to a source since data extraction time [7] Freshness rate The percentage of tuples in the view that are up-to-date (have not been updated since extraction time) [5][11]. Timeliness The time elapsed from the last update to a source (the difference between query time and last update time) [14]. Metric Currency
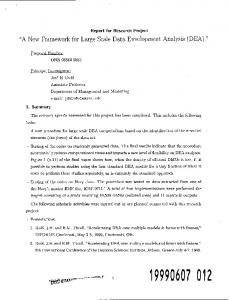
3.2. Properties Associated to Freshness In this section we describe the properties that are important in the evaluation of data freshness. Along this section we will reference the labeled calculation dag of Figure 2 which adds properties to the calculation dag of Figure 1.
Figure 2 – Labeled calculation dag
The freshness of the data delivered to the user depends on the execution delay of the system, which is the amount of time from data extraction to data delivery. This length of time is influenced not only for the processing cost of each activity (the time the activity needs for executing) but also for the delays that can exist between the executions of consecutive
activities. These delays are determined by the execution policies of the system and the access constraint of the sources. The following properties describe the execution delay of the system: Execution policies. We consider three possible execution policies for an activity depending on the synchronization with predecessor and successor nodes: − Input-synchronous: The activity is synchronized with its predecessor nodes. The activity starts its execution when it receives a notification about new available data in one of its inputs. − Output-synchronous: The activity is synchronized with its successor nodes. The activity starts its execution when it receives a notification of some successor that needs new data, then, the activity has to execute to provide this new data. − Asynchronous: The activity is not synchronized with predecessor nor successor nodes. The activity starts its execution when it receives a notification from the system. We consider that the system sends periodic notifications, then there is a fixed amount of time (period) between two consecutives executions. The execution policies of the activities depend on the type of system. For example, in a mediation system all the activities have output-synchronous policies but in a materialized data warehouse the activities that answer user queries from materialized data follow outputsynchronous policies while the activities that refresh the materialized data follow asynchronous policies. In heterogeneous systems that combine several synchronization policies the synchronization between every pair of activities should be studied. In Figure 2 activity nodes are labeled with the EPolicy (execution policy) property, which values are IS (input-synchronous), OS (output-synchronous) and A (asynchronous). Activities with asynchronous policies have also associated the Period (execution period) property, expressed in hours. Synchronization delays. When two consecutive activities in a path have different execution frequencies (due to different execution policies) the data produced by the former must be materialized for being queried later by the latter. In this case, there is a synchronization delay. The synchronization delay between two activities is the amount of time passed between the end of the execution of one activity and the start of the other. The synchronization delays are very important in the evaluation of data freshness because they introduce extra waiting time for data and consequently they decrease the data freshness. The algorithms that determine the delays between two activities (or estimate them in the worst case) are presented in [15]. Figure 2 also shows edges labeled with the Delay (synchronization delay) property. As activities A3, A4, A8 and A9 are output-synchronous there is not delay with their successors. Analogously, there is no delay between activity A5 and its predecessor because it is inputsynchronous. However, as A6 and A8 have different policies the data produced by A6 can have been materialized for almost 10 hours when read by A8, then the delay will be 10 hours in the worst case. Imagine that source S2 materializes data once a day and the data is read by A2 two hours after materialization (delay is 2 hours) and sources S1 and S3 do not materialize data (no delay). When there is materialization, the delays with target nodes are the refresh periods of the materialized data. Access constraints. In some situations, the sources do not allow the DIS to continuously query them, or it is very expensive to query a source very often. We can express such constraints giving a maximum access period for data extraction. The access period is the lowest time interval that a source allows between two consecutive data extractions. Note that in the presence of access constraints, the wrapper must periodically materialize data to assure
the availability of source data (asynchronous execution policy). The access constraint should be explicitly defined by the source provider, the system designer or both. Following the example, as S2 materializes data once a day it has no sense to query it more frequently (constraint of 24 hours). Also consider that source S1 is expensive, so the system administrator has contracted to query it every 12 hours. S3 has no access constraint and can be queried at every moment (constraint is 0). Figure 2 also shows the AccessConstraint property. Processing costs. The processing cost of an activity is the amount of time, in the worst case, necessary for reading input data, executing and building result data. Each activity needs some time for executing and obtaining a result; this amount of time is the processing cost. There are several delays due to the execution of the activity. For wrappers, it involves the time necessary for communicating with the source (sending the request and waiting for the response), the time for computing the extraction query and the time for materializing the changes (if needed). For the other activities, it involves the time for reading input data, computing and materializing the result (if needed). Communication time can be estimated using statistics of previous executions. Computation and materialization times can be estimated using cost models. Our approach is independent of the cost model used but the estimation depends on it. The determination of the appropriate cost model depends on the freshness metric. For example, consider the evaluation of timeliness in a system where the communication costs and the update propagation costs are negligible compared to synchronization delays (days, months). A cost model for that system can neglect the processing costs of the nodes. However, if the activities are complex or require user interaction needing a considerable amount of time to execute, their cost should be modeled. Figure 2 shows the Cost (processing cost) property labeling activity nodes. Actual and Expected Freshness. The actual freshness is a measure of the freshness of data in a source, which can be provided by the source or can be estimated or bounded by the system. Expected freshness is the desired freshness for the data returned by queries, which can be directly set by users or obtained from user profiles. Both actual and expected freshness must be expressed using the same freshness metric. Figure 2 shows the actual freshness of sources (with values 0, 24 and 3 hours for sources S1, S2 and S3 respectively) and user expected freshness (with values 168, 72, 48 and 2 hours for query classes Q1, Q2, Q3 and Q4 respectively). 3.3. Freshness Evaluation In this section we specify how to propagate freshness values within the graph calculating the freshness of the intermediate data produced by each node. We firstly give an intuitive idea of the freshness calculation method and we present a recursive definition. We also enunciate some lemmas that show another way to calculate freshness in terms of the dag paths. Such calculation allows the definition of some strategies to enforce freshness. Intuitively, the freshness of the data produced by a node depends on the freshness of data at the moment of reading it (the freshness of data produced by the predecessor node plus the synchronization delay) and the time the node needs for executing (the processing cost). To calculate the freshness of a node we add such values. When the node reads data from several input nodes, input freshness values should be combined. As we are interested in an upper bound of freshness we take the worst case (the maximum). We recursively define the freshness of a node as follows:
Definition 6. The freshness of an activity or target node in a calculation dag G is the maximum sum of the freshness of a predecessor node, plus the synchronization delay between nodes, plus the processing cost of the node. The freshness of a source node is its actual freshness. − For a source node A: Freshness(A) = ActualFreshness(A)
− For an activity or target node A: Freshness(A)= max {Freshness(B) + delay(B,A,G) /B ∈ predecessor(A,G) } + cost(A,G)
The ActualFreshness, cost and delay functions return the respective properties. The predecessor function returns the predecessors of a node in a dag. Example 3. Figure 3 shows the Freshness property, calculated using the previous definition. For example, for A6 both inputs are compared, 57 (32+24+1) and 6 (5+0+1) respectively, taking the maximum.
Figure 3 – Calculating freshness (Some properties have been omitted for readability)
Intuitively, if we consider a sequence of activities that execute one after the other (a path in the calculation dag), the freshness of data after executing the last activity is the sum of the freshness at the time data was read by the first activity (initial freshness), plus the cost of the path, i.e. the time needed for executing all the activities in the path (execution cost) plus the delays between the activities in the path (synchronization delay). We define the path cost as follows: Definition 7. Given a path [A0,A1,… Ap] in the calculation dag G from a source node A0, we define the path cost as the sum of the execution costs (of nodes A1 to Ap) plus the synchronization delays between all the nodes: PathCost([A0,… Ap]) = Σx=1..p (cost(Ax,G)) + Σx=1..p (delay(Ax-1,Ax,G)) Observe that for each node, there is a path for which we add all synchronization delays and processing costs to the source actual freshness and we obtain the freshness of the node. In the
previous example, the freshness of A7 can be calculated adding the freshness of source S2 (24), plus the delays (2,0,24,8) and the costs (3,3,1,2) in the path [S2, A2, A5, A6, A7]. Then, the freshness of a node can be calculated as the cost of the most expensive path from a source plus the source actual freshness. The following lemmas specify it: Lemma 1. For any node Ap, there exists a path [A0,A1,… Ap] from a source node A0 that verifies: Freshness(Ap) = Freshness(A0) + PathCost([A0,A1,… Ap])
Lemma 2. For any activity node Ap, freshness is given by the cost of the most expensive path: Freshness(Ap) = max {Freshness(A0) + PathCost([A0,A1,… Ap]) / [A0,A1,… Ap] is a path from a source node}
Lemma 1 states that there exists a path in the dag that determines the freshness of each node, and Lemma 2 states that this path is the most expensive one, i.e. the critical path (taking as costs the processing costs and execution delays). Demonstrations can be found in [15]. The existence of a critical path allows the use of a large spectrum of algorithms for optimizing a workflow of activities. Next section discusses their use when user requirements are not achieved. 3.4. Enforcing Freshness The system should provide at the query level the data freshness expected by the users. To know if user freshness expectations can be achieved by the system, we can propagate freshness values (as defined in Definition 6) and compare them with those expected for queries. If the propagated freshness values are lower than user expected values then freshness can be guaranteed. If the propagated freshness values are greater than user expected values, we have to improve the system design to enforce freshness or negotiate with source data providers or users to relax constraints. When freshness cannot be assured for a user query, there exists at least one path from a source where propagated freshness is higher than expected freshness. There are several alternatives to enforce freshness in a path: − Negotiating with users to relax freshness expectations. It should be followed when user’s expectations are too high for the data that can be effectively obtained from sources. − Negotiating with source data providers to relax source constraints. Sometimes the system hardware can be powered to support more frequent accesses to the sources. Other times, this alternative implies demanding and eventually paying for a better service, for example, receiving data with a lower actual freshness. − Improving the design of the activities of the path in order to reduce their execution cost. This implies the design of the system to reduce the execution cost of the activities. Sometimes the changes can be concentrated in the critical path that slows the system. Other times a complete reengineering of the whole system is necessary, either changing the algorithms that implement the activities, the synchronization policies, the decisions of which data to materialize or even the hardware. − Synchronizing the activities of the path in order to reduce the delay between them. This implies finding the most appropriate execution frequencies for some activities respecting possible source access constraints. The main difficulty resides in the synchronization of activities having several inputs, sometimes with different execution policies and refresh frequencies.
Example 4. In the example of Figure 3, data for solving Q1 has a freshness of 71 hours which satisfy user expectations of 168 hours. This means that the system can be relaxed and activities in the paths from sources to Q1 can be executed less frequently. Data for solving Q3 does not meet user expectations (68 versus 48 hours). Analyzing the critical path to Q3 ([S2, A2, A5, A6, A8, Q3]) some activities can be synchronized to reduce the delays and meet freshness expectations (for example executing A6 immediately after A5). The execution cost of some activities can be reduced too (for example replacing wrapper A2 by a more performing one). However, even neglecting the cost of the activities in the paths to Q4, freshness expectations cannot be achieved because the actual freshness of S3 is too high. The solution should be a negotiation with users and/or source providers. 3.5. Experiments Most of the functions of the previously described framework have been implemented in a Data Quality Evaluation tool. The prototype was implemented in Java (JDK 1.4) and manages persistence via XML files [6]. Figures 2 and 3 are taken from the screens of the tool. The tool allows the selection of the quality factors that are most relevant for a given application, the dynamic incorporation of new evaluation algorithms and new properties describing the system metadata. The tool has been used to perform some experiences with data freshness metrics in different scenarios. The first experience was the evaluation of timeliness in a virtual scenario, neglecting processing costs and execution delays, i.e. propagating timeliness as the combination of source actual timeliness, as in [14]. We have also used the tool with materialized scenarios, initially with asynchronous execution policies and progressively generalizing the scenarios to represent hybrid environments. The framework helped us to test the performance and appropriateness of the different evaluation algorithms. In the future, our goal is to confront the results with user quality profiles. 4. Related Work There are a variety of approaches to study the quality of information systems. Some works concentrate on the definition of quality properties, other propose general frameworks to deal with quality features during the system design and others treat the achievement or balance of specific quality factors. Some works study data quality from a user point of view. In [20], Wang and Strong develop a framework that captures the data quality attributes that are important to data consumers based in two surveys. They present a classification of quality attributes in some dimensions identifying patterns of quality problems. In [1], Ballow et al. model an information system as a manufacturing system and present a set of concepts and procedures to determine the quality of information products and to analyze the potential improvements to the information system. They present some relevant quality attributes such as timeliness, accuracy and cost. In [10], Jarke et al. study quality factors in DW design. They group quality factors in categories and dimensions and study the relationship between them. They present a formal model for representing quality goal formulation and quality measurement. In [18], Shin also studies success factors in data warehouse design. In this line, Maninno and Walter study the impact of data warehouse refreshment policies in the quality of the DW [12]. Considering the design of an information system taking into account data quality, there are some general proposals. In [14], Naumann and Leser introduce quality factors to drive the design of virtual mediation systems. They study how to propagate a set of quality factors from several heterogeneous sources to the mediator. The propagation consists basically of merge
functions that combine source actual values of two sources through a relational operator (maximum, minimum, sum, product…). The propagated values for different quality factors are aggregated in a weighted sum. Our work differences from [14] in several points: Firstly, they consider only JSP views in a virtual context. As we also deal with materialization and complex calculation activities (which represent a bigger spectrum of systems) we need to consider and balance other system properties in the propagation of quality values. In addition, they do not consider the notion of user preferences or profile, so the quality factors are only evaluated and compared to other plans. In [13], Marotta and Ruggia present some practical experience with the definition and classification of quality properties in mediation systems. They distinguish between user-viewpoint and system-viewpoint quality properties and propose a methodology to convert from a viewpoint to the other. The conversion is carried out by propagating user quality requirements to the mediator, propagating source actual quality to the mediator and applying conversion formulas. In [19], Theodoratos and Bouzeghoub treat the propagation of data currency values in a DW of materialized views. They consider a DW architecture where source images are refreshed periodically but the propagation of changes to the other views follows input-synchronous policies. The proposed algorithm takes as input the user expected values for data currency, and determines the optimal update frequencies for source images that allow achieving these values. In [8], Gertz et al. discuss different problems related to data quality evaluation and enforcement. In particular, they promise an algebra for combining source actual quality values in order to calculate the quality of the data returned in response to a query. 5. Conclusion This paper presented a framework for data quality evaluation in a DIS context and explained the approach with a concrete quality factor (data freshness). The study of a quality factor implies the analysis of metrics and properties needed for its evaluation. Our framework allows representing such properties and the evaluation algorithms in terms of a labeled calculation dag. This work is a first attempt towards the formalization of the framework. We are currently studying other quality factors (response time, confidence and availability) within the framework in order to validate it. We are also extending the prototype to take into account the new quality factors. As future work, we plan to study the correlations between such factors. We also plan to confront the results with user satisfaction, in order to improve the evaluation algorithms. These results will be re-injected into the framework definition. References 1. Ballow, D.; Wang, R.; Pazer, H.; Tayi, G.: “Modelling Information Manufacturing Systems to Determine Information Product Quality”. Management Science, Vol. 44 (4), April 1998. 2. Bouzeghoub, M.; Fabret, F.; Matulovic-Broqué, M.: “Modeling Data Warehouse Refreshment Process as a Workflow Application”. In Proc. of the Int. Workshop on Design and Management of Data Warehouses (DMDW’99), Germany, 1999. 3. Bouzeghoub, M.; Peralta, V.: “A Framework for Analysis of Data Freshness” To appear in Int. Workshop on Information Quality in Information Systems (IQIS’2004), France, 2004. 4. Bright, L.; Raschid, L.: "Using Latency-Recency Profiles for Data Delivery on the Web". In Proc. of the 28th Int. Conf. on Very Large Databases (VLDB'02), China, 2002.
5. Cho, J.; Garcia-Molina, H.: "Synchronizing a database to improve freshness". In Proc. of the 2000 ACM Int. Conf. on Management of Data (SIGMOD'00), USA, 2000. 6. Fajardo, F.; Crispino, I.; Peralta, V.: “DWD: Una Herramienta para Evaluar la Calidad de los Datos en un Sistema de Integración”. Technical Report, InCo. Universidad de la República, Uruguay, 2004. 7. Gal, A.: "Obsolescent materialized views in query processing of enterprise information systems". In Proc. of the 1999 ACM Int. Conf. on Information and Knowledge Management (CIKM'99), USA, 1999. 8. Gertz, M.; Tamer Ozsu, M.; Saake, G.; Sattler, K.: “Report on the Dagstuhl Seminar: Data Quality on the Web”. SIGMOD Record Vol. 33(1), March 2004. 9. Inmon, W.: “Building the Data Warehouse”. John Wiley & Sons, Inc. 1996. 10. Jarke, M.; Jeusfeld, M.; Quix, C.; Vassiliadis, P.: “Architecture and Quality in Data Warehouses: An Extended Repository Approach”. Info Systems, Vol. 24(3): 229-253, 1999. 11. Labrinidis, A.; Roussopoulos, N.: “Balancing Performance and Data Freshness in Web Database Servers”. In Proc. of the 29th Int. Conf. on Very Large Data Bases (VLDB’03), Germany, 2003. 12. Mannino, M.; Walter, Z.: “A Framework for Data Warehouse Refresh Policies”. Technical report CSIS-2004-001, University of Colorado at Denver, 2004. 13. Marotta, A.; Ruggia, R.: “Quality Management in Multi-Source Information Systems”. 2nd Workshop on Databases of the Chilean Computer Week (JCC'2003), Chile, 2003. 14. Naumann, F.; Leser, U.: "Quality-driven Integration of Heterogeneous Information Systems". In Proc. of the 25th Int. Conf. on Very Large Databases (VLDB'99), Scotland, 1999. 15. Peralta, V.; Bouzeghoub, M.: “Evaluating Data Freshness in Data Integration Systems”. Technical report, Université de Versailles, France, 2004. 16. Segev, A.; Weiping, F.: “Currency-Based Updates to Distributed Materialized Views”. In Proc. of the 6th Int. Conf. on Data Engineering (ICDE’90), USA, 1990. 17. Sheth, A.; Larson, J.: “Federated Database Systems for Managing Distributed, Heterogeneous and Autonomous Databases”. ACM Computing Surveys, Vol. 22(3): 186236, September 1990. 18. Shin, B.: “An exploratory Investigation of System Success Factors in Data Warehousing”. Journal of the Association for Information Systems, Vol. 4(2003), 141-170, 2003. 19. Theodoratos, D.; Bouzeghoub, M.: "Data Currency Quality Factors in Data Warehouse Design". In Proc. of the Int. Workshop on Design and Management of Data Warehouses (DMDW'99), Germany, 1999. 20. Wang, R.; Strong, D.: "Beyond accuracy: What data quality means to data consumers". Journal on Management of Information Systems, Vol. 12, 4:5-34, 1996. 21. Wiederhold, G.: “Mediators in the architecture of future information systems”. IEEE Computer, Vol. 25(3):38-49, 1992.