IEEE TRANSACTIONS ON IMAGE PROCESSING, VOL. 20, NO. 3, MARCH 2011
709
A Geometric Method for Optimal Design of Color Filter Arrays Pengwei Hao, Member, IEEE, Yan Li, Zhouchen Lin, Senior Member, IEEE, and Eric Dubois, Fellow, IEEE
Abstract—A color filter array (CFA) used in a digital camera is a mosaic of spectrally selective filters, which allows only one color component to be sensed at each pixel. The missing two components of each pixel have to be estimated by methods known as demosaicking. The demosaicking algorithm and the CFA design are crucial for the quality of the output images. In this paper, we present a CFA design methodology in the frequency domain. The frequency structure, which is shown to be just the symbolic DFT of the CFA pattern (one period of the CFA), is introduced to represent images sampled with any rectangular CFAs in the frequency domain. Based on the frequency structure, the CFA design involves the solution of a constrained optimization problem that aims at minimizing the demosaicking error. To decrease the number of parameters and speed up the parameter searching, the optimization problem is reformulated as the selection of geometric points on the boundary of a convex polygon or the surface of a convex polyhedron. Using our methodology, several new CFA patterns are found, which outperform the currently commercialized and published ones. Experiments demonstrate the effectiveness of our CFA design methodology and the superiority of our new CFA patterns. Index Terms—Color filter array (CFA), discrete fourier transform (DFT), sampling, multiplexing, demosaicking.
I. INTRODUCTION ODAY, digital cameras have become widespread in daily life. In theory, to capture a color image each pixel should have at least three sensors, in order to simultaneously sense at least three color components, e.g., red, green and blue (R, G and B), or cyan, magenta and yellow (C, M and Y). However, to reduce the cost, size and complexity, a consumer digital camera usually uses a single-chip sensor covered with a Color Filter
T
Manuscript received June 18, 2009; revised December 31, 2009, July 29, 2010; accepted September 02, 2010.Date of publication September 20, 2010; date of current version February 18, 2011. This work was supported in part by the Council of the National Natural Science Foundation of China under Grant 61071156, in part by the State Key Lab of CAD&CG of Zhejiang University under Grant A1002, and in part by the Natural Sciences and Engineering Research Council of Canada (NSERC). The Associate Editor coordinating the review of this manuscript and approving it for publication was Prof. Minh N. Do. P. Hao is with the Department of Computer Science, Queen Mary, University of London, London E1 4NS, U.K., and with the Center for Information Science, Peking University, Beijing 100871, China (e-mail:
[email protected]). Y. Li was with the Center for Information Science, Peking University, Beijing 100871, China. He is now with the Pattern Recognition Laboratory, Delft University of Technology, 2628 CD Delft, The Netherlands (e-mail: yan.li@tudelft. nl). Z. Lin is with Microsoft Research Asia, Beijing 100190, China (e-mail:
[email protected]). E. Dubois is with the School of Information Technology and Engineering, University of Ottawa, Ottawa, ON K1N 6N5, Canada (e-mail:
[email protected]). Color versions of one or more of the figures in this paper are available online at http://ieeexplore.ieee.org. Digital Object Identifier 10.1109/TIP.2010.2077642
Array (CFA) [1], [28]. A CFA is a mosaic of spectrally selective filters, which is of the same size as the sensed image and allows only one color component to be sensed at each pixel. Therefore, the sensed image, i.e., the CFA filtered image, has only one color value at each pixel. To recover the original full color image, the missing two color components of each pixel have to be estimated by methods called demosaicking. Numerous algorithms have been proposed in the literature [12], [21], [25], [26]. Besides better demosaicking algorithms, an alternative way to improve the quality of demosaicked images is to optimize the configurations of CFAs. Since a CFA is usually a periodic tiling of a much smaller array, which is called the CFA pattern in this paper, the problem reduces to finding optimal CFA patterns. Many CFA patterns have been proposed [22], among which some have been used in commercial products [3], [27] and the most commonly used one is the Bayer pattern [3]. The Bayer pattern was designed based on two facts of the human visual system (HVS): relatively greater ability to discern the luminance detail, and the closeness of green frequency to the peak of the human luminance spectral response (Fig. 1(a)) [3], [11]. Thus, the sampling rates for green, red and blue (G, R and B) are 1/2, 1/4 and 1/4, respectively. Based on the Bayer pattern, some other patterns have been proposed for some other considerations. For example, to overcome the problem of fast saturation of green pixels by introducing a luminance channel (W) (Fig. 1(b)) [31], to preserve spatial resolution while using the luminance channel (Fig. 1(c)) [9], to deal with low light conditions by using subtractive colors (Fig. 1(d)) [13], to be close to the natural sight perception of the human eye by introducing a light blue color emerald (E) (Fig. 1(e)) [27], and to increase the overall sensitivity of the sensor by featuring one ‘panchromatic pixel’ (luminance) adjacent to every colored pixel (Figs. 1(f)–(g)) [17]. Some pseudo-random (or random) CFAs were also proposed in [33] (Fig. 1(h)) to eliminate the aliased spectrum and were recommended by Fillfactory [22] for being more immune to color Moiré artifacts (Fig. 1(i)). The Fillfactory also proposed the well-known diagonal stripe CFA (Fig. 1(j)). Fig. 1(k) was proposed in [22]. More systematic CFA design methods have also been proposed. In [23] (Fig. 1(l)), CFA was obtained with quantitative analysis to minimize the discrepancy between the reconstructed and the original images when viewed through the HVS. In [24], the same authors considered selecting spectral sensitivity functions (visible spectrum sampled every 10 nm in 400–700 nm) to minimize the reconstruction error under different illuminants in space. In [2] CFA filtering was analyzed in the the CIE Fourier domain to be represented with luminance and chrominance, and the authors proposed to exchange color green with red or blue in Bayer CFA for less aliasing between luminance
1057-7149/$26.00 © 2011 IEEE
710
IEEE TRANSACTIONS ON IMAGE PROCESSING, VOL. 20, NO. 3, MARCH 2011
Fig. 1. Some published CFA patterns, i.e., a period of the corresponding CFAs. (a) Bayer [3], (b) Yamagami et al. [31], (c) Gindele & Gallagher [9], (d) Hamilton et al. [13], (e) Sony [27], (f)–(g) Kodak [17], (h) Zhu et al. [33], (i)–(j) Fillfactory [22], (k) Lukac & Plataniotis [22], (l) Parmar & Reeves [23], (m) Hirakawa & Wolfe [15], (n) Condat [5]. The colors used in (h), (i) and (l) are R, G, B and those in (m)–(n) are non-trivial mixture of primary colors. The patterns (h), (i) and (l) are rescaled smaller to fit the space. Their pixels are of the same size as those in other CFA patterns.
and chrominance. Based on the spatio-spectral sampling properties of the corresponding lattices of CFA patterns, a CFA design method in the Fourier domain was proposed in [15] (an extended version of [16]). The CFA filtered image was represented by the sum of a luminance at the baseband and some modulated difference signals, and CFA design was turned into a problem of parameter selection in the Fourier domain in order to best separate the modulated signals from the baseband spectrum. Several new CFA patterns were proposed in the paper, and Fig. 1(m) is the one that performed the best in their experiments. Based on the paradigm in [15], several new CFA patterns were proposed in [5], [4] which especially focused on maximizing the energy of chrominance signal when given a luminance signal. The one which performed the best in the experiments is shown in Fig. 1(n). Based on the work in [15], the author also proposed a random CFA pattern in [6]. In this paper, we propose another CFA design methodology. The work presented here summarizes and extends our previous work in [18]–[20]. Although both our methodology and that in [16], [15] are based on analysis in the frequency domain, these two frameworks differ drastically in the forms of representation of CFA filtered images and therefore the formulations and solutions of the CFA design problem: 1) Representation: The basic components in [16], [15] are a and green channel and two difference channels ( ), while ours are three primary channels (e.g., R, G and B, or C, M and Y); in our paper a simple relationship (symbolic DFT) between a CFA pattern and a concise frequency-domain representation is derived, which makes it convenient to transform forward and backward, and to express all the entities (such as constraints and the objective function) in either frequency or spatial domain with the same parameters. It can also be used for CFA analysis intuitively and visually, and can be extended to other peri-
odical CFA representations if a geometric transform matrix is considered. 2) Problem Formulation: In [16], [15], a CFA is designed by directly specifying the parameters of components in the frequency domain, to satisfy some constraints and give the CFA pattern some desirable characteristics, whereas in our framework, we first set some components of undesirable characteristics in the frequency domain to zero, and then find the non-zero components by formulating it as a constrained optimization problem. 3) Problem Solving: A geometric method is proposed to solve our optimization problem, i.e., to find a triangle for optimization, which is intuitive and visual. This paper is organized as follows. The following three sections deal with ‘Representation’, ‘Problem Formulation’ and ‘Problem Solving’, respectively. In Section II, the frequency structure of a CFA (pattern) is defined to represent a CFA filtered image in the frequency domain. It is also shown that the frequency structure is just the symbolic DFT of the CFA pattern. In Section III, we show how to formulate the CFA design as a constrained optimization problem. In Section IV, the optimization problem is solved by reformulating it as a geometric point selection on the boundary of a convex polygon or the surface of a convex polyhedron. Section V gives a simple design example in detail, and also proposes two new CFA patterns. Experimental results and comparisons between the Bayer CFA, the Sony CFA, the diagonal stripe CFA, the first of the four CFAs proposed in [15] which had the best performance in their paper, the CFA proposed in [5] and our newly proposed ones are presented in Section VI. Finally, we conclude our paper in Section VII. II. FREQUENCY STRUCTURE AS A REPRESENTATION OF CFA FILTERED IMAGES The problem of representing CFA filtered images in the frequency domain was first addressed in [2], [7], which considered
HAO et al.: GEOMETRIC METHOD FOR OPTIMAL DESIGN OF COLOR FILTER ARRAYS
mainly the Bayer CFA. In [8], [15], [16], general representations were proposed, mainly based on the theory of sampling on lattices. In this section, we also derive a general representation for any rectangular CFA. CFA filtered images are represented by a matrix called the frequency structure, which shows all the luminance/chrominance components at their corresponding frequencies. The frequency structure can be easily obtained by computing the symbolic DFT of the CFA pattern. Compared with the representations in [8], [15], [16], ours is distinct in that it is concise, easy to compute and intuitive for analysis. What is more, with it the CFA design can be easily formulated as an optimization problem (Section IV). For more details, please refer to our technical report [19]. A. Frequency Structure Let be the full color image of size and be of size . Based on the the CFA pattern and well established tri-primary color theory, both can be decomposed into three components and , each corresponding to one primary color (e.g., , or ). For example, the Bayer CFA pattern (Fig. 1(a)) can be represented by a matrix (1) which can be decomposed into matrices of primary colors:
Accordingly, the color image and image can be represented as:
for , respectively). Equation (3) imis plies that in the frequency domain the spectrum a multiplexing of frequency components centered at , and each component is the sum of the original spectra weighted by , the value of the spectrum of the CFA pattern at the corresponding frequency. Thus, the components are called the multiplex components in this paper. matrix If we define an (4)
and treat ‘ ’ as a representation of ‘ ’, then records : the all the information of the multiplex components of -th entry represents the multiplex compo. Therefore, we call the manent modulated at trix the frequency structure of the CFA (pattern). And in the sequel, we also use ‘ ’ to represent the spectrum of the color channel of the original image. If we further define symbolic DFT as regular DFT which treats symbols as parameters [19], is just the symbolic DFT of the then it can be proven that [19] CFA pattern (5) Thus the frequency structure of any periodic CFAs can be easily computed. To ensure the same dynamic range of the sensed image at each pixel, the sum of all primary CFA patterns should be an all-one . By applying DFT to it, we matrix: have that
is decomposed into . Then the CFA filtered (2)
where is the corresponding CFA of color defined as the periodic replica of the primary CFA pattern . Note that in this equation, and are different types of quantities. represents tristimulus values of a color signal, whereas represents an attenuation coefficient between 0 and 1. can be With straightforward deduction, the DFT of found to be [19]
711
(6) which means that the sums of the coefficients for all multiplex components are zero, except the one ), which is 1. As in [2] and at the baseband (frequency [7], we shall call the multiplex component at the baseband the luminance component (luma) and the others the chrominance components (chromas). B. Examples of Frequency Structures The frequency structure of a CFA not only records all the multiplex components, but also shows their arrangements in the frequency domain (the position in the matrix shows the can be easily modulated frequency). And thanks to (5), computed. For example, the frequency structure of the Bayer CFA [cf. (1)) and Fig. 1(a)] is
(3) (7) where , and has been circularly shifted. Note that here discrete values in the square region of size of for and
takes (at a step, and
It shows that the spectrum of any image sampled with the Bayer at the baseband, and three CFA has a luma chromas and centered (or modulated) at frequencies (1/2, 0), (0, 1/2) and (1/2,
712
IEEE TRANSACTIONS ON IMAGE PROCESSING, VOL. 20, NO. 3, MARCH 2011
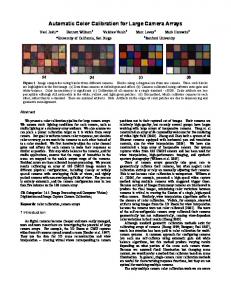
Fig. 2. Spectrum of the ‘window’ image filtered with the Bayer CFA [3]. Multiplex components are displayed in different colors: luma (R + 2G + B )=4 in black and three chromas (R B )=4; (R B )=4 and (R 2G + B )=4 in green, blue and red, respectively. The ‘window’ is a commonly used test image from the Kodak dataset [12].
0 0
0
0 0
1/2), respectively. To illustrate, Fig. 2 shows the spectrum of the ‘window’ image filtered with it. Note that due to the Fourier transform, the coefficients of chromas may be complex. For more examples, please refer to [19]. III. CFA DESIGN AS AN OPTIMIZATION PROBLEM Frequency structure offers a simple universal frequency domain demosaicking algorithm for all rectangular CFAs. Aiming at minimizing the demosaicking error, some desired characteristics of an optimal CFA can be obtained, which are the principles that guide our CFA design. With the help of frequency structure, we can easily follow the design principles and turn the CFA design into an optimization problem. A. Associated Demosaicking and CFA Design Principles Given the frequency structure of a CFA, demosaicking can be easily achieved by: 1) obtaining all multiplexed components, 2) transforming them back to the primary color channels (e.g., R, G and B), and 3) applying the inverse DFT to the spectra of the primary color components to recover the original image. This method is named the associated demosaicking algorithm in [8]. (7) shows that a luma Take the Bayer CFA for example, , and two chromas and (denoted by and , respectively), can be obtained by bandpass filtering. The components of primary colors can be recovered from the multiplex components with a linear transform (8) where the 3 3 transform matrix is called the demosaicking ma. Applying the inverse DFT to the spectra trix, denoted by of the primary color components R, G and B leads to the three channels of the reconstructed image. A good CFA should minimize the demosaicking error. The above analysis shows that for the associated demosaicking method to perform well, the CFA should enable the following procedures to work well: 1) to estimate the multiplex components accurately;
2) to estimate the primary color components from the multiplex components accurately. To achieve the first goal, we have two principles for CFA design. (P1) The crosstalk among the multiplex components should be as small as possible. (P2) The correlation among some multiplex components should be as high as possible. With the first principle (P1), bandpass filtering will result in little aliasing from other multiplex components. The same principle was used in [15], [16] for the CFA design. And by the second principle (P2), if there is high correlation among some multiplex components, we can fuse them adaptively to obtain a more accurate and robust estimate of those multiplex components. For example, for the Bayer CFA (7), a great performance margin was achieved by exploiting the correlation between two chromas and [7]. If a chroma has more than one replica multiplexed into a spectrum, they can be at least averaged to reduce the filtering error, and an adaptive method can give even more accurate estimates of the chroma. To achieve the second goal, we have to control the error in the estimated multiplex components such that the error will not be amplified. Note that there is a linear relationship between the multiplex components and the primary color components (e.g., (8) for the Bayer CFA) (9)
So if the estimated multiplex components have error and respectively and we denote the the error of the primary color components as and , then from matrix analysis [10] we have , where ‘t’ denotes the matrix transpose. depends on the demosaicking method applied to the CFA pattern, but should be minimized in CFA design in order to minimize the error of primary colors. Hence, we have the third principle for optimal CFA design: should be (P3) The norm of the demosaicking matrix minimized. Our CFA design methodology is based on the above three principles. It consists of two steps: choosing an appropriate form of a CFA, and determining opof the frequency structure . The details of these two steps are timal parameters of described in the following two subsections, respectively. B. Choosing a Frequency Structure To choose an appropriate frequency structure of the CFA means to specify the positions of nonzero multiplex components and to designate the relationship (e.g., equal, negative, or conjugate) among the chromas. (P1) and (P2) should be followed when making this choice. There should be some constraints on the frequency structure. must satisfy all the propAs the DFT of CFA pattern erties of DFT, including the ‘conjugate symmetry’. Besides,
HAO et al.: GEOMETRIC METHOD FOR OPTIMAL DESIGN OF COLOR FILTER ARRAYS
713
Fig. 3. Illustration of the spectra of images sampled with CFAs with corresponding frequency structures shown in Table I.
TABLE I SOME EXAMPLES OF FREQUENCY STRUCTURES OF SIZE (A) 2
(6) shows that the luma must exist. So the frequency point (0, ) must be nonzero. Furthermore, to recon0) (i.e., struct three primary color components of an image, we need at least three independent multiplex components. Since the luma is already selected, two independent chromas must be selected. and are independent Here, that two chromas means that there does not exist a scalar (real or complex) such . that Now we are equipped to choose an appropriate frequency structure. Some guidelines can be obtained following principles (P1) and (P2). As illustrated in [15], [16], to apply (P1), we may choose as few nonzero chromas as possible and maximize the distance among the nonzero multiplex components. And we may further wish that the distance between luma and chromas should be large enough (e.g., no less than 0.5), and the chromas should not be centered on the horizontal or vertical axes of the luma. We can only wish for the latter two guidelines because they may not always be satisfied if the size of the CFA pattern is . For example, too small, considering the constraints on the for CFA patterns of size 3 3, the distance between luma and chromas is no larger than ; and for CFA patterns of size 2 2, at least one chroma should be on the horizontal or vertical axes of the luma. To apply (P2), we may choose redundant nonzero chromas and make them dependent. With redundant chromas, we can estimate each chroma more robustly by crosschecking with its redundant replicas. In our current system, for simplicity we only require that a chroma is equal to another replicated one, rather than specifying a scalar between them. Note that ‘choosing redundant nonzero chromas’ is in conflict with ‘choosing as few nonzero chromas as possible’, and we have to make a tradeoff between these two guidelines.
2 2, (B) 4 2 4, (C) 6 2 6, (D) 4 2 2, (E) 6 2 2
One should be reminded that our guidelines do not result in a unique frequency structure. We cannot foresee which frequency structure is optimal if we make a tradeoff among the guidelines. So we have to test the obtained CFA patterns with differently specified frequency structures using benchmark images to find the best one. Nonetheless, using our guidelines one can easily rule out a vast majority of bad frequency structures: one only has to test a limited number of designs, which are possibly the optimal ones. This already saves a lot of effort in the CFA design. We show some examples of frequency structures of various sizes of CFA patterns in Fig. 3, whose corresponding frequency structure matrices are shown in Table I. More examples can be found in [20]. By convention we put the baseband at the center, but all the DFT spectra are periodic in both horizontal and vertical directions. Thus, in our frequency structure representation of CFAs, we take the frequency origin (0, 0) as at the top-left corner of the matrix. C. Optimization Formulation for CFA Design Once the form of the frequency structure is chosen to follow principles (P1) and (P2), the parameters of (e.g., and in Table I), and thus the optimal CFA those of can be determined by applying (P3). pattern Note that due to physical laws and the condition that the sensed image should have the same dynamic range, all three primary CFA patterns must be real and nonnegative, and their sum must be an all-one matrix. The can be guaranteed to be is chosen to satisfy ‘conjugate symmetry’, which real, if we have imposed when choosing in Subsection III.B. The nonnegativity of three leads to inequality conis an all-one matrix would imstraints. That the sum of
714
IEEE TRANSACTIONS ON IMAGE PROCESSING, VOL. 20, NO. 3, MARCH 2011
pose another equality constraints. However, (thanks to the property (5)) if we consider this “all-one matrix” constraint via , equivalent constraints are the DFT of the CFA pattern found to be (6). When has three independent multiplex components (a luma and two chromas, as in Table I), there are at most 5 such equality constraints (remember that the parameters of luma are real numbers, and those of chromas may be complex ones). Hence, the equality constraints are greatly simplified. beNow, by applying (P3), the search for the optimal comes the following constrained optimization problem:
D
Fig. 4. Illustration of the entries in the k k (14) and (15).
where for
(10)
where is the demosaicking matrix and the norm can be any matrix norm. Note that it is very tedious to write down all the inequality constraints manually as they involve the inverse sym, particularly when or is large. But this bolic DFT of can be done on the computer via symbolic computing. IV. GEOMETRIC METHOD FOR OPTIMIZATION The optimization problem (10) has many parameters (e.g., 15 for 3 multiplex components) and is the inverse of a parameterized matrix. To decrease the number of parameters for solution searching and simplify the expression of , we rewrite the parameters of multiplex components and explicitly present the corresponding demosaicking matrix. Then the optimization problem can be reformulated as a geometric point selection on the boundary of a convex polygon or the surface of a convex polyhedron. A. Optimization Reformulated as Triangle Finding We may parameterize the three multiplex components as and matrix form, it is
(suppose
). In , where and ‘t’ denotes the matrix transpose. The matrix relating the multiplex components to the primary color components is called the multiplexing matrix in this paper, and by the definition of the demosaicking matrix ((9), transforming from multiplex components to the . components of primary colors) we have Note that and should be positive real numbers, and the other parameters in may be complex ones. Thus, has 15 free parameters, which makes the constrained optimization may have a problem (10) a bit difficult. Besides, complex expression. To overcome these problems, we rewrite as follows:
(11)
, and . With this form, we can give geometric explanations for the constraints in (10) and express explicitly with a much simpler form, and reformulate the constrained optimization problem (10) as a geometric points selection. is Actually the demosaicking matrix (12)
This can be verified by trivial but tedious calculation. One may first check that , where is the -th entry of . Then one may find that the right-hand side is the is the identity matrix, by observing that solution to (13) The above linear system is obtained from the 5 equality constraints in (10), or (6), which are equivalent to , i.e., (13). (13) means that the weighted barycenter is at the origin, and the origin should be a point inside the triangle. of (10). Owing Now we consider the objective function to the equivalence of matrix norms ( [10], where ), we may focus on the Frobenius norm (F-norm)
(14) and are real Consider the last term of (14). When both , numbers, the denominator is actually i.e., the squared area of the parallelogram with and the origin being three of its vertices. And the numerator and . Thus, is the squared distance between , where is the distance the last entry of (14) equals from the origin to the line connecting and . To and defined illustrate, Fig. 4 shows this analysis. With , (14) becomes similarly to (15)
HAO et al.: GEOMETRIC METHOD FOR OPTIMAL DESIGN OF COLOR FILTER ARRAYS
Therefore, to minimize in 2D, we have to minimize the sum of the reciprocals of the squared distances from the origin . to the sides of the triangle with vertices Now let us look into the inequality constraints in (10). inequalities ensures that the primary CFA Every group of pattern of one color should be a nonnegative matrix, and this group of inequalities is only related with one pair of paramethat correspond to that color. Thus, we may choose ters from the feasible region resulting from the correevery inequality constraints. However, considering the sponding permutation symmetry among the three colors, the feasible regions of the three colors are the same. Therefore, we may repre, choose three points sent this identical feasible region with . The 6 difin it, and then designate them to ferent designations correspond to the 6 permutations of three primary colors. The advantage of this method is to reduce 2/3 to . Beof the total parameters from sides, since the primary CFA pattern is obtained by applying the inverse DFT to its frequency structure and both the DFT and the inverse DFT are linear transforms, all the inequality constraints are linear. Therefore, the feasible region has a piecewise linear boundary and is convex. In summary, to solve the constrained optimization problem (10), we may obtain the feasible region first and then choose three points from it. The chosen three points should form a triangle that contains the origin as its inner point and further minimizes (15). Then the multiplexing matrix and the demosaicking matrix can be found via (12), which leads to the . Finally, by applying the inverse DFT frequency structure , the optimized CFA pattern can be obtained. to
715
Fig. 5. CFA feasible regions of the frequency structure as (a) Table I(c), (b) Table I(a) (the 2 2 CFA pattern design example in Section V).
2
B. An Example To illustrate, we consider a special case of the frequency structure as Table I(c). It has two pairs of different chromas, and to simplify, we may further assume that the coefficients of the chromas are real. That is, are real , and the quadruple is , or simply in 2-D inequality space. The feasible region resulting from the constraints in (10) is shown in Fig. 5(a). There are two triangles, and , corresponding to vertices or and , which contains the origin as an inner point and minimizes the criterion (15). Differing only by a sign, these two triangles lead to the same , and thus we may consider only the first one. Designating and to and respectively, the multiplexing matrix can be found via (12)
Fig. 6. Flowchart of CFA pattern design.
V. A DESIGN EXAMPLE AND NEW CFA PATTERNS In the following, we give a detailed example to design a 2 2 CFA pattern by using the proposed methodology. Then we also present several new CFA patterns designed using our method. Thus
and , and the corresponding frequency structure (Table I(c)) is obtained. Applying the inverse DFT to the frequency structure leads to an optimal CFA pattern.
A. CFA Pattern Design of Size 2
2
Our example follows the steps in Fig. 6.
716
Step 1: We choose the frequency structure of the 2 pattern to be [Table I(a)]
IEEE TRANSACTIONS ON IMAGE PROCESSING, VOL. 20, NO. 3, MARCH 2011
2 CFA
(16) where we specify the chroma at (0, 0.5) to be zero. Note that and are both self-conjugate, so their coefficients must all be real. As analyzed before, the multiplexing matrix can be rewritten as (11), with all elements and being real numbers. The colors corresponding to the columns of matrix are ‘ ’, ‘ ’ and ‘ ’, respectively. Step 2: As there are no redundant chromas, there is no relaand . tionship to prescribe between Step 3: By applying the inverse symbolic DFT to the freof primary color , the primary CFA quency structure patterns are found to be
Fig. 7. Designed CFA pattern of size 2 G, B], (b) [G, B, R] and (c) [R, B, G].
2 2 whose primary colors are (a) [R,
calculated and then the multiplexing matrix , which leads to the frequency structure
(21) By applying inverse symbolic DFT to , the CFA pattern can be obtained
(17) Step 4: The equality constraints are (18) which are for making the sum of primary CFA patterns an all-one matrix. Note that now we only have 3 equality constraints because the zero sum constraints on the imaginary are automatically fulfilled. The parts of the parameters in inequality constraints are
(19)
which are for making the entries of the primary CFA patterns (17) nonnegative. Step 5: If we choose the Frobenius norm as the norm of , then the optimization problem (10) is (20) Step 6: According to the geometric method in Section IV, we first find the feasible region imposed by the inequality constraints (19). As the feasible regions for three primary colors are the same, we may represent the region with two parameters without specifying the subscript ‘ ’. Since and are real, the feasible region is a 2-D convex polygon, as shown in Fig. 5(b). The four vertices are ( , 0), (0, 1), (1, 0) and (0, ). Step 7: As analyzed in Section IV, to minimize the Frobenius norm of the demosaicking matrix , we may find the triangle in the feasible region which contains the origin and minimizes (15). We find one with vertices at (0, ), ( , 0) and (1/2, 1/2). Step 8: Without loss of generality, we may designate (0, ), , respectively, as the ( , 0) and (1/2, 1/2) to associated with are not specified yet. Subcolors stituting into (12), the demosaicking can be easily
(22) Step 9: Designating three primary colors to ‘ ’, ‘ ’ and ‘ ’, we can have 6 optimal CFA patterns in total. Suppose the primary colors are R, G and B. Three designed CFA patterns corresponds to are shown in Figs. 7(a)–(c), where and , respectively. B. New Patterns: CFA4a and CFA4b Using our design methodology, we have found two 4 4 CFA patterns, whose frequency structures are shown in Table I(b). The chromas of the two CFA patterns have real coefficients and , and the CFAs are different only in color designation, that is, one can be obtained from the other by permuting and , primary colors. The multiplexing matrices, are respectively and
(23)
The new CFA patterns and the spectra of the image ‘window’ filtered with them are shown in Fig. 8. More new CFA patterns can be found in [20]. VI. EXPERIMENTS Now we test our new CFA patterns with the 24 widely-used Kodak color images [7], [12] and compare them with the Bayer pattern [3] [Fig. 1(a)], the Sony CFA [27] [Fig. 1(e)], the diagonal stripe CFA [22] [Fig. 1(j)], the CFA pattern A proposed by Hirakawa and Wolfe [15] [Fig. 1(m)] and the pattern proposed by Condat in [5] [Fig. 1(n)]. Four patterns, A, B, C and D, were proposed by Hirakawa and Wolfe in [15], and the pattern compared in this paper is pattern A, which had the best performance in their experiments. It was denoted as ‘HWpA’. The characteristics of these tested CFAs are summarized in Table II. Based on the analysis and three principles in Section III.A, we list for each CFA: “the minimum distance between luma and chroma” and “the minimum distance between
HAO et al.: GEOMETRIC METHOD FOR OPTIMAL DESIGN OF COLOR FILTER ARRAYS
717
TABLE II SUMMARY OF THE CHARACTERISTICS OF THE TESTED CFAS: THE BAYER CFA [3], THE SONY CFA [27], THE DIAGONAL STRIPE CFA [22], THE HWPA CFA [15], THE CONDAT CFA [5] AND TWO OF OUR NEWLY DESIGNED CFAS
Fig. 8. Proposed CFA patterns (a) CFA4a, (b) CFA4b, and the spectra of image ‘window’ filtered with them.
chromas”, which according to principle (P1) should preferably be larger to have less crosstalk; “the number of replicated chromas”, which according to principle (P2) is preferably larger for more accurate estimates; and 2-norm and Frobenius norm of the demosaicking matrix , which according to principle (P3) is preferably smaller for less error amplification. From the Table II, we can see that CFA4a and CFA4b, as well as HWpA and Condat CFA, increase the distance between the luma and chromas, compared with Bayer, Sony and diagonal stripe CFA. This is based on the observation that luma has much higher energy than chromas and more energy distributed along the vertical/horizontal axes in the frequency domain, and thus chromas should be far from the luma and moved off the axes. For the number of replicated chromas, Bayer and HWpA have two and our new CFAs have four, aiming for more accurate estimates. The norms show the minimization objectives that have been achieved for the corresponding CFA patterns. Actually, the norms can be smaller if the replicated chromas are all considered for the formulation. To interpret the norm of the demosaicking matrix , some care should be taken. The norm of cannot be directly compared since it increases with the size of pattern and the number of chroma.
As described above, we apply the associated demosaicking method (Section III) [8] to the images sampled by the CFA patterns to be tested. For Bayer, HWpA, CFA4a and CFA4b, there may be identical or dependent chromas modulated at different frequency points. There are many methods to combine these replicas for more accurate estimation of the chromas. One method is to naïvely average these replicas.1 The other method is the locally adaptive weighting method proposed in [7], which gives larger weights to the replicas with less aliasing. The latter method respects the fact that these replicas suffer different amount of aliasing. We shall call these two methods the naïve and the Adaptive method, respectively. For diagonal stripe CFA and Condat CFA, there are only two chromas, which can only be estimated by direct bandpass filtering. So we denote their associated demosaicking algorithm as Diag-Direct and Condat-Direct, respectively. For the Sony CFA, we use pseudo-inverse to reconstruct three primary channels from four different multiplex components, and the algorithm is denoted as Sony-Direct. Table III gives the CPSNRs (color peak SNR, in dB) of the 24 (average images and the average CPSNR (computed as MSE)). Clearly, the results with our new CFAs are much better than those with the Bayer CFA, the Sony CFA and the diagonal stripe CFA. Our new CFAs achieve the highest average CPSNR. Among the Bayer CFA based algorithms, Bayer-Adapt gives the best results. Though the adaptive technique used in BayerAdapt greatly improves the performance with the Bayer CFA, our simple and non-adaptive CFA4a-naïve and CFA4b-naïve algorithms still outperform Bayer-Adapt on average and on most of the 24 images. This demonstrates that using our new patterns, CFA4a and CFA4b, the demosaicking quality can be improved a lot. The pattern HWpA also gives very good results, although it is a bit worse than the best (CFA4b) of our new CFA patterns, in terms of average CPSNR. The Condat CFA performs better than Bayer CFA, but has lower average CPSNR than HWpA and our patterns. For the Bayer CFA, CFA4a and CFA4b, the Adaptive method outperforms the naïve method greatly, especially for the Bayer CFA (1.31 dB gain on average), which is not the case for HWpA (0.03 dB gain on average). We conjecture that the reason may lie in the combination characteristics of the Adaptive method. In general, the more difference several estimates have, the more 1If two chromas, S (p; q ) and S (r; s), are dependent, which means that there exists a scalar c such that S (p; q ) = c 1 S (r; s), then we can average S (p; q )=c and S (r; s) for a better estimation of S (r; s).
718
IEEE TRANSACTIONS ON IMAGE PROCESSING, VOL. 20, NO. 3, MARCH 2011
TABLE III CPSNR OF DEMOSAICKING ALGORITHMS BASED ON THE BAYER CFA [3], THE SONY CFA [27], THE DIAGONAL STRIPE CFA [22], THE HWPA CFA [15], THE CONDAT CFA [5] AND TWO OF OUR NEWLY DESIGNED CFAS. THE AVERAGE CPSNR IS CALCULATED AS 10 log (AVERAGE MSE)
gain we can obtain by combining these estimates. For the Bayer CFA, its two chromas ( and ) for combination lie on the horizontal and vertical axes. So their aliasing suffered from the luma is quite different. This results in the great gain of the Adaptive method over the naïve one. Therefore, the gain of the Adaptive method is closely related to the frequency structure of a CFA. The above evaluation with CPSNR shows that our CFAs are better than state-of-the-art CFAs in terms of signal level recovery. We further compare the visual quality of CFAs by using two exemplary images. The first image (Fig. 9(o)) has much energy along the horizontal/vertical axes in the frequency domain, while the second one (Fig. 10(o)) has much energy off the horizontal/vertical axes. So these two images are typical and representative. We will show that our proposed CFAs outperform the Bayer CFA, and its visual quality is indistinguishable from that of state-of-the-art CFAs.
Fig. 9 shows the fence part of the images demosaicked from the CFA images obtained by sampling the lighthouse image (19th in Table III) with the test CFAs. Because of its structure, this fence part has much energy along the horizontal/vertical axes in the frequency domain. Thus, if there are any chromas on the horizontal/vertical axes, then there is much cross-talk between luma and chromas. This is the case for Bayer and Sony CFAs and as a result, the demosaicked images from these CFAs have obvious artifacts (Figs. 9(a) and (c)). For the Bayer CFA, by exploiting the redundant chroma information, the adaptive method (Fig. 9(b)) can reduce the aliasing, but artifacts are still visible. The other CFAs, the diagonal-stripe, HWpA, Condat, CFA4a and CFA4b, do not suffer from this problem since they do not have chromas on the horizontal/vertical axes. The demosaicked images Figs. 9(d)–(k) also show that all of them have good visual quality, and are better than the Bayer and Sony CFAs.
HAO et al.: GEOMETRIC METHOD FOR OPTIMAL DESIGN OF COLOR FILTER ARRAYS
719
Fig. 9. Blowups of the demosaicked Image 19 of the Kodak Dataset [12]. (o) original image. (a) Bayer-naïve. (b) Bayer-Adapt. (c) Sony-Direct. (d) Diag-Direct. (e) HWpA-naïve. (f) HWpA-Adapt. (g) Condat-Direct. (h) CFA4a-naïve. (i) CFA4a-Adapt. (j) CFA4b-naïve. (k) CFA4b-Adapt. The visual quality of the demosaicked images using our CFAs ((h)–(k)) is indistinguishable from that of (d)–(g).
Fig. 10 provides the demosaicked images sampled by the test CFAs, on the window part of image 08 in Table III. As the presence of wires in the image corresponds to high energy in the area off the horizontal and vertical axes in the frequency space, severe aliasing may result from our new CFAs. However, by exploiting the correlations [7] among the nonzero chromas (e.g., 4 for CFA4a, 4 replicas of for replicas of CFA4b, which contain different amount of aliasing), our new CFAs still perform well in terms of both CPSNR (Table III) and subjective quality. One can see that the visual quality of our proposed patterns CFA4a-Adapt and CFA4b-Adapt (Figs. 10(i) and (k)) is indistinguishable from that of HWpA-Adapt and BayerAdapt. Besides, the resulting images also show the great improvement with the adaptive method for redundant chromas, by comparing Figs. 10(a) and (b) (Bayer CFA), (e) and (f) (HWpA CFA), (h) and (i) (CFA4a), and (j) and (k) (CFA4b). This shows the effectiveness of the adaptive method [7], and it also implies that we should better include some redundant or highly correlated chromas when designing a CFA. Actually this is the main reason why we propose the design principle (P2) (Section III.A).
For the Bayer, Sony, diagonal stripe, HWpA and Condat CFAs, we have also tested their alternative CFAs obtained by permuting the colors R, G and B, and compared them with our CFAs in terms of average CPSNR. For the Bayer CFA, if we exchange R and G, the average CPSNR is the highest (38.76 dB) for demosaicking with the Adaptive method. For the Sony CFA, the average CPSNR is the highest when R and G is exchanged (37.46 dB). For the diagonal stripe CFA, permutations of colors have little influence on the performance. (Note the equivalence of R, G and B.) For HWpA, its alternatives do not produce better results. For Condat CFA, permuting colors results in similar CPSNR. Thus, it can be concluded that our proposed CFA4b outperforms all other tested CFAs and their alternatives by permuting colors. VII. CONCLUSIONS, DISCUSSIONS AND FUTURE WORK Based on the frequency structure, which is a frequency-domain representation of CFAs, a CFA design methodology is proposed in this paper. It aims at minimizing the demosaicking error by better arranging multiplex components in the frequency
720
IEEE TRANSACTIONS ON IMAGE PROCESSING, VOL. 20, NO. 3, MARCH 2011
Fig. 10. Blowups of the demosaicked Image 08 of the Kodak Dataset [12]. (o) original image. (a) Bayer-naïve. (b) Bayer-Adapt. (c) Sony-Direct. (d) Diag-Direct. (e) HWpA-naïve. (f) HWpA-Adapt. (g) Condat-Direct. (h) CFA4a-naïve. (i) CFA4a-Adapt. (j) CFA4b-naïve. (k) CFA4b-Adapt.
structure and finding the optimal demosaicking matrix. After reformulation, the optimization problem is solved by a geometric method. Our experiments show that using our new CFA patterns, the simple associated demosaicking algorithm can achieve excellent demosaicking quality. With principle (P3) (Section III.A), our CFA design aims at CFAs whose demosaicked images have the least mean square errors (MSE) in the RGB color space. However, MSE is not really a good visual metric for images [30] and the optimal CFA should aim at images with the highest visual quality. One possible solution is to transform the image form RGB space to perceptually uniform spaces such as CIELAB and its spatial extension S-CIELAB [32] and optimize the CFA coefficients for minimum error in that space. Besides, we can also benefit from the research on image quality assessment [29], which provides quantitative measure of perceived image quality. The demosaicking method was not investigated extensively in this paper. However, it is one of the key factors influencing image quality and should be investigated more in the future. On the one hand, a good demosaicking algorithm leads to better performance. Although the adaptive method [7] performs very well
in the experiments, we still believe more gain can be obtained for our new patterns CFA4a and CFA4b. That is because we have four replicated chromas and it is highly possible that even more accurate chromas can be estimated from the four chromas. On the other hand, different demosaicking algorithms may work better for CFAs with different characteristics. Thus, it would also be beneficial to design an optimal CFA for a specific demosaicking algorithm. One possible way is to analyze the features of the demosaicking method first, and incorporating the features as constraints (e.g., more or less replicated chromas) into the CFA design. By using lattice transform and reciprocal lattices, we can apply the proposed methodology to design CFAs over other periodical lattices, such as quincunx and hexagonal lattices, but the corresponding optimization principles still need further investigation. This will be our research in the future. ACKNOWLEDGMENT The authors would like to thank the Associate Editor and three reviewers for their constructive comments and suggestions, which make the paper more complete and clearer, and
HAO et al.: GEOMETRIC METHOD FOR OPTIMAL DESIGN OF COLOR FILTER ARRAYS
K. Hirakawa for kindly providing a preprint of his paper [15] even before it was accepted for publication.
REFERENCES [1] J. Adams, K. Parulski, and K. Spaulding, “Color processing in digital cameras,” IEEE Micro, vol. 18, no. 6, pp. 20–31, 1998. [2] D. Alleysson, S. Susstrunk, and J. Herault, “Linear demosaicing inspired by the human visual system,” IEEE Trans. Image Process., vol. 14, no. 4, pp. 439–449, Apr. 2005. [3] B. E. Bayer, “Color Imaging Array,” U.S. Patent 3 971 065, 1976. [4] L. Condat, “A new class of color filter arrays with optimal sensing properties,” Research Report HAL-00347433, Dec. 2008. [5] L. Condat, “A new color filter array with optimal sensing properties,” in Proc. IEEE Int. Conf. Image Process., Nov. 2009, pp. 457–460. [6] L. Condat, “A new random color filter array with good spectral properties,” in Proc. IEEE Int. Conf. Image Process., Nov. 2009, pp. 1613–1616. [7] E. Dubois, “Frequency-domain methods for demosaicking of Bayersampled color images,” IEEE Signal Process. Lett., vol. 12, no. 12, pp. 847–850, Dec. 2005. [8] E. Dubois, “Color-filter-array sampling of color images: Frequencydomain analysis and associated demosaicking algorithms,” in SingleSensor Imaging: Methods and Applications for Digital Cameras, R. Lukac, Ed. Boca Raton, FL: CRC Press, 2009, ch. 7, pp. 183–212. [9] E. B. Gindele and A. C. Gallagher, “Sparsely Sampled Image Sensing Device With Color and Luminance Photosites,” U.S. Patent 6 476 865 B1, 2002. [10] G. H. Golub and C. F. Van Loan, Matrix Computations, 3rd ed. Baltimore, MD: Johns Hopkins Univ., 1996. [11] B. K. Gunturk, Y. Altunbasak, and R. M. Mersereau, “Color plane interpolation using alternating projections,” IEEE Trans. Image Process., vol. 11, no. 9, pp. 997–1013, Sep. 2002. [12] B. K. Gunturk, J. Glotzbach, Y. Altunbask, R. W. Schafer, and R. M. Mersereau, “Demosaicing: Color filter array interpolation,” IEEE Signal Process. Mag., vol. 22, no. 1, pp. 44–54, 2005. [13] J. F. Hamilton, J. E. Adams, and D. M. Orlicki, “Particular Pattern of Pixels for a Color Filter Array Which Is Used to Derive Luminanance and Chrominance Values,” U.S. Patent 6 330 029 B1, Dec. 17, 2001. [14] K. Hirakawa and T. W. Parks, “Adaptive homogeneity-directed demosaicing algorithm,” IEEE Trans. Image Process., vol. 14, no. 3, pp. 360–369, Mar. 2005. [15] K. Hirakawa and P. J. Wolfe, “Spatio-spectral color filter array design for optimal image recovery,” IEEE Trans. Image Process., vol. 17, no. 10, pp. 1876–1890, Oct. 2008. [16] K. Hirakawa and P. J. Wolfe, “Spatio-spectral color filter array design for enhanced image fidelity,” in Proc. IEEE Int. Conf. Image Process., Sep. 2007, pp. 81–84. [17] T. Kijima, H. Nakamura, J. Compton, and J. Hamilton, “Image Sensor with Improved Light Sensitivity,” U.S. Patent 20070268533, Nov. 22, 2007. [18] Y. Li, “Color filter arrays: Representation, analysis and design,” M.Sc. Thesis, Center for Information Science, Peking University, Beijing, China, Jun. 2007, (In Chinese with English abstract.). [19] Y. Li, P. Hao, and Z. Lin, “Color filter arrays: Representation and analysis,” Dept. of Science, Queen Mary, Univ. London (QMUL), London, U.K., Tech. Report no. RR-08-04, 2008 [Online]. Available: http:// www.dcs.qmul.ac.uk/tech_reports/RR-08-04.pdf [20] Y. Li, P. Hao, and Z. Lin, “Color filter arrays: A design methodology,” Dept. Computer Science, Queen Mary, Univ. London (QMUL), London, U.K., Tech. report no. RR-08-03, 2008 [Online]. Available: http://www.dcs.qmul.ac.uk/tech_reports/RR-08-03.pdf [21] P. Longere, X. Zhang, P. B. Delahunt, and D. H. Brainard, “Perceptual assessment of demosaicing algorithm performance,” Proc. IEEE, vol. 90, no. 1, pp. 123–132, Jan. 2002. [22] R. Lukac and K. N. Plataniotis, “Color filter arrays: Design and performance analysis,” IEEE Trans. Consum. Electron., vol. 51, no. 4, pp. 1260–1267, Apr. 2005. [23] M. Parmar and S. J. Reeves, “A perceptually based design methodology for color filter arrays,” in Proc. Int. Conf. Acoustics, Speech, Signal Proc., 2004, pp. 473–476. [24] M. Parmar and S. J. Reeves, “Selection of optimal spectral sensitivity functions for color filter arrays,” in Proc. IEEE Int. Conf. Image Processing, 2006, pp. 1005–1008.
721
[25] R. Ramanath, W. E. Snyder, G. L. Bilbro, and W. A. Sander, III, “Demosaicking methods for Bayer color arrays,” J. Electron. Imaging, vol. 11, no. 3, pp. 306–315, Jul. 2002. [26] T. Sakamoto, C. Nakanishi, and T. Hase, “Software pixel interpolation for digital still cameras suitable for a 32-bit MCU,” IEEE Trans. Consum. Electron., vol. 44, no. 4, pp. 1342–1352, Nov. 1998. [27] Sony Press Release, 2003 [Online]. Available: http://www.sony.net/ SonyInfo/News/Press/200307/03-029E/ [28] M. Vrhel, E. Saber, and H. J. Trussell, “Color image generation and display technologies,” IEEE Signal Process. Mag., vol. 22, no. 1, pp. 23–33, Jan. 2005. [29] Z. Wang and A. C. Bovik, Modern Image Quality Assessment. New York: Morgan & Claypool Publishers, 2006. [30] Z. Wang and A. C. Bovik, “Mean squared error: Love it or leave it?—A new look at signal fidelity measures,” IEEE Signal Process. Mag., vol. 26, no. 1, pp. 98–117, Jan. 2009. [31] T. Yamagami, T. Sasaki, and A. Suga, “Image Signal Processing Apparatus Having a Color Filter With Offset Luminance Filter Elements,” U.S. Patent 5 323 233, Jun. 21, 1994. [32] X. Zhang and B. A. Wandell, “A spatial extension of CIELAB for digital color image reproduction,” in Proc. Soc. Inform. Display Symp. Tech. Dig., 1996, vol. 27, pp. 731–734. [33] W. Zhu, K. Parker, and M. A. Kriss, “Color filter arrays based on mutually exclusive blue noise patterns,” J. Vis. Commun. Image Represent., vol. 10, pp. 245–247, 1999.
Pengwei Hao (M’98) received the B.Sc. degree in computer science and the M.Sc. degree in computer graphics from Northwestern Polytechnical University, Xi’An, China, in 1988 and 1994, respectively. He received the Ph.D. degree in image processing from the Institute of Remote Sensing Applications, Chinese Academy of Sciences, Beijing, China, in 1997. From 1997 to 1999 he was a Lecturer and was promoted to an Associate Professor in 1999 with the Center for Information Science, Peking University, Beijing, China. Since 2002, he has been a Lecturer at Queen Mary, University of London, U.K. He was a Visiting Scientist with the Centre for Vision, Speech, and Signal Processing, University of Surrey, U.K., in 2000, a Visiting Researcher with the School of Information Technology and Engineering (SITE), University of Ottawa, Canada, in 2008 and a Courtesy Associate Professor with the Department of Electrical & Computer Engineering, University of Florida, in 2009. His research interests include data and image compression, data hiding, signal sampling and reconstruction, and integer transforms.
Yan Li received the B.S. degree from Nanchang University, Nanchang, China, in 2004 and the M.Sc. degree from Peking University, Beijing, China, in 2007, both in electrical engineering. He is currently working toward the Ph.D. degree in the Pattern Recognition Laboratory at Delft University of Technology, The Netherlands. His research interests include pattern representation and classification, learning theory, and image analysis.
Zhouchen Lin (M’00–SM’08) received the Ph.D. degree in applied mathematics from Peking University, China, in 2000. He is a Lead Researcher at Visual Computing Group, Microsoft Research Asia, Beijing, China. He is also now a Guest Professor to Beijing Jiaotong University, Southeast University and Shanghai Jiaotong University. He is also a Guest Researcher to Institute of Computing Technology, Chinese Academy of Sciences. His research interests include machine learning, computer vision, numerical computation, image processing, computer graphics, and pattern recognition.
722
Eric Dubois (S’72–M’77–SM’85–F’96) received the B.Eng. (hons) degree with great distinction and the M.Eng. degree from McGill University, Montreal, QC, Canada, in 1972 and 1974, and the Ph.D. from the University of Toronto, Toronto, ON, Canada, in 1978, all in electrical engineering. He joined the Institut National de la Recherche Scientifique (University of Quebec), QC, Canada, in 1977, where he held the position of Professor in the INRS-Telecommunications centre in Montreal, Canada. Since July 1998, he is Professor with the School of Information Technology and Engineering (SITE) at the University of Ottawa, Ottawa, ON, Canada. He was Vice-Dean (Research) and Secretary of the Faculty of Engineering from 2001 to 2004. From January 2006 to December 2008 he was Director of SITE. His research has centered on the compression and processing of still and moving images, and in multidimensional digital signal processing theory. His current research is focused on stereoscopic and multiview imaging, image sampling theory, image- based virtual environments and color signal processing. The research has been carried out in collaboration with such organizations as the Communications Research Centre, the National Research Council, the RCMP, and the Learning Objects Repositories Network (LORNET). Dr. Dubois is a Fellow of the Canadian Academy of Engineering and of the Engineering Institute of Canada. He is a registered professional engineer in Quebec as member of the Order of Engineers of Quebec. He is a member of the Society for Information Display (SID) and the Society for Imaging Science and Technology (IS&T). He is corecipient of the 1988 Journal Award from Society of Motion Picture and Television Engineers. He is a member of the editorial board of the EURASIP journal Signal Processing: Image Communication and was an associate editor of the IEEE Transactions on Image Processing (1994–1998). He was technical program co- chair for the IEEE 2000 International Conference on Image Processing (ICIP) and a member of the organizing committee for the IEEE 2004 International Conference on Acoustics, Speech and Signal Processing (ICASSP).
IEEE TRANSACTIONS ON IMAGE PROCESSING, VOL. 20, NO. 3, MARCH 2011