Jul 29, 2009 - Robinson, Matthew Shields, Ian Taylor, and Ian Wang. Programming. Scientific and Distributed Workflow with Triana Services. Concurrency.
A Grid Portal for Solving Geoscience Problems using Distributed Knowledge Discovery Services
Gianluigi Folino, Agostino Forestiero, Giuseppe Papuzzo and Giandomenico Spezzano Institute of High-Performance Computing and Networking (ICAR) National Research Council (CNR), Italy Via Pietro Bucci 41C, I-87036 Rende (CS), Italy {folino, forestiero, papuzzo, spezzano}@icar.cnr.it
Abstract This paper describes our research effort to employ Grid technologies to enable the development of geoscience applications by integrating workflow technologies with data mining resources and a portal framework in unique work environment ` Using MOSE, ` a user can easily compose and execute geo-workflows called MOSE. for analyzing and managing natural disasters such as landslides, earthquakes, floods, ` is designed to be applicable both for the implementation of wildfires, etc.. MOSE responses strategies when emergencies occur and for disaster prevention. It takes advantage of the standardized resource access and workflow support for loosely coupled software components provided by web/grid services technologies. The integration of workflows with data mining services significantly improves data analysis. Geospatial data management and mining are critical areas of modern-day geosciences research. An important challenge for geospatial information mining is the distributed nature ` provides knowledge discovery services based on the WEKA data of the data. MOSE mining library and novel distributed data mining algorithms for spatial data analysis. A P2P bio-inspired algorithm for distributed spatial clustering as an example of distributed knowledge discovery service for intensive data analysis is presented. A real case application for the analysis of landslide hazard areas in the Campania Region near the Sarno area shows the advantages of using the portal.
Key words: Grid computing, Geoscience applications, grid services, knowledge discovery services, spatial data mining, swarm intelligence
Preprint submitted to Elsevier Science
29 July 2009
1
Introduction
Natural disasters, such as volcanic eruptions, earthquakes, landslides, hurricanes, floods, wildfires, droughts, and tornadoes are complex physical phenomena that may cause extensive damage to property and the economy and pose a significant risk of loss of human life. Grid technologies provide an unifying infrastructure to share capabilities, to integrate services and resources, and to develop active collaborations across distributed, multi-organizational environments. Grids can be considered to be a crucial enabling technology for disaster prevention and the implementation of responses strategies when emergencies do occur. Grids can help the decision making process for natural disasters such as floods, landslides and earthquakes, predicting their spread and progression as accurately as possible. The ability of Grids to address effectively emergency operations is that to combine into a single cooperating system wireless sensor networks, geospatial data, modeling and simulation capabilities, parameter estimation methods, spatial data mining tools and visualization applications. For example, Grids can coordinate computations composed of a tridimensional elevation model combined with simulation of earthquakes, to assist with disaster prevention and mitigation by creating hazard map for evacuation planning. A similar thing can be done for landslides, combining high-resolution elevation data with large-scale computer simulation to create an early warning system for evacuation.
Geospatial information is essential for quick and effective response during disaster and emergency situations. Typically, geospatial data contain a huge amount of geometric or topological information, maps and repositories of remote-sensing images. Data is often inherently distributed into several datasets, making a centralized processing of this data very inefficient. Data mining techniques can be applied to geospatial data to extract knowledge for geoscience applications. For example, the spatial prediction of landslide hazards is one important field of geoscientific research in which classification rules have been successfully applied [7]. The aim of these methods is to identify areas that are susceptible to future landsliding, based on the knowledge of past landslide events and terrain parameters, geological attributes, etc.. and possibly considering anthropogenic environmental conditions associated with the presence or absence of such phenomena. As geospatial data sets are large and the data mining tasks to perform are quite complex, it is important to define novel efficient data mining algorithms that are suitable to discovery meaningful patterns in order to answer scientific questions and facilitate the understanding of phenomenon. Speeding up the execution of data mining tasks, and scaling the algorithms to run for large data sets is one of the most important problems in data mining research. 2
` 1 (Spatio-Temporal MOdelling of EnvironmenThis paper presents the MOSE tal Evolutionary Processes by means of GeoSErvices) system, a Grid-based problem solving environment (PSE) for the developing of geoscience applica` is a PSE able to support the activities that concern the modelling tions. MOSE and simulation and mining of spatio-temporal phenomena for analyzing and managing the identification and the mitigation of natural disasters like floods, ` are characterized wildfires, landslides etc. The activities managed by MOSE by the need to handle large amounts of spatio-temporal data and to support the interoperability among simulation models, distributed GIS, visualization systems, parameter estimation services, discovery of spatio-temporal patterns in pre-existing data, etc. In this domain, the data conversion and the access, search, discovery and organization processes are complex problems because data are geo-referenced, stored in distributed GIS and can be used along three dimensions: temporal, spatial and referred to the physical properties. ` uses a Grid service-based computing portal architecture to coordiMOSE nate the access to the resources. Workflow technology is used to compose the ` are simulation services, geographic services. The main components of MOSE information (GI) services, knowledge discovery services (KDS), visualization ` enables the creation, execuservices, geographic data and repositories. MOSE tion and monitoring of geo-workflows in grid environments through high-level, graphical Web interfaces. Components of the workflows can be sequential, parallel and P2P applications. Each component is wrapped as Web/Grid Service for exploiting the potentialities of this architecture. Each Web service is semantically annotated and, consequently, domain specific ontologies support the user in building complex workflows, even without a deep knowledge of the domain itself. ` provides web based access to the spatial data by a browser and alMOSE lows data to be observed and manipulated in a 2D/3D space by selecting regions in thematic maps. Natural phenomena can be modeled by cellular automata (CA) models and simulated by a parallel Grid service based on the ` provides KDS based on the WEKA CAMELotGrid environment [16]. MOSE (Waikato Environment for Knowledge Analysis) data mining library and novel distributed data mining algorithms for spatial data analysis. Distributed data intensive mining algorithms are necessary to discovery spatial patterns from large geospatial datasets. Novel algorithms must be developed to accomplish this task efficiently. We present an example of innovative KDS based on a bio-inspired P2P agent-based algorithm for clustering distributed intensive geospatial data. The algorithm was implemented using the JXTA platform ` environand then wrapped as a Web Service and integrated in the MOSE ment. 1
http://www.icar.cnr.it/mose
3
` available at the URL http://www.icar.cnr.it/mose, A first prototype of MOSE, was successfully applied for the analysis of landslide hazard areas in the Campania Region near the Sarno area [13]. In this scenario, the main actor is a disaster manager who wants to get an overview of the Sarno area with the indication of the regions which are currently slid down and those which are susceptible to sliding down (landslide hazard areas) within a fixed time. For each scenario, the disaster manager generates a geo-workflow that orchestrates the ` web services necessary to obtain the outcome, and submitted it to the MOSE workflow enactment engine, which takes care of its execution. ` system use Note that some of the components that constitute the MOSE results of previous research developed in the past years and guarantee high performance and accuracy of the results [19]. ` system The paper is organized as follows: section 2 presents the the MOSE and its architecture; section 3 shows an example of the building of a workflow; section 4 gives an overview of the distributed knowledge service approach; section 5 illustrates a distributed knowledge service that enables the mining of geographically dispersed sites by means of a distributed multi-agent spatial clustering algorithm; section 6 show a real application scenario in which the distributed knowledge service and other grid services are combined to carry out an application for the analysis of landslide hazard areas in the Campania Region. Section 7 reviews some related works; finally, conclusions are draw in section 8.
2
` a Grid Portal for geoscience applications MOSE:
` is a framework supporting the development, execution and manageMOSE ment of complex geo-models. It provides a friendly environment that symbiotically combine computations, experiments, observations and geo-spatial data ` can deliver and provide important insights into complex phenomena. MOSE complex grid-based solutions of geoscience problems to users wherever they have access to a web browser running on the Internet without the need to download or install specialized software or worry about setting up networks, firewall, and port policies. The framework provides a very flexible service-oriented programming environment to design and construct large scale and computationally-intensive geoscience applications based on existing web/grid services technologies and standards. Remote services are visible to the users through a Web browser portal that is used to configure, launch and monitoring complex geo-workflows that combine services that communicate one another via well-defined interface ` the geo-workflows are tools for designing and conand protocols. In MOSE 4
ducting computational experiments. Scientists need to be able to run analysis processes on collected data. Often these analysis processes are single computations and often they are complex composed scenarios of preprocessing, analysis, post processing and visualization. Furthermore, these experimental geo-workflows are often repeated hundreds of times with slightly different parameter settings or input data. A critical feature of any e-Science portal is the capability to compose workflows, to add new computational analysis programs to a catalog of workflow components and a simple way to run the workflows with the results auto` provides a Web GUI matically stored in the user’s private data space. MOSE to support easy problem set-up and data input using service classification by domain-dependent ontological annotation. ` Grid portal employs a service-oriented architecture and is built The MOSE on the layer of OGSA (Open Grid Services Architecture) middleware.
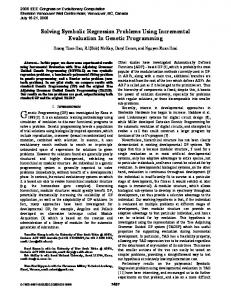
` software architecture. Fig. 1. The MOSE
The architecture, shown in figure 1, includes some components exported as web/grid services, each with an associated repository preserving historical (or previously inserted) information, a workflow executor and Web-based access to a Geographical Information System (GIS). These services are accessed and composed by the users though the Grid Portal that contains an interface to configure, launch and monitor complex service-oriented applications such as geo-workflows for conducting experiments or other scientific investigations. 5
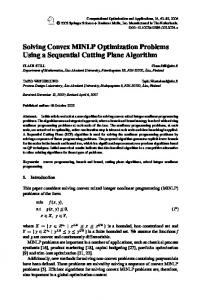
Geo-workflows greatly simplify the process of conducting geophysical analyses ` the experiments are organized as a process that and forecasts. In MOSE, represents the automation of a sequence of interactions with a set of Web Services. New experiments can be based on existing geo-workflows or created from scratch. While the workflow runs, it notifies the user of the status. A Web based interface, shown in figure 2, is used to access the services offered ` by MOSE.
` Web based GUI. Fig. 2. MOSE
The Grid-based portal supplies access to the spatial data by the client browser and allows observing, selecting, and manipulating data in a 2D/3D space selecting regions in thematic maps. Users can examine features and patterns in a map in order to identify the region from which data must be extracted and/or analyzed. A landslide hazard area for the Sarno area is shown in figure 3. The main components exported as web/grid services are: • Data extractor component, to extract raster maps from the GIS. • CAMELotGrid [17], an autonomic cellular automata based simulation tool running on the computational grid in a distributed way. • Estimation of model parameters component, based on a parallel genetic algorithm running on a parallel machine available on the Grid. The CA models simulated with CAMELotGrid are calibrated with the parameters that are estimated by this component. • Visualization component, based on AVS-Express, to implement 2D/3D visualizations and virtual reality representations of one or more layers of the data extracted from the GIS. 6
Fig. 3. Landslide hazard area near Sarno.
• Knowledge discovery services both sequential, performing the main KDD tasks as preparing and filtering data, classification and clustering, i.e. exporting Weka algorithms as web services, and distributed, performing operations of spatial clustering, classification, etc. (better described in the next subsection). CA have been used as a simulation technique in the study of an impressively wide range of spatial models. The integration of CA and GIS has demonstrated considerable potential to design geo-models. Most current GIS techniques have limitations in modeling changes in the landscape overtime. The limitations of GIS include its poor ability to handle dynamic spatial models. CA can serve as an analytical engine to provide flexible framework for the programming and running of dynamic spatial models weather a grid of data (raster) extracted from a GIS is provided as input to the CA. ` geospatial data and geospatial data processing functions are all In MOSE wrapped as GIS Web services. CAMELotGrid is apt to simulate many complex real world geo-hazard CA models such as landslide evolution, lava flows, floods, etc. over heterogenous grid resources. For each phenomenon a CA model must be defined and implemented by the CARPET programming language [18]. CAMELotGrid exploits autonomic functionality to manage intelligently problem partitioning, problem piece deployment, runtime management, dynamic level of parallelism and dynamic load balancing without any user intervention. The system permits the definition of a set of rules to specify high level policies that capture different aspects of autonomic behavior, 7
i.e. to manage the runtime behavior of the system in the form of a event condition-action (ECA) control structure [17]. Using CAMELotGrid as a Web service we can solve large-scale problems and guarantee interoperability among different networked systems and specifically CAMELotGrid-validate models. Furthermore, by the aggregation/composition of two or more simulation Web services we can realize the distributed simulation of coupled models that are characterized as being multi-scale, dynamic and heterogeneous (in time space and state). Different coupled model can be represented as geo-workflows where different simulation services are orchestrated to built a hierarchical simulation model as a network of CA models. New workflows can be designed and performed using apposite tools of the ` can framework to validate ideas and perform experiments. In this way, MOSE be used profitably to execute simulations of different complex natural phenomena. New phenomena can be simulated by the specification of a new CA model and its transfer as input parameter to the CAMELotGrid simulation service. It is very tedious to calculate the parameter values in conventional CA model. So an estimation parameter service can be used to calibrate a CA designed to simulate a geo-model. We use parallel genetic algorithms to find parameters that fit observed data. Genetic algorithms are stochastic search methods that search from a population of points and use simple operators modeled on natural selection to generate subsequent populations and make progress. These simple operators work on string representations and individuals in the genetic algorithm’s population are usually binary strings. Although randomized, genetic search is guided by the relative differences in (application-dependent) fitness of members of the population. Each member of the population represents a possible solution to the problem. Genetic algorithms maximize a fitness function that for our problem is defined from difference between modeled and observed data. Figure 4 depicts how the GA algorithms are used to calibrate the CA model.
` The calibration of the CA model with GAs. Fig. 4. MOSE
8
Handling visualization services is another critical point for the system. In fact, even the output of simple workflows could be hardly understood without an adequate visualization. A lot of excellent visualization tools have been developed, most of them have become popular. Integrating these software as Web service into the system will promote usability and quicken development of the system. In MOSE’ we are able to use visualization services based on the AVS/Express toolkit [1]. In developing Web service versions of the AVS/express, we have wrapped a batch version of the toolkit. The visualization service can be invoked passing a visualization model that will be applied on data to visualize. Moreover, is possible to use Web services to convert AVS-based visualizations into VRML (Virtual Reality Modeling Language) files to display 3D models on the Web. WS-BPEL (Web Service Business Process Execution Logic) [21], approved as an OASIS Standard, was a result of the combined efforts of many companies for supplying a standardized way to compose web services. For this reason, the core part of our system, the Workflow Executor (WE), permits to build workflows using this standard. In practice, the WE receives a workflow, built using the BPEL Designer (an eclipse plugin for designing workflows) or chosen among the available ones in the workflow repository, and executes it on the Grid on the basis of the available resources. Note that a repository is associated with each component to reuse models previously defined or results obtained from the execution of geo-workflows. CAMELotGrid maintains a repository of the models of simulations, the parameter estimation service retains the parameters estimated for different regions for model calibration, the data extractor keeps data in the data repository, the 3D visualization component maintains a repository of 3D visualization models of its simulations and finally, the discovery knowledge components uses a knowledge repository to save acquired knowledge. The representation of data mining algorithms (DMA) as a service is an attempt to build an infrastructure for DMA that allow users to concentrate on what they want to accomplish rather than on how to solve all the technical details in tuning computing systems for executing DMA models. A Web services based infrastructure delivers required data mining activities in a utility-like fashion enabling heterogeneous components to cooperate in a unified manner. ` uses the WEKA library wrapped as Web service to support local and MOSE remote traditional data mining tasks, while adopts a more complex solutions to support distributed data mining algorithms. As an example of this approach we briefly illustrate, in section 5, the P-SPARROW clustering algorithm on a P2P network using a JXTA platform. As more geoscientists adopt the service-oriented paradigm, it is expected that an increasing number of geoscience tools and services will be made accessible as 9
Web services. This would require that similar to data management practices, Web services be also ontologically registered. Annotating web services with semantics would ensure that appropriate tools (in form of Web services) are selected in an efficient and automatic manner for answering geoscience queries.
3
Building a geo-workflow
` by means of BPEL The orchestration of web services is conducted in MOSE Designer, and the resultant geo-workflows are sent to the Workflow Executor for the execution over the grid. To better understand the process of workflow creation and orchestration, a simple but significant example, applicable in case of landslide simulations will be illustrated.
Fig. 5. Workflow building example using Bpel Designer.
A classical problem in model simulation is to verify whether a model calibrated on a region can be applied in other neighborhood regions with similar physical properties. In the real case of landslide simulation, related to the zone 10
of Sarno, we built a CA landslide model [10] and executed the simulation on a region using the CAMELotGrid simulation service. Parameter estimation is performed by the Web service workflow for the calibration based on parallel genetic algorithms. To verify the landslide model is general enough, it is validated on the neighboring regions. In the case of low accuracy of the validation, the model must be recalibrated.
Fig. 6. An XML-Bpel code for workflow deployment.
The workflow of figure 5 illustrates how the validation phase for different ` by means of the BPEL Designer. regions can be executed using MOSE Yellow blocks represent assignation or composition of input parameters and/or variables and blue blocks represent the invocation of a web service. Note that on the bottom right corner of the BPEL Designer you can choose the various ` environment. The components, exported components supplied by the MOSE as web services, can be accessed by means of an UDDI browser, integrated ` Figure 6 into the BPEL designer, listing all the services deployed on MOSE. ` uses for deployment. shows the XML-Bpel code generated that MOSE In the following, more details on the entire process are given in order to give a clearer understanding of the building of the geo-workflow. First, data raster are extracted from a region (called region1) and used by the parameter estimator service workflow to define the parameters for the model calibration in that region. In parallel, data are extracted from another region (called region2). Then, the model simulation is executed using the CAMELotGrid service with the parameters estimated for region1 but on the data of region2. In this way, it is possible to verify whether the parameters extracted from the first region are suitable for the second region. Moreover, still in parallel, data concerning the real landslide shape from region2 are extracted from the GIS. Next, the 11
overlap visualizer service is used to overlap the real and simulate landslide shape. So, graphically, we can confirm (or not confirm) that the parameters are also valid for other regions. Figure 7 shows the output of the workflow with the real landslide delimited by the black line and gray area representing the simulated one.
Fig. 7. Visualisation by means of the Overlap Visualizer of the workflow result.
4
Knowledge Discovery Services
The previous section showed the use of geo-workflows in a portal environment. Now, we will describe how workflows integrated with data mining technologies facilitate a more comprehensive understanding of the nature of a phenomenon. Integrating data mining with workflows requires the development of KDS. The KDS are built adopting the emerging Web Services Resource Framework (WSRF) for accessing remote data mining algorithms and managing distributed computations. WSRF was defined as a standard specification of Grid services for providing interoperability with standard Web services so building a bridge between the Grid and the Web. Traditional algorithms for the main KDD tasks, as preparing and filtering data, classification and clus` Naturally, all tering, taken from the WEKA system, can be used in MOSE. of them are encapsulated in web/grid services. In addition to WEKA-based data mining algorithms, distributed data mining algorithms are necessary to discovery spatial patterns from large geospatial datasets. In fact, in the case of geoscience applications, data are naturally 12
distributed or can be profitably distributed along computing nodes in order to reduce the execution times of data mining and simulation algorithms and ` supplies meet the requirements of real time applications. To this aim, MOSE distributed services of data mining that can be profitably applied when data are placed in different sites on a network, especially in grid environment. These services were developed using JXTA-J2SE libraries, the Java implementation of JXTA protocols [4] that guarantee interoperability, platform independence and ubiquity in P2P networks. Distributed mining algorithms developed using the JXTA platform are wrapped as Web services to implement distributed KDS. JXTA-based algorithms are wrapped behind an XML shell which allows individual functions within the programs to be offered as Web services to any external user. By means of this wrapping technology, a user makes use of the KDS service through a workflow without knowing the exact implementation of the service. In this way, a user’s computing environment can be extended to a knowledge-based distributed computing environment. Therefore, the grid portal takes advantage of the possibility of combining the most innovative distributed knowledge discovery service and traditional data mining algorithms with the other previously described tools for composing complex geo-workflows. Each Web service (classical or distributed) is semantically annotated and, consequently, domain specific ontologies, designated for the Geoscience domain, support the user in building complex workflows, even without a deep knowledge of the domain itself. In fact, the user can choose the most appropriate set of services to use for building the desired workflow or directly querying the UDDI or exploiting the potentialities of these ontologies. Even the resources, i.e. machines, database, etc.., are annotated so that the workflow engine, on the basis of user requirements, can choose the set of resources apt to a determined task. This procedure is hierarchical, in the sense that generated workflows that become new services, can be annotated and enrich the overall domain ontology.
In order to give a more comprehensive explanation of the entire process, in the following section, we will describe a significant example of a distributed data mining service. The service, based on the P-SPARROW algorithm, executes the task of clustering spatial data in a distributed way. It is a P2P version of the SPARROW (SPAtial ClusteRing AlgoRithm thrOugh SWarm Intelligence) algorithm [15] and it is based on a bio-inspired multi-agent paradigm that exhibit a collective intelligent behavior (swarm intelligence [6]) and combines the stochastic search performed by an adaptive flocking with a density-based clustering method. Note that the emergent collective behavior is the outcome of a process of self-organization, in which insects are engaged through their repeated actions and interaction with their evolving environment. Intelligent behavior frequently arises through indirect communication between the agents using the principle of stigmergy [20]. 13
5
A knowledge service for distributed spatial clustering
In this section, the P2P SPARROW algorithm (P-SPARROW) is briefly described, as an example of distributed knowledge service. For more details about the algorithm, the reader can refer to [14]. P-SPARROW combines the stochastic search of an adaptive flocking algorithm with a state-of-art density-based clustering method, the well-known DBSCAN algorithm [12]. DBSCAN is not suitable for finding clusters in very large datasets neither it is appropriate to work in a distributed environment. In fact, DBSCAN starts to create and expand a cluster from a randomly picked point. It works very thoroughly and completely accurately on this cluster until all points in the cluster have been found. Then another point outside the cluster is randomly selected and the procedure is repeated. This method is not suited to stopping early with an approximate identification of clusters. As in DBSCAN, P-SPARROW finds cluster performing region-queries on core points but it introduces a decentralized strategy to perform the search of the core points in parallel. P-SPARROW uses a multi-agent system to perform the distributed search that discovers the points. P-SPARROW is constituted of two phases: a local phase for the discovery of the core points on each peer and a merge phase that concerns a global relaxation process in which nodes exchange cluster labels with nearest neighbors until a fixed point (i.e. all nodes detect no change in the labels) is reached. All the data are partitioned among the peers, proportionally to the computing power and to the cpu-load of the peer itself. Each peer implements the flocking algorithm using a fixed number of agents that initially occupy a randomly generated position in the space. Each agent moves testing the neighborhood of each object (data point) it visits in order to verify if the point can be identified as a core point. A color is assigned to the agents by a function associated to the data analyzed during the exploration, according to the DBSCAN densitybased rules and with the same parameters. In practice, the agent computes the local density (density) in a circular neighborhood (with a radius determined by its limited sight, and then it chooses its color (and its speed) in accordance with the the local density. So red agents reveal a high density of interesting patterns in the data, green, a medium one, yellow, a low one and white agents indicate a total absence of pattern The main idea behind our approach is to take advantage of the colored agent in order to explore more accurately the most interesting regions (signaled by the red agents) and avoid the ones without clusters (signaled by the white agents). Red and white agents stop moving in order to signal these regions to 14
the others, while green and yellow ones fly to find clusters. Green agents will move more slowly than yellow agents in order to explore more carefully zones with a higher density of points. The variable speed introduces an adaptive behavior in the algorithm. In fact, agents adapt their movement and change their behavior (speed) on the basis of their previous experience represented from the red and white agents. The merging phase works as the DBSCAN algorithm, according that core points are exchanged among the peers in which P-SPARROW runs. More details about this phase can be found in [14]. To evaluate the performance an to illustrate the benefit deriving from using P-SPARROW in a distributed environment, we used a spatial dataset, SEQUOIA [25], composed by 62556 names of landmarks (and their coordinates), and extracted from the US Geological Survey’s Geographic Name Information System. In practice, the points in figure 8, represent points of interest
Fig. 8. The Sequoia dataset.
in the sequoia area and the three main clusters, discovered using our algorithm, correspond respectively to the areas of S. Francisco, Sacramento and Los Angeles. The dataset was partitioned using random sampling, respectively on 16, 32 and 80 partitions and data were distributed on different computing nodes of the grid. We run the algorithm using 100 agents working until they explore the 1%, 2%, 5% and 10% of the entire data set, using 16, 32 and 80 nodes. All the experiments were averaged over 30 runs. Our algorithm uses the same parameters as DBSCAN. Therefore, if we visited all the points of the dataset, we would obtain the same results as DBSCAN, as the merge phase is the same. Then, in our experiments we consider as 100% the cluster points found by DBSCAN (note DBSCAN visit all the points). We want to verify how we come close to this percentage visiting only a portion of the entire dataset and that must be effective for different number of peers involved in the computation. Note that the dominant operation in the computation is the execution of the range queries, performed each time a point is visited, while the time of the other op15
Fig. 9. Average percentage of points found for Sequoia dataset (perc. in comparison to the total number of points for cluster) when P-SPARROW analyzes 1%, 2%, 5% and 10% of total points, using 16, 32 and 80 peers.
erations is negligible. So, the fact of reducing the percentage of visited points considerably reduces the execution time. In figure 9, we show the experimental results concerning the accuracy and scalability of the algorithm by varying the number of peers for Sequoia dataset. For instance, on 80 peers, visiting only the 5% of points, on average, we obtain an accuracy of about 80% and visiting the 10% of data we reach 93% of accuracy. Furthermore, the scalability (i.e. the effect on the accuracy of increasing the number of peers and so reducing the number of data points for peer) is quite good. In fact, for the 5% case, we obtained a reduction from 88% for 16 peers to 81% for 80 peers while for the 10% case, we have a small reduction from 99% to 94%. Visiting only 1% of the dataset we have low percentage of points found; however they are sufficient to have an approximate idea of the shape of the clusters.
6
Real case scenario
One of the difficulties that civil protection authorities have to deal with in order to confront emergency conditions such as a landslide, is the management of the information coming up from the area in which the landslide takes place. The difficulty becomes greater owing to the fact that after an landslide the demand for urgent intervention is huge. Emergency response actions must be taken immediately by civil protection authorities and a framework plan for the planning and the execution of post landslide operations is essential. One of the most critical actions that must be taken after a landslide is the discovery of post landslide damaged buildings. Usually, data concerning the location of the buildings, their main characteristics and damage to different parts of the structure are collected, and can be compared to landslide map and historical ` can help a member of the civil protection to discover damage locations. MOSE 16
the above cited areas, named hot spots, which represent the regions of greatly damaged buildings.
Fig. 10. Grid Environment for the execution of the workflow.
Consider a scenario in which spatial data concerning the location of damaged buildings are sent by detectors and stored in different nodes. A decision-maker ` to recognize the highest density areas of the civil protection could use MOSE with damaged building in order to prevent access to the area’s inhabitants. The distributed nature of our knowledge discovery services make them suitable to operate directly on the computing resources in which data are stored; furthermore, the incremental nature of P-SPARROW permits to give an immediate, even if not completely accurate, answer to the necessity of discovering ` and mainly the P-SPARROW service, was apthe dangerous areas. MOSE, plied on data concerning the landslide hazard areas in the Campania Region near the Sarno area. The MOSE’ environment is installed on the CNR Grid 2 (mainly using the machines of the ICAR-CNR institute). The main components of the system are illustrated in figure 10. A storage server is used for maintaining the GIS data and for storing the repositories. The distributed knowledge discovery services (comprising P-SPARROW) runs on three clusters placed in Palermo, Rende and Naples. The main web server also hosts the Workflow Executor Engine. The visualization server is executed on another parallel cluster. The 3D data processed are compressed by the main visualization server in Rende and can be visualized by any 3D visualization Server on the Grid, i.e the machine in Genoa. The Camelot Grid simulator is generally executed on another cluster 2
http://cnrgrid.na.icar.cnr.it/
17
in Naples, but it can also exploit the potentialities of the other two clusters in Rende, when necessary. In the our scenario, data collected by the sensors are distributed over the three clusters dedicated to the knowledge discovery web services. The workflow executor invokes and runs the P-SPARROW algorithm on these machines and, as soon as the clusters are discovered, the results are collected by the Visualization Engine and sent to the clients for the final visualization. In this way, experts can visualize the potentially dangerous zones and take the necessary emergency actions. Note that preliminary results are collected and visualized constantly, with an increased precision about the dangerous zones, as time passes. The result of the execution of the entire process is shown in figure 11, ob` to the clusters obtained by Ptained using the overlap visualizer of MOSE SPARROW. In the circles, you can observe the three clusters representing the areas of damaged buildings, obtained from a complete execution of the workflow.
Fig. 11. Visualisation of the workflow result.
Obviously, the information must be obtained as quickly as possible. P-SPARROW, permits to find approximate clusters even if we do not explore all the points of the data sets. So the user can receive initial information about the interesting areas and can immediately act, afterwards, can ask for a more precise information, as P-SPARROW go on finding new points of clusters. Each node, in which the algorithms runs, acts independently of each other and intermediate results may be overturned as new data arrives. Therefore, the failure of a single node does not compromise the final result. In fact, as you can see from figure 11, using fewer peers slows down the process but almost the same result is obtained, with the rare exception of a peer maintaining unique information. In the latter, it is more convenient to use redundancy, replicating these data on two or more peers. The storage server uses mirroring techniques to avoid 18
failure or errors in the disk, while the visualization server employs other nodes in case a single nodes fails. A main issue could be the failure of the Workflow Executor that prejudices the correct execution of the entire system, suffering of the typical problematic of the centralized systems. Techniques for distributing this part are in progress and have not been implemented in this version of MOSE’.
7
Related Works
In the literature, there is a number of papers concerning distributed knowledge services on the grid [8][23][22] and a few works correlated to the use of grid technologies and workflows for coping with Geo-science applications [11]. However, to the best of our knowledge, no work merging the potentialities of the two fields is presented. Weka4WS [26] belongs to the first typology and is a framework supporting local and remote data mining tasks on grid environments. It supports the new technical specifications of WSRF and uses a GUI for composing distributed data mining applications. A performance evaluation conducted on LAN and WAN environments demonstrates the efficiency of the approach. Its application to geo-science problems would require integration with GIS, but it does not supply a dedicated portal and does not provide advanced visualization services. One of the best-known workflow-based graphical problem solving is Triana [9][28][27], permitting Grid jobs and Web services to be run. Similarly to MOSE, Triana supplies peer-to-peer services (also comprising bindings for web services) and a visual interface permits a user to run complex grid workflows. These services can be accessed by means of a Grid Application Prototype Interface (GAP) API. It also supports the use of BPEL4WS, but it suffers the same limitations as WekaWS for the application to Geo-Science application. The CYCLOPS project [2](CYber-Infrastructure for CiviL protection Operative ProcedureS) aims to join two important communities, the Global Monitoring for Environment and Security (GMES) and EGEE (Enabling Grids for E-Science in Europe). GMES was founded by the EU Commission in 2001 with the purpose of enabling decision makers to better anticipate or mitigate crisis situations and management issues related to the environment and security, while EGEE project provides a powerful GRID platform to implement services for specific application communities. In practice, CYCLOPS is a framework for developing real time applications for Civil Protection using high-performance computing and distributed environment for running simulations. The authors indicate forest fire propagation, landslide monitoring and 19
earthquake damage assessment as possible applications.
The GEO Grid project [3] integrates data, computing services and archives of earth observation satellite for building an infrastructure to support the task of Global Earth Observation. The system permits one to cope with global problems such as environment conservation, natural disaster prevention and resource exploration. GEO Grid joins standard technologies such as OGSA (Open Grid Serivices Architecture), web service interface, and GSI (Grid Security Infrastructure) for secure interoperation with other organizations. The framework was applied to an important geo-hazard application, the building of an emergency volcanic hazard map based on the possible coverage maps of pyroclastic flow deposits caused by a volcanic dome collapse. In spite of the utility of CYCLOPS and GEO Grid for coping with hazard problems, as MOSE, however both the two framework do not provide high level tools for building workflows and monitoring the simulation and/or visualization services and this limits their usability for scientists not experts in grid and computer science technologies.
OWS-4 (OGC Web Services) [5] enables the design of complex geoscience applications by means of BPEL [WS-BPEL] workflow based on the Open Geospatial Consortium (OGC) services. The OGC is an international, nonprofit making, voluntary organization that develops standards for geospatial and location based services. However, it does not provide any database mechanism, in particular for Web databases, which is fundamental owing to the large scale of Internet.
LEAD (Linked Environments for Atmospheric Discovery) [24] helps the user to detect, analyze and predict atmospheric phenomena by means of a dynamic workflow orchestration and data management system. It is based upon SOA (service oriented architecture) and on a web services framework. It permits workflows to be composed using analysis tools, forecast models, and data repositories to run on adaptive, on-demand, grid-enabled systems and it is able automatically to change configuration when necessary. The system was tested on the LEAD Grid, i.e. is a set of dedicated distributed computing systems located on six different locations in the USA. Differently from the other reviewed systems, LEAD integrates data mining tools and services and support execution on Grids, as MOSE’. Nevertheless, the system cannot fully exploit the potentialities of mixed (parallel and grid) architectures, as it does not provide any distributed service. 20
8
Conclusions
` system that is capable of managing GeoproThis paper presents the MOSE cessing applications on a Grid exploiting the potentialities of distributed KD services and of high performance CA simulation. The primary advantages of ` are the performance gain obtained using web/grid distributed resources MOSE and the support for the interoperability of data and resources. Furthermore, the P-SPARROW service is able to perform approximate clustering on distributed resources using a multi-agent based paradigm. Its incremental nature is particularly suitable for coping with emergency conditions. Future works will concern the automatic building of workflows and tackling many aspects of the distributed nature of the grid as checkpoint, fault tolerance strategies, etc..
References [1] Advanced visual systems, online document, http://www.avs.com/. [2] The cyclops project. http://www.cyclops-project.eu/. [3] The geo grid project. http://www.geogrid.org/. [4] The jxta project. http://www.jxta.org. [5] Ows-4 (ogc web services). http://www.ogcnetwork.net/node/233. [6] Eric Bonabeau, Marco Dorigo, and Guy Theraulaz. Swarm intelligence: From natural to artificial systems. J. Artificial Societies and Social Simulation, 4(1), 2001. [7] A. Brenning. Spatial prediction models for landslide hazards: review, comparison and evaluation. Natural Hazards and Earth System Sciences, 5(6):853–862, 2005. [8] Mario Cannataro, Domenico Talia, and Paolo Trunfio. Distributed data mining on the grid. Future Gener. Comput. Syst., 18(8):1101–1112, 2002. [9] David Churches, Gabor Gombas, Andrew Harrison, Jason Maassen, Craig Robinson, Matthew Shields, Ian Taylor, and Ian Wang. Programming Scientific and Distributed Workflow with Triana Services. Concurrency and Computation: Practice and Experience (Special Issue: Workflow in Grid Systems), 18(10):1021–1037, 2006. [10] Giuseppe Dattilo and Giandomenico Spezzano. Simulation of a cellular landslide model with camelot on high performance computers. Parallel Comput., 29(10):1403–1418, 2003.
21
[11] E. Deelman, D. Gannon, M. Shields, and I. Taylor. Workflows and e-science: An overview of workflow system features and capabilities. Future Generation Computer Systems, July 2008. [12] Martin Ester, Hans-Peter Kriegel, Jorg Sander, and Xiaowei Xu. A densitybased algorithm for discovering clusters in large spatial databases with noise. In Proc. 2nd Int. Conf. on Knowledge Discovery and Data Mining, pages 226– 231, 1996. [13] Gianluigi Folino, Agostino Forestiero, Giuseppe Papuzzo, and Giandomenico Spezzano. Mose: a grid-enabled software platform to solve geoprocessing problems. Il Nuovo Cimento, 28(2), 2005. [14] Gianluigi Folino, Agostino Forestiero, and Giandomenico Spezzano. Swarmbased distributed clustering in peer-to-peer systems. In Artificial Evolution, pages 37–48, 2005. [15] Gianluigi Folino and Giandomenico Spezzano. An adaptive flocking algorithm for spatial clustering. In PPSN, pages 924–933, 2002. [16] Gianluigi Folino and Giandomenico Spezzano. Camelotgrid: A grid-based pse for autonomic cellular applications. In 13th Euromicro Conference on Parallel, Distributed and Network-based Processing, Lugano, Switzerland, February 2005. [17] Gianluigi Folino and Giandomenico Spezzano. An autonomic tool for building self-organizing grid-enabled applications. Future Generation Computer Systems, 23(5):671–679, 2007. [18] Spezzano G. and D. Talia. The carpet programming environment for solving scientific problems on parallel computers. Parallel and Distributed Computing Practices, 1(3):49–61, 1998. [19] Cannataro M., Comito C., Congiusta G., Folino G., Mastroianni C., Pugliese A., Spezzano G., Talia D., and Veltri P. A general architecture for grid-based pse toolkits. In Workshop on State-of-art in Scientific Computing (PARA’04), 2004. [20] H. Miller and J. Han, editors. Morgan Kaufmann, 1959. [21] OASIS Standard, Version 2.0. Web service business Process Execution Language Version 2.0 Specification, April 2007. [22] Richard Olejnik, Teodor-Florin Forti¸s, and Bernard Toursel. Webservices oriented data mining in knowledge architecture. Future Generation Computer Systems, 25(4):436–443, 2009. [23] Ping Luo, Kevin L¨ u, Zhongzhi Shi, and Qing He. Distributed data mining in grid computing environments. Future Generation Computer Systems, 23(1):84– 91, 2007. [24] Beth Plale, Dennis Gannon, Jerry Brotzge, Kelvin Droegemeier, Jim Kurose, David McLaughlin, Robert Wilhelmson, Sara Graves, Mohan Ramamurthy,
22
Richard D. Clark, Sepi Yalda, Daniel A. Reed, Everette Joseph, and V. Chandrasekar. Casa and lead: Adaptive cyberinfrastructure for real-time multiscale weather forecasting. Computer, 39(11):56–64, 2006. [25] Michael Stonebraker, James Frew, Kenn Gardels, and Jeff Meredith. The sequoia 2000 benchmark. In Peter Buneman and Sushil Jajodia, editors, Proceedings of the 1993 ACM SIGMOD International Conference on Management of Data, Washington, D.C., May 26-28, 1993, pages 2–11. ACM Press, 1993. [26] Domenico Talia, Paolo Trunfio, and Oreste Verta. Weka4ws: A wsrf-enabled weka toolkit for distributed data mining on grids. In Proc. of the 9th European Conference on Principles and Practice of Knowledge Discovery in Databases (PKDD 2005), volume 3721 of LNAI, pages 309–320, Porto, Portugal, October 2005. Springer-Verlag. ISBN 3-540-29244-6. [27] Ian Taylor, Matthew Shields, Ian Wang, and Andrew Harrison. Visual Grid Workflow in Triana. Journal of Grid Computing, 3(3-4):153–169, September 2005. [28] Ian Taylor, Matthew Shields, Ian Wang, and Omer Rana. Triana Applications within Grid Computing and Peer to Peer Environments. Journal of Grid Computing, 1(2):199–217, 2003.
23