locations in natural image sequences. ... a final saliency map, which topographically encodes stimulus saliency. ... The most salient locations of the scene.
Published in Computational Methods in Neural Modeling. (In: Lecture Notes in Computer Science) 2686, vol. 1, 702-709, 2003 which should be used for any reference to this work
1
A Model of Dynamic Visual Attention for Object Tracking in Natural Image Sequences Nabil Ouerhani and Heinz H¨ ugli Institute of Microtechnology, University of Neuchˆ atel Rue A.-L. Breguet 2, CH-2000 Neuchˆ atel, Switzerland {Nabil.Ouerhani,Heinz.Hugli}@unine.ch Abstract. Visual attention is the ability to rapidly detect the interesting parts of a given scene on which higher level computer vision tasks can focus. This paper reports a computational model of dynamic visual attention which combines static and dynamic features to detect salient locations in natural image sequences. Therefore, the model computes a map of interest - saliency map - related to static features and a saliency map derived from dynamic scene features and then combines them into a final saliency map, which topographically encodes stimulus saliency. The information provided by the model of attention is then used by a tracking method to attentively track the interesting features in the scene. The experimental results, reported in this work refer to real color image sequences. They clearly validate the reported model of dynamic visual attention and show its usefulness in guiding the tracking task.
1
Introduction
Human vision relies extensively on a visual attention mechanism which selects parts of the scene, on which higher vision tasks can focus. Thus, only a small subset of the sensory information is selected for further processing, which partially explains the rapidity of human visual behavior. Like in human vision, visual attention represents a fundamental tool for computer vision. Thus, the paradigm of computational visual attention has been widely investigated during the last two decades. Numerous computational models have been therefore reported [1–3]. Most of them rely on the feature integration theory presented by Treisman et al. in [4]. The saliency-based model of Koch and Ullman which is one of the most prominent computational models of attention was first presented in [5] and gave rise to numerous software and hardware implementations [6–8]. Most of these works aimed, however, at computing visual attention from static scene images. Little effort has been devoted so far to model dynamic visual attention. Some of the rare attention models that took in consideration the dynamic features of scenes were presented in [9, 3, 10]. This paper reports a computational model of dynamic visual attention which combines static and dynamic features to detect salient locations in natural image sequences. Therefore, the model computes a map of interest - saliency map -
2
related to static features and a saliency map derived from dynamic scene features and then combines them into a final saliency map, which topographically encodes stimulus saliency. The static saliency map is computed from two color-based features and the intensity of each frame, whereas the dynamic saliency map is based on the normal component of the motion vector which is computed using a multiresolution, gradient-based method. The most salient locations of the scene are selected by detecting the spots with the highest activity on the final saliency map using a Winner-Take-All algorithm. The information provided by the dynamic model of attention, like the location of the salient points and their characteristics are exploited by a tracking algorithm. The detected salient points are first characterized, by determining their Most Discriminating Feature (MDF), that is the feature that distinguishes a region from its surrounding. This characterization is then used to track the detected spots over time. The remainder of this paper is organized as follows. Section 2 presents the model of dynamic visual attention. Section 3 describes, how the model of dynamic visual attention guides the tracking task and presents some experimental results. Finally, the conclusions are stated in Section 4.
2
Model of dynamic visual attention
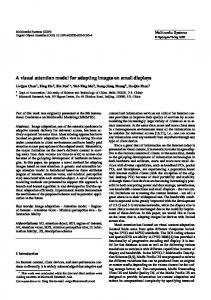
The proposed model of dynamic visual attention computes a static saliency map which discriminates salient scene locations based on static features and a dynamic saliency map that highlights moving scene constituents. The two saliency maps are then combined into a final map of attention also called the final saliency map. The different steps of our model are illustrated in Figure 1. 2.1
The static saliency map
The computation of the static saliency map Ss is achieved in three main steps. Feature maps First, a number of features (1..j..n) are extracted from the scene by computing the so called feature maps Fj . Such a map represents the image of the scene, based on a well-defined feature. This leads to a multi-feature representation of the scene. This work considers three different features which are computed from RGB color images. • Intensity feature F1 = (R + G + B)/3
(1) +
−
• Two chromatic features based on the two color opponency filtersR G and B + Y − where the yellow signal is defined by Y = R+G 2 . Such chromatic opponency exists in human visual cortex [11]. F2 = R − G
and
F3 = B − Y
(2)
3
Image sequence Dynamic features
Static features
(R-G)
(B-Y)
Intensity
Temporal and spatial derivatives
Center-Surround 6 multiscale maps
} N(.)+Sum
N(.)+Sum
N(.)+Sum
}Conspicuity map
Motion estimation
Normalization and Summation Static saliency map
Dynamic saliency map
Combining static/dynamic saliency maps Final saliency map
Fig. 1. Model of dynamic visual attention which combine static and dynamic scene features to detect salient locations in image sequences.
Before computing these two features, the color components are first normalized by F1 in order to decouple hue from intensity. conspicuity maps In a second step, each feature map Fj is transformed in its conspicuity map Cj which highlights the parts of the scene that strongly differ, according to a specific feature, from their surroundings. Multiscale difference-of-Gaussiansfilters, which can be implemented using gaussian pyramids, are suitable means to implement the conspicuity transformation. Practically, For each feature j, a nine scale gaussian pyramid Pj is created by progressively lowpass filter and subsample the feature map Fj , using a gaussian filter G (see Eq. 3). Pj (0) = Fj ,
Pj (i) = Pj (i − 1) ∗ G
(3)
Center-Surround is then implemented as the difference between fine and coarse scales. For each feature j, six intermediate multiscale conspicuity maps Mj,k (1..k..6) are computed according to equation 4, giving rise to 18 multiscale maps for the considered three static features. Mj,1 = |Pj (2) − Pj (5)|, Mj,2 = |Pj (2) − Pj (6)|
4
Mj,3 = |Pj (3) − Pj (6)|, Mj,4 = |Pj (3) − Pj (7)| Mj,5 = |Pj (4) − Pj (7)|, Mj,6 = |Pj (4) − Pj (8)|
(4)
Note that these intermediate multiscale conspicuity maps are sensitive to different spatial frequencies. Fine maps (e.g. Mj,1 ) detect high frequencies and thus small image regions, whereas coarse maps, such as Mj,6 , detect low frequencies and thus large regions. For each feature j, the six multiscale maps Mj,k are then combined, in a competitive way into a unique feature-related conspicuity map Cj : Cj =
6 X
wk Mj,k
(5)
k=1
The weighting function w, which simulates the competition between the different scales, is described below. The static saliency map Finally, the three conspicuity maps Cj are integrated, in a competitive way, into the static saliency map Ss in accordance with equation 6. Ss =
3 X
wj Cj
(6)
j=1
The weights wi are determined according to a weighting function w = (M −m)2 , where M is the maximum activity of the conspicuity map and m is the average of all its local activity maxima. Indeed, this weighting function promotes conspicuity maps in which a small number of strong peaks of activity is present. Maps that contain numerous comparable peak responses are demoted. It is obvious that this competitive mechanism is purely data-driven and does not require any a priori knowledge about the analyzed scene.
2.2
Dynamic saliency map
The dynamic saliency map Sd should discriminate moving objects in the scene. Since we assume that we deal with image sequences acquired with a static camera, a map related to optical flow approaches well the required map. Therefore, we use a gradient-based method to compute optical flow, which is fairly robust and simple to compute. A drawback of the gradient approach is that it may only be used for small displacements. To overcome this difficulty, we compute optical flow at different scales, taking advantage of gaussian pyramids. This multiscale concept allows the detection of small displacements at fine scales, whereas large displacements are detected at coarser scales [12]. A combination of the optical flow maps, computed at different scales, gives rise to a motion map that clearly discriminates moving scene objects.
5
frame 28
Spots of attention
Sd
Ss
S
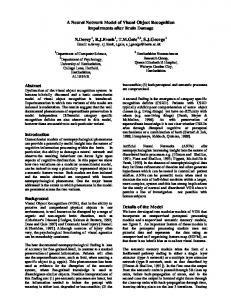
Fig. 2. Detecting salient spots using static and dynamic features. From the frame 28 of our test sequence, we compute a static (Ss ) and a dynamic (Sd ) saliency maps which are combined into the final saliency map (S). WTA is then applied to detect the five most salient locations (spots of attention) in this frame.
2.3
The final saliency map
In this section, we aim at integrating the static saliency map Ss and the dynamic one Sd . The basic idea is that the two cues should compete for saliency. The purely data-driven competition mechanism presented above (Section 2.1) is a suitable integration concept of both cues. Thus, the final saliency map S is computed according to equation 7. S = ws Ss + wd Sd
(7)
Where ws and wd are computed by the weighting function w presented above. 2.4
Selection of salient locations
The most salient locations of the scene are selected by applying a Winner-TakeAll (WTA) network on the final saliency map S. The number (1..i..m) of the detected locations can be either set by the user or determined automatically through the activities of the saliency map. Figure 2 shows an example of a dynamic, static and final saliency maps. It also illustrates the selection of the most salient locations (spots of attention).
3
Attentive tracking
The basic idea is exploit the information provided by the visual attention algorithm about the scene to achieve the tracking of the salient features or locations. Therefore, the detected spots of attention are first characterized by determining their Most Discriminating Feature and then tracked over time.
6
3.1
Characterization of the spots of attention
In a tracking context, its important to attribute robust features to the tracked objects. The Most Discriminating Feature j ∗ of a salient location fulfills this criterion. Since equation 6 can be rewritten as follows: Ss =
3 X 6 X
wjk Mj,k
(8)
j=1 k=1
j ∗ can be computed according to equation 9. j ∗ = argmaxj (Mj,k (x))
(9)
Where x is the spatial location of the considered spot of attention. Thus, each of the m (1..i..m) spots detected in frame t can be denoted by Pt,i (x, j ∗ ), where x is the spatial coordinate of the spot. Figure 3.1 shows an example of spot characterization.
1 (I)
Original image
Spots characterization
2 (R-G)
3 (B-Y)
Feature representation
Fig. 3. Spots characterization. Each of the five detected spots is assigned one of the three static features (intensity, (R − G) and (B − Y )). A color representation of these features is used (right image).
3.2
Tracking of the spots of attention
This section presents an attentive tracking method that tracks the salient locations of the scene based on Most Discriminating Features (j ∗ ). The tracking algorithm starts with creating m initial trajectories, each of which contains one of the m detected spots of attention in the first frame. A new detected spot of attention is either inserted into an existing trajectory or gives rise to a new one, depending on its similarity with the last inserted spot - the head element- of already existing trajectories. Formally, let Pt1 ,i1 (x1 , j1∗ ) the actual detected spot of attention and T a trajectory whose head element is the spot Pt2 ,i2 (x2 , j2∗ ). The decision whether the actual spot is inserted to T is taken according to equation 10. ½ T ∪ {Pt1 ,i1 (x1 , j1∗ )} if j1∗ = j2∗ & ||x1 − x2 || < ² T = (10) T otherwise
7
Where ||.|| is an euclidean distance and ² is a threshold that can be set manually or learned automatically. Thus, the matching between a given spot and the head element of a given trajectory is based on feature similarity and spatial proximity. As mentioned above, if a detected spot does not correspond to any existing trajectory, then it initializes a new one. In a postprocessing step those trajectories which contain only few spots (less 10% of the total number of frames) are discarded. This postprocessing allows to keep only persistent trajectories. An example of attentive tracking is illustrated in figure 3.2.
All trajectories
frame 12
frame 37
frame 47
frame 66
frame 70
frame 97
Fig. 4. Attentive tracking. The top image represents all tracked trajectories after the postprocessing step. The large colored circles on this image represent salient static locations. The other images represent the detected spots of attention and the corresponding trajectories in sample frames of the test sequence.
4
Conclusion
This paper presents a computational model of dynamic visual attention which combines static and dynamic features in order to detect the most salient loca-
8
tions in dynamic scenes. Therefore, a static and a dynamic saliency maps are first computed and then integrated, in a competitive manner, into a final map of attention, the saliency map on which a Winner-Take-All algorithm is applied to select the most visually salient parts of the scene. Tracking-relevant information are extracted from the hierarchical structure of the attention model in order to guide an attentive tracking algorithm which is able to track salient scene constituents over time. The examples presented in this work illustrate the different stages of our attention model and show the usefulness of attention-based scene information to carry on the tracking task. In future work, effort will be devoted to the improvement of the tracking algorithm by allowing the tracking of feature vectors instead of single features.
References 1. S. Ahmed. VISIT: An Efficient Computational Model of Human Visual Attention. PhD thesis, University of Illinois at Urbana-Champaign, 1991. 2. R. Milanese. Detecting Salient Regions in an Image: from Biological Evidence to Computer implementation. PhD thesis, Dept. of Computer Science, University of Geneva, Switzerland, Dec. 1993. 3. J.K. Tsotsos. Toward computational model of visual attention. In T. V. Papathomas, C. Chubb, A. Gorea & E. Kowler, Early vision and beyond, pp. 207–226. Cambridge, MA: MIT Press, 1995. 4. A.M. Treisman and G. Gelade. A feature-integration theory of attention. Cognitive Psychology, pp. 97-136, Dec. 1980. 5. Ch. Koch and S. Ullman. Shifts in selective visual attention: Towards the underlying neural circuity. Human Neurobiology (1985) 4, pp. 219-227, 1985. 6. L. Itti, Ch. Koch, and E. Niebur. A model of saliency-based visual attention for rapid scene analysis. IEEE Transactions on Pattern Analysis and Machine Intelligence (PAMI), Vol. 20(11), pp. 1254-1259, 1998. 7. N. Ouerhani and H. Hugli. Computing visual attention from scene depth. Proc. ICPR 2000, IEEE Computer Society Press, Vol. 1, pp. 375-378, Barcelona, Spain, Sept. 2000. 8. N. Ouerhani, H. Hugli, P Y. Burgi, and P F. Ruedi. A real time implementation of visual attention on a simd architecture. Proc. DAGM 2002, Springer Verlag, Lecture Notes in Computer Science (LNCS) 2449, pp. 282-289, 2002. 9. R. Milanese, S. Gil, and T. Pun. Attentive mechanisms for dynamic and static scene analysis. Optical Engineering, Vol. 34, (8), pp. 2428-2434, 1995. 10. A. Maki, P. Nordlund, and J.O. Eklundh. Attentional scene segmentation: Integrating depth and motion from phase. Computer Vision and Image Understanding, vol.78, pp.351-373, June, 2000. 11. S Engel, X. Zhang, and B. Wandell. Colour tuning in human visual cortex measured with functional magnetic resonance imaging. Nature, Vol. 388, no. 6637, pp. 68-71, Jul. 1997. 12. E. Simoncelli. Coarse-to-fine estimation of visual motion. Proceedings, Eighth Workshop on Image and Multidimensional Signal Processing. Cannes France, sept., 1993.