Journal of Information Processing Systems, Vol.7, No.4, December 2011
http://dx.doi.org/10.3745/JIPS.2011.7.4.581
A Multi-Application Controller for SAGE-enabled Tiled Display Wall in Wide-area Distributed Computing Environments Yuki Fujiwara*, Susumu Date**, Kohei Ichikawa*** and Haruo Takemura** Abstract—Due to the recent advancement of networking and high-performance computing technologies, scientists can easily access large-scale data captured by scientific measurement devices through a network, and use huge computational power harnessed on the Internet for their analyses of scientific data. However, visualization technology, which plays a role of great importance for scientists to intuitively understand the analysis results of such scientific data, is not fully utilized so that it can seamlessly benefit from recent high-performance and networking technologies. One of such visualization technologies is SAGE (Scalable Adaptive Graphics Environment), which allows people to build an arbitrarily sized tiled display wall and is expected to be applied to scientific research. In this paper, we present a multi-application controller for SAGE, which we have developed, in the hope that it will help scientists efficiently perform scientific research requiring high-performance computing and visualization. The evaluation in this paper indicates that the efficiency of completing a comparison task among multiple data is increased by our system. Keywords—Tiled Display Wall, SAGE, Multiple Application Control
1. INTRODUCTION Recently, high-performance computing technology has been dramatically improved. Examples of such high-performance computing technology include Grid computing [1], Cloud computing [2], GPGPU [3], and multi-core [4] programming techniques. The advancement of such technology and techniques allows scientists to examine large-scale amounts of scientific data for their scientific research. Likewise, the advancement of networking technology is remarkable these days. In fact, 10 Gbps-class networks are currently available. SINET3 [5] and JGN2plus [6] are examples of such networks in Japan. Moreover, measurement technology has been developing and temporal and space resolutions of scientific measurement devices continue to grow. The fact that even commercially available digital cameras already have more than 10 million ※ This work was founded as a part of the research and development of construction technology on next generation network service infrastructure sponsored by the National Institute of Information and Communications Technology (NICT) in Japan. Manuscript received October 1, 2010; accepted January 7, 2011. Corresponding Author: Kohei Ichikawa * Graduate School of Information Science and Technology, Osaka University, Osaka, Japan (fujiwara.yuki @lab.ime.cmc.osaka-u.ac.jp) ** Cybermedia Center, Osaka University, Osaka, Japan ({date; takemura}@cmc.osaka-u.ac.jp) *** Central Office for Information Infrastructure, Osaka University, Osaka, Japan (
[email protected])
581
Copyright ⓒ 2011 KIPS (ISSN 1976-913X)
A Multi-Application Controller for SAGE-enabled Tiled Display Wall in ~
pixel resolutions illustrates the advancement of measurement technology. As a result of the advancement in high-performance computing, networking, and measurement technology, scientists efficiently can obtain dense amounts of scientific data from scientific measurement devices and then perform large-scale scientific analyses using large amounts of computational power harnessed from the Internet. However, on the other hand, visualization, which plays a role of great importance for scientists to intuitively understand analysis results, is not used efficiently although many visualization technologies have been developed. In fact, it is, in most cases, ordinary for scientists to use at most a couple of LCD monitors for visualization of analysis results even though they require more sophisticated visualization methods and techniques to better understand their analysis results. A possible reason for this situation is that visualization technology has been developed separately from high-performance computing and networking technology. An example of such visualization technology includes SAGE (Scalable Adaptive Graphics Environment) [7, 8, and 9]. It is being developed by the EVL (Electronic Visualization Laboratory) at UIC (University of Illinois, Chicago) and allows scientists to build a large-scale tiled display wall composed of a multiple set of monitors and computers. The SAGE-enabled tiled display wall receives visualization data from multiple visualization applications, each of which is deployed onto a remote site, and then simultaneously displays the data on the wall. This feature of the SAGE is considered to be promising when applied to scientific research because it is expected to gather scientific data and knowledge geographically dispersed on the Internet and thereby streamline the workflow of scientific research. Many universities and research laboratories have been developing applications for SAGE and performing worldwide collaborations using SAGE [10]. However, the SAGE does not provide a way for users to control remote visualization applications, while it does allow users to change the size and location of the windows appearing on the tiled display wall. One of the reasons for this is that SAGE is still a technology under development and thus there remain some problems to be solved for its practical use in scientific research. From the perspective described above, we are exploring a functionality that will allow scientists to use the tiled display wall for actual scientific research. Moreover, the ultimate goal of our research is to provide scientists with a solution with which they can seamlessly perform scientific research using wide-area distributed computing and large-scale visualization. In this paper, we present a SAGE-enabled multi-application controller streamlining the workflow of scientific research within a wide-area distributed computing environment. After that, through an evaluation of a comparison task among multiple scientific data, we show that our developed controller could improve the efficiency of scientific research as we believe it often manifests in real-world scientific research. This paper is structured as follows. In section 2 we show an example of scientific application requiring wide-area distributed computing and large-scale visualization and then discuss an issue with SAGE to be tackled from a perspective of streamlining the workflow of scientific research. After that, section 3 presents the architecture of a multi-application controller for SAGE as our solution. In section 4 we show an application use case where the proposed multiapplication controller for SAGE is effective, and subsequently evaluate the usefulness of the proposed multi-application controller for SAGE through a comparison task among multiple scientific data in section 5. Section 6 introduces related works for this study. Finally, we conclude the paper in section 7 discussing future directions.
582
Yuki Fujiwara, Susumu Date, Kohei Ichikawa and Haruo Takemura
2. ISSUE WITH SAGE In this section, we discuss an issue with SAGE when the SAGE-enabled tiled display wall is used for recent scientific research. For the discussion, we first introduce a biological application requiring the seamless integration of wide-area distributed computing and large-scale visualization for conducting a typical parameter-study application as observed in various scientific fields. After that, we focus on a technical issue with SAGE when using the SAGE-enabled tiled display wall to streamline the workflow of scientific research.
2.1 An Example of Scientific Application Docking simulations are a typical example of future scientific research that could benefit from the tiled display wall. A docking simulation is a simulation investigating whether a chemical compound binds to a protein and is performed by chemically calculating the binding power between them. Through the simulation, biologists can screen a large number of chemical compounds. Today, thanks to the advancement of wide-area distributed computing, biologists can complete docking simulations of hundreds or thousands of chemical compounds regarding a target protein for drug discovery research within a realistic time [11]. However, biologists, in reality, do not have any sophisticated visualization method or technology that can help them intuitively understand the results, in spite of the fact that it is necessary and important to visualize the compounds to check whether or not the simulated binding is practical and possible. Therefore, biologists now demand visualization technology and methods to allow them to simultaneously compare multiple results of docking simulations in order to discern the differences and similarities between each docking simulation. This type of application, in which a single program is repeatedly performed with different parameter sets, is categorized into parameter-study application and has a role of importance in various scientific fields. For example, in the research field of medical image analysis, a filtering program is executed repeatedly with different sets of parameters so that blood vessels of a certain width are detected and highlighted. Also, in the research filed of brain science, a signal processing program such as Fourier and Wavelet is repeatedly performed with different parameter sets regarding brain signals obtained through such medical measurement devices as EEG, ECoG and MEG. For this type of application, in general, comparisons of computational results always become important and indispensable. Therefore, the simultaneous visualization of such scientific data as computational results on a tiled display wall is expected to be effective for comparison in discerning the differences and similarities between them, especially in parameterstudy application.
2.2 Scalable Adaptive Graphics Environment SAGE is middleware developed at the EVL (Electronic Visualization Laboratory) at the University of Illinois, Chicago. It allows scientists to build an arbitrary size of a tiled display wall composed of multiple LCDs and computers. The SAGE is mainly composed of four components; the SAGE Receiver, the SAIL (SAGE Application Interface Library), the Free Space Manager and the SAGE UI (Fig. 1). The SAGE Receiver runs on each of the computers connected to LCD monitors that comprise a tiled display wall. The Receiver has the function of receiving visualization data streamed from a SAIL-enabled application and then displaying the
583
A Multi-Application Controller for SAGE-enabled Tiled Display Wall in ~
Tiled Display Wall Control Message Pixel Stream
Management Node
SAGE UI A
Free Space Manager Display Nodes
C
SAGE UI A
C
SAGE Receiver
B
B
SAIL
SAIL
SAIL
App1
App2
App3
Fig. 1. Overview of SAGE architecture
data on LCD monitors connected to the computer on which the application is running. SAIL is a library that enables scientists to develop an application that serves to display visualized data on the tiled display wall. More technically, through the use of SAIL APIs, the visualization data generated by the application are split and then streamed to SAGE receivers on the network, based on the directions from the Free Space Manager. The Free Space Manager runs on an administration computer and serves the role of window management for the tiled display wall. The Manager receives such window management events as size change and movement as detected on the SAGE UI (Fig. 2), and then sends control signals to the SAGE Receiver and SAILenabled applications so that such events are reflected on the tiled display wall. The SAGE UI is the graphical user interface through which scientists can perform window management.
Fig. 2. SAGE UI
584
Yuki Fujiwara, Susumu Date, Kohei Ichikawa and Haruo Takemura
2.3 Issues As described in section 1, due to the recent advancement of high-performance computing and networking technology, today’s scientists can simultaneously access various kinds of large-scale scientific data dispersed on the Internet for their analyses. Consequently this implies that the success of scientific research lies in whether or not scientists can efficiently handle large scale amounts of scientific data dispersed on the Internet. In general, the scientific research process is often composed of three stages of data obtainment, i.e. measurement through scientific devices, data analysis and visualization for implementation of data analysis. Therefore, whether scientists can seamlessly and efficiently perform these three stages or not is becoming important in current practical scientific research, that is, e-science. As observed in section 2.2, the SAGE allows scientists to display visualization data generated from SAIL-enabled applications, each of which may be sourced at a different remote location. This fact means that scientists can simultaneously visualize scientific data obtained from multiple scientific measurement devices and databases, each of which possibly being dispersed geographically, and also can show multiple results of computations performed on remote computers dispersed on the Internet, using such recent wide-area distributed computing technology as the Grid, on a tiled display wall. For this reason, many scientists expect SAGE to be a promising technology for future e-science research. However, SAGE has a serious problem in application operability for practical e-science research. Although SAGE can accept window managementrelated events from the SAGE UI, as explained in section 2.2, it cannot handle applicationrelated events received from the SAGE UI. In other words, the SAGE UI cannot allow scientists to control the behavior of applications running on remote computers through the interface of the SAGE UI. Therefore, for all practical intents and purposes, in order to interact with the displayed applications on a tiled display wall, scientists have to employ SSH (Secure Shell) on remote machines running the visualization applications, then forward X-window of the applications to the local machine, and then send application events such as mouse drags and clicks. Thus, scientists have to use the SAGE UI for management of window operation and unfortunately cannot help relying on such methods as SSH for application control in utilizing the tiled
Docking simulation
Scientist
Site C Docking simulation Network streaming of visualized images Compounds DB
Compounds DB
Site A
Site B Docking simulation
Direct control is not allowed Scientist Compounds DB
Fig. 3. Issues with SAGE
585
Visualization on TDW Scientist
A Multi-Application Controller for SAGE-enabled Tiled Display Wall in ~
display wall. This situation results in inefficient scientific research. As mentioned in section 2.1, scientists can now perform docking simulations for various combinations of a protein and a chemical compound by using computers on the Internet through the use of Grid and Cloud computing technology within reasonable time frames. On the other hand, however, using the current SAGE-enabled tiled display walls, scientists have difficulty in visualizing and comparing docking simulation results dispersed on the Internet, as regards changing the orientation and size of visualized docking simulation results in a collaborative manner (Fig. 3).
3. DESIGN AND IMPLEMENTATION OF A MULTI-APPLICATION CONTROLLER FOR SAGE Based on the observation in section 2 dealing with the issue of application operability, we have developed a multi-application controller for SAGE. It allows scientists to interact with visualization applications in a collaborative manner in finding differences and similarities among visualized scientific data. In this section we present its design and implementation.
3.1 Architecture Overview Figure 4 shows the architecture of the multi-application controller for SAGE, which we have designed and developed. In this research we have used SAGE 2.5 for implementation. The multi-application controller for SAGE allows scientists to send application events to multiple visualization programs built with SAIL on remote machines through the SAGE UI and then visualize scientific data on remote machines in a simultaneous and collaborative manner. The controller is composed of four functions; an event detection function, an event message transmission function, an event message duplication function and an event analysis message function. The controller is developed by extending our previous work [12] so that it is seamlessly integrated into the original SAGE. Tiled Display Wall
SAGE UI
Event detection
A C
Event message transmission
B
Management Node
Free Space Manager
Event message duplication
Display nodes
SAGE Receiver Event message
Pixel Stream
SAIL Event message analysis
SAIL Event message analysis
SAIL Event message analysis
Application Node A
Application Node B
Application Node C
Fig. 4. Multi-application controller for SAGE
586
Yuki Fujiwara, Susumu Date, Kohei Ichikawa and Haruo Takemura
3.2 Event Detection Function The event detection function is developed and built into the SAGE UI and has the function of detecting application events occurring on it. We have developed this function as an event handler of wxWidgets that capture application operation information because the SAGE UI was developed with wxWidgets. wxWidgets is a cross-platform GUI library [13]. It allows people to easily write desktop applications with a graphical user interface. This library serves the purpose of an event handler chain so that it is able to detect a variety of events and then flexibly respond to the detected events. Using this event handler mechanism, we have extended the original SAGE UI so that it can detect application events.
3.3 Event Message Transmission Function The event message transmission function has the role of producing our proprietary application control message based on the event information passed from the event detection function and then delivering it to the Free Space Manager via the event message duplication function. The original SAGE UI has a SAGEGate class which produces and transmits messages for the Free Space Manager. Examples of the existent messages that SAGEGate transmits include window control, application invocation and SAGE shutdown. For the implementation of our controller, we have extended this SAGEGate class so that it transmits the assembled application control message based on the information of the detected event.
3.4 Event Message Duplication Function The event message duplication function has the role of duplicating application control messages for the SAGE-enabled applications running on remote computers. The duplicated application control message is then sent to the corresponding applications, which users can control in a synchronized way, via the Free Space Manager. The Free Space Manager knows the locations of computers upon which the corresponding applications are running, and forwards the messages from the event message duplication function to the applications. With this mechanism, the users can control multiple applications running on remote computers.
3.5 Event Message Analysis Function The event message analysis function checks the application control message sent from the SAGE UI via the Free Space Manager and then inserts the application event into the event queue of the target application. We have developed this function as a new class named appMessageHandler by building it into the existent SAIL. The appMessageHandler works after being initialized. If an application does not initialize it, the application control message is not delivered to the event message analysis function. Conversely, to utilize this function in the application, the user needs only to add several codes to the application for initialization. Users can easily select whether to use the function or not. In addition, both applications with this function and applications without this function can run.
4. A USE CASE OF MULTI-APPLICATION CONTROLLER FOR SAGE As we described in section 2, a docking simulation requires visualization that allows scientists 587
A Multi-Application Controller for SAGE-enabled Tiled Display Wall in ~
Database of chemical compounds Docking simulation
・・・・ ・・・・
Only data of interest are stored
Visualization on TDW
Local database
Fig. 5. Envisioned workflow of a docking simulation using TDW
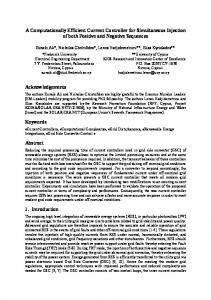
to intuitively understand the computational results. How our solution can be used in biological research using docking simulation is described as an example of scientific research area below. Figure 5 illustrates the workflow of the docking simulation we envision. The docking simulation uses a database of chemical compounds such as ZINC [14]. In the case of using wide-area distributed computing technology characterized with the Grid, chemical compound data of the database are separately located among multiple computers on the Internet, and then the docking simulation is independently performed on each computer. As a result, the computational results of a docking simulation remain on remote computers. In our envisaged workflow, scientists invoke the visualization viewer, which is enabled by SAIL, such as RasMol and Chimera, on remote computers. The visualized results of docking simulation are streamed and then visualized on the tiled display wall in front of scientists. Figure 6 is a snapshot of docking simulation results simultaneously displayed on a tiled display wall. The developed multi-application controller allows scientists to send mouse events occurring on the SAGE UI through our developed controller to RasMol viewers running on remote computers in an interactive and synchronized manner. More specifically, scientists can
Fig. 6. Snapshot of a tiled display wall displaying results of docking simulation
588
Yuki Fujiwara, Susumu Date, Kohei Ichikawa and Haruo Takemura
check and compare multiple results of docking simulation, each of which having been calculated on a different computer, intuitively and efficiently, for the purpose of biological research. In our envisaged workflow, only results of interest to the scientists are moved to the scientists’ local computer or database.
5. EVALUATION In this section we evaluate the usefulness and practicality of our developed multi-application controller for SAGE. Specifically, by taking the application example introduced in section 4 into consideration, we evaluate the efficiency of subjects’ completing a comparison task of multiple visualization data on the SAGE tiled display wall using our multi-application controller.
5.1 Evaluation Environment Figure 7 shows the overview of the evaluation environment used for this evaluation. This evaluation assumes that docking simulations are performed in two distant places and then the results of docking simulation are visualized on a tiled display wall for checking and comparison of results. Based on this assumption, this evaluation was performed between the Suita and Toyonaka Campuses of Osaka University. The distance between the two campuses is around 10 km. At the Toyonaka campus, we set up a 2 x 2 tiled display wall composed of 4 LCD monitors and three computers. Two of the three computers were connected to each of the two LCD monitors, configured with an installed SAGE Receiver. The SAGE UI and the Free Space Manager were set up on the third computer. At the Suita campus, each of the four computers had a SAILenabled RasMol [15], which we developed and installed for this experiment.
5.2 Method Under the evaluation environment shown in Fig. 7, we performed the following experiment to see how efficiently scientists find the differences and similarities between visualized scientific data on a tiled display wall with the multi-application controller deployed. In this experiment, a user in front of the tiled display wall located at the Toyonaka campus controls the application running on computers at the Suita Campus and attempts to complete a comparison task, by browsing multiple visualization data streamed from the Toyonaka campus. For the subject task, we adopted the comparison task of finding a cubic lattice with a deficit shown in Fig. 8, out of Toyonaka
SAGE Receiver
Suita
TDW
SAGE UI
Free Space Manager
Browse Control
Fig. 7. Overview of experimental environment
589
SAIL (Application)
A Multi-Application Controller for SAGE-enabled Tiled Display Wall in ~
normal
deficit[angle]
deficit[edge]
deficit[face]
Fig. 8. Cubic lattices used for evaluation
multiple cubic lattices displayed on the tiled display wall. To evaluate the usefulness and practicality of our developed multi-application controller, we measured the time the subject needed to complete the comparison task described above in two cases of different controllability. The first case represents the time when the multi-application controller conveys the application event occurring on the SAGE UI to all four computers with SAIL-enabled RasMol running (Case A). The second case represents the time when the multiapplication controller conveys the application event occurring on SAGE UI to only a computer corresponding to the event that occurred with running our SAIL-enabled RasMol (Case B). For each case, we have prepared the following two situations. The first situation is to find a lattice with a deficit on the tiled display wall where 8 cubic lattices are simultaneously visualized, the other situation is to find among 24 cubic lattices. Through two situations, we investigate how the number of applications displayed on a tiled display wall affects the efficiency of subject’s completing the task.
5.3 Result We measured the completion times of the allocated comparison tasks carried out by the 10 subjects. The time measured is the time taken from when we told the subject to start comparison until when the subject found the cubic lattice with a deficit. The measurement was performed twice for each subject. It resulted in 40 data for each case of Case A and Case B and for each situation where the number of cubic lattices was 8 and 24. Figure 9 is the boxplot based on the measurement results. In situations in which the number of the simultaneously visualized cubic lattices was 8, the boxplot shows that the time taken for the allocated comparison task was almost the same in both cases. On the other hand, in the situations of 24 cubic lattices, the result shows a large difference in each case. The time taken for the task in Case A was approximately 25 seconds, while the time in Case B was approximately 130 seconds. This fact indicates that our developed multi-application controller is not always useful for the simultaneous control of small numbers of applications. However, it works well and is useful for the control of the large numbers of applications in the assigned comparison tasks.
590
Yuki Fujiwara, Susumu Date, Kohei Ichikawa and Haruo Takemura
Fig. 9. Measurement results of task completion
6. RELATED WORKS There are several reported research endeavors related to tiled display walls. Xdmx [16] (Distributed Multi-head X server) allows scientists to build a single tiled display wall by running multiple X servers on different computers in a collaborative manner. With Xdmx, scientists can use the tiled display wall as if it were a single display like SAGE-enabled tiled display wall. The benefit of Xdmx is that it allows us to run X applications as is and without the need for modification unlike SAGE. However, since Xdmx handles all graphic contents for a tiled display wall on a single head node, Xdmx is not scalable for large tiled display walls. Furthermore, in order to allow control of multiple applications as per our proposal, the application events captured by a single application have to be broadcasted to other X applications sharing the tiled display wall and this requires much further development because Xdmx has no global management entity like Free Space Manager. As other examples of tiled display wall middleware, Chromium [17] and CGLX (CrossPlatform Cluster Graphic Library) [18] can be mentioned. Chromium and CGLX also allow scientists to build a tiled display wall. They support distributed rendering for large-scale visualization, and allow scientists to display OpenGL applications. However, the distributed rendering function supported by these examples of middleware is limited within the computers making up the tiled display wall. They do not provide network streaming functionality and do not support wide-area distributed visualization like SAGE. Therefore, these tiled display wall middleware programs were not adopted in our research. ViewDock TDW [19] is a program example allowing multiple application control. ViewDock TDW has been developed in order to visualize the results of docking simulations on a tiled display wall. ViewDock TDW launches Chimera [20], which is one of viewers for docking simulation results, on each of the computers connected to the monitors and allows scientists to control the multiple Chimera. ViewDock TDW does not use any special tiled display middleware. It just launches Chimera on each of the computers and provides a specialized program to control multiple Chimera simultaneously. Since ViewDock TDW is designed only for Chimera, it does not support control of other applications. Moreover, because it does not use tiled display middleware, it cannot allow scientists to use the multiple display as a single large display. It is therefore inadequate for our research purposes.
591
A Multi-Application Controller for SAGE-enabled Tiled Display Wall in ~
7. CONCLUSION AND FUTURE DIRECTION In this paper, we focused on the problem that the current SAGE does not provide a way for users to control remote visualization applications, while it does have an interface whereby users can change the size and location of windows appearing on a tiled display wall. In lieu of this problem, we have explored the functionality of allowing scientists to use a tiled display wall for actual scientific research. As a result, we have developed a multi-application controller for SAGE. The controller was realized using already built-in components of the SAGE, which allows scientists to control multiple applications running on remote computers on the Internet in a synchronized way. Evaluations performed in this research showed that the subjects completed the task of finding a cubic lattice with a deficit out of 24 cubic lattices on the tiled display wall more efficiently in the case of the SAGE with our developed controller than without our developed controller. In the current implementation of our proposed controller, we simply duplicate the application event detected in a SAIL-enabled visualization application through the SAGE UI and then send the duplicated events to all applications on remote computers for collaborative visualization. Evaluation in the paper indicates this simple solution can help users perform comparison tasks to find the similarities and differences among multiple visualized data. However, we encountered the problem that the latency from application events being sent through the SAGE UI until each application was displayed on the tiled display wall resulted in different reactions application by application. We hypothesize that the synchronization among multiple applications displayed on the tiled display wall is the first issue which we have to tackle. It is our hope to contribute to research on large-scale visualization technology useful in practical scientific research, by working on the development of a docking simulation system that allows scientists to seamlessly perform scientific research composed of data obtainment, data analysis and visualization.
REFERENCES [1]
I. Foster and C. Kesselman, “The Anatomy of the Grid: Enabling Scalable Virtual Organizations,” International Journal of High Performance Computing Applications, Vol.15, No.3, 2001, pp.200-222. [2] D. Nurmi, R. Wolski, C. Grzegorczyk, G. Obertelli, S. Soman, L. Youseff and D. Zagorodnov, “The Eucalyptus Open-source Cloud-computing System,” Proceedings of 9th IEEE International Symposium on Cluster Computing and the Grid, Shanghai, China, May, 2009, pp.124-131. [3] C. Trapnell and M. C. Schatz. “Optimizing data intensive GPGPU computations for DNA sequence alignment,” Parallel Computing, Vol.35, No.8-9, 2009, pp.429-440. [4] D. Geer. “Chip makers turn to multicore processors,” IEEE Computer, Vol.38, No.5, 2005, pp.11-13. [5] “SINET3 Science Information NETwork,” http://www.sinet.ad.jp/ [6] “JGN2plus Advanced Testbed Network for R&D,” http://www.jgn.nict.go.jp/ [7] “Salable Adaptive Graphics Environment (SAGE),” http://www.evl.uic.edu/cavern/sage/index.php [8] L. Renambot, A. Rao, R. Singh, B. Jeong, N. Krishnaprasad, V. Vishwanath, V. Chandrasekhar, N. Schwarz, A. Spale, C. Zhang, G. Goldman, J. Leigh and A. Johnson, “SAGE: the scalable adaptive graphics environment,” Proceedings of the Fourth Workshop on Advanced Collaborative Environments, Nice, France, September, 2004. [9] B. Jeong, L. Renambot, R. Jagodic, R. Singh, J. Aguilera, A. Johnson and J. Leigh, “Highperformance dynamic graphics streaming for scalable adaptive graphics environment,” Proceedings of the 2006 ACM/IEEE conference on Supercomputing, Tampa, FL, November, 2006, pp.108. [10] “SAGE :: APPLICATIONS,” http://www.evl.uic.edu/cavern/sage/applications.php [11] M. J. Levesque, K. Ichikawa, S. Date and J. H. Haga, “Design of a grid service-based platform for in
592
Yuki Fujiwara, Susumu Date, Kohei Ichikawa and Haruo Takemura
[12]
[13] [14] [15] [16] [17]
[18]
[19] [20]
silico protein-ligand screenings,” Computer Methods and Programs in Biomedicine, Vol.93, No.1, 2009, pp.73-82. S. Kuwabara, K. Ichikawa, S. Date and S. Shimojo, “A Built-in Application Control Module for SAGE,” Proceedings of 2007 IEEE Pacific Rim Conference on Communications, Computers and Signal Processing (PACRIM 2007) , Victoria, Canada, August, 2007, pp.117-120. J. Smart, K. Hock and S. Csomor, Cross-Platform GUI Programming With wxWidgets, Prentice Hall PTR, 2005. “A free database for virtual screening ZINC,” http://zinc.docking.org/ R.A. Sayle and E. James Milner-White, “RASMOL: biomolecular graphics for all,” Trends in Biochemical Sciences, Vol.20, No.9, 1995, pp.374-376. “Distributed multi-head X project,” http://dmx.sourceforge.net/ G. Humphreys, M. Houston, R. Ng, R. Frank, S. Ahern, P. Kirchner and J. Klosowski, “Chromium: a stream-processing framework for interactive rendering on clusters,” ACM Transactions on Graphics, Vol.21, No.3, 2002, pp.693-702. K.U. Doerr and F. Kuester, “CGLX: A Scalable, High-performance Visualization Framework for Networked Display Environments,” IEEE Transactions on Visualization and Computer Graphics, Vol.17, No.3, 2011, pp.320-332. C. D. Lau, M. J. Levesque, S. Chien, S. Date and J. H. Haga, “ViewDock TDW: high-throughput visualization of virtual screening results,” Bioinformatics, Vol.26, No.15, 2010, pp.1915-1917. “UCSF: Chimera,” http://www.cgl.ucsf.edu/chimera
Yuki Fujiwara He received his B.E. from Osaka University in 2010. From 2010, he is a Graduate Student of the Graduate School of Information Science and Technology, Osaka University and works around research topics related to large-scale visualization and wide-area distributed computing.
Susumu Date He received his B.E., M.E., and Ph.D. from Osaka University in 1997, 2000, and 2002, respectively. He was an Assistant Professor at the Graduate School of Information Science and Technology, Osaka University from 2002 to 2005. He also worked as a Visiting Scholar in University of California, San Diego in 2005. He worked as a Specially-appointed Associate Professor for the Internationalization of Education in the Graduate School of Information Science and Technology, Osaka University through the MEXT-funded educational program from 2005 to 2008. From 2008 he is working as an Associate Professor of the Cybermedia Center at Osaka University. His current research interests include Cloud and Grid computing and related information technologies. He is a member of IEEE and IPSJ.
593
A Multi-Application Controller for SAGE-enabled Tiled Display Wall in ~
Kohei Ichikawa He received his B.E., M.E., and Ph.D. from Osaka University in 2003, 2005, and 2008, respectively. He worked as a Visiting Scholar in University of California, San Diego from 2005 to 2006. He was a postdoctoral fellow at the Research Center of Socionetwork Strategies, Kansai University from 2008 to 2009. From 2009 he is working as an Assistant Professor at the Central Office for Information Infrastructure, Osaka University. His current research interests include Cloud and Grid computing and related information technologies. He is a member of IEEE and IPSJ.
Haruo Takemura He received his B.E., M.E., and Ph.D. degrees from Osaka University in 1982 1984 and 1987 respectively. In 1987, he joined the Advanced Telecommunication Research Institute, International. In 1994, he joined the Nara Institute of Science and Technology, Nara as an Associate Professor at Graduate school of Information Science and Technology. From 1998 to 1999, he was a visiting Associate Professor at the University of Toronto, Ontario, Canada. In 2001, he became a full Professor at the Cybermedia Center, Osaka University, Osaka, Japan. In 2005, he became a vice-director of the Cybermedia Center. Since August 2007, he has served as a director of the same center. His research interests include Interactive Computer Graphics, Human-Computer Interaction and Mixed Reality. He is a member of IEICE, IPSJ, VRSJ, HIS, IEEE and ACM.
594