A Neural Network-Based Monoscopic Reconstruction Algorithm for H.E.S.S. II
arXiv:1509.00794v1 [astro-ph.IM] 2 Sep 2015
Thomas Murach∗ Humboldt-Universität zu Berlin E-mail:
[email protected]
Michael Gajdus Humboldt-Universität zu Berlin E-mail:
[email protected]
Robert Daniel Parsons Max-Planck-Institut für Kernphysik E-mail:
[email protected] The H.E.S.S. experiment entered its phase II with the addition of a new, large telescope named CT 5 that was added to the centre of the existing array of four smaller telescopes. The new telescope is able to detect fainter air showers due to its larger mirror area, thereby lowering the energy threshold of the array from a few hundred GeV down to O(50 GeV). Due to the power-law decrease of typical γ-ray and cosmic-ray spectra of astrophysical sources a majority of detected air showers are of low energies, thus being detected by CT 5 only, which motivates the need for a reconstruction algorithm based on information from CT 5 alone. By exploiting such monoscopic events the H.E.S.S. experiment in phase II becomes sensitive in an energy range not covered by H.E.S.S. I and in which the Fermi LAT runs out of statistics. Furthermore the chance of detecting transient phenomena like γ-ray bursts is increased significantly due to the large effective area of CT 5 at low energies. In this contribution a newly developed reconstruction algorithm for monoscopic events based on neural networks is presented. This algorithm uses multilayer perceptrons to reconstruct the direction and energy of the particle initiating the air shower and also to discriminate between gamma rays and hadrons. The performance of this algorithm is evaluated and compared to other existing reconstruction algorithms. Furthermore results of first applications of the algorithm to measured data are shown.
The 34th International Cosmic Ray Conference, 30 July- 6 August, 2015 The Hague, The Netherlands ∗ Speaker.
c Copyright owned by the author(s) under the terms of the Creative Commons Attribution-NonCommercial-ShareAlike Licence.
http://pos.sissa.it/
Thomas Murach
Monoscopic Reconstruction for H.E.S.S. II
1. Introduction Ground-based very high energy (VHE, ∼ 30 GeV - 100 TeV) γ-ray experiments have established a new astronomical field over the last 20 years, with more than 100 sources discovered already [1]. Current imaging atmospheric Cherenkov telescope (IACT) experiments like MAGIC, VERITAS and H.E.S.S. are able to detect the faint Cherenkov light emitted in extended air showers induced by VHE particles interacting with nuclei in the Earth’s atmosphere. The H.E.S.S. experiment [2] entered its phase II in 2012 with the addition of a fifth telescope named CT 5 to the centre of the existing array of four 12 m telescopes. This new telescope is the largest of its kind, with a mirror area of 600 m2 , able to detect air showers from low-energy particles. Therefore the lower end of the observable energy range can be decreased to O(50 GeV), compared to a few hundred GeV in case of the H.E.S.S. I array. Due to the power-law decrease of the number of incident particles as a function of their energy a majority of all events will be detected by CT 5 only. A newly developed reconstruction chain called MonoReco, implementing a full event reconstruction using information from CT 5 only, is presented here. It is the first monoscopic reconstruction algorithm based on multivariate analysis techniques used within the H.E.S.S. experiment.
2. MonoReco - A Monoscopic Reconstruction Algorithm Several classes of astrophysical objects are able to accelerate charged particles up to VHEs. Those particles, mainly protons, heavier nuclei, electrons and positrons, are deflected by interstellar and intergalactic magnetic fields. Thus, in the energy range accessible to IACTs, they are isotropised on their way to Earth. To be able to study the acceleration processes occurring in individual sources γ rays produced by those charged particles through e.g. inverse Compton scattering or π 0 decay can be analysed. For a typical source the number of γ rays detected by IACTs is lower than the number of detected hadrons by a factor of O(1000). Therefore it is important to efficiently distinguish between those particle classes as well as to reconstruct the particles’ energies and incident directions. Most reconstruction concepts depend heavily on stereoscopy, i.e. information from at least two telescopes, to be able to reconstruct all of the main properties of the primary particles like their direction and energy as well as the type of particle. This is no longer possible for low-energy showers that are only seen with CT 5. In order to extend the energy range accessible to H.E.S.S. towards the regime in which the Fermi Large Area Telescope (LAT) [3] operates (. 100 GeV) it is necessary to analyse monoscopic events. Such a low-energy analysis is especially needed in the case of transient events like γ-ray bursts or flaring activity from active galactic nuclei because of the ∼ 104 times larger effective area of CT 5 with respect to the effective area of the Fermi LAT. The reconstruction chain presented here is capable of performing a full event reconstruction. It makes use of the so-called Hillas parameters [4], the moments of the distribution of the measured intensities in the individual pixels of the camera of CT 5, and multivariate analysis techniques to determine all relevant properties of the incident particle. Before multivariate analysis techniques are applied, several preprocessing steps are performed. Noise is removed from the images by requiring two neighbouring pixels to contain minimal intensities of 5 and 10 photo electrons (p.e.) or vice versa. After this image cleaning has been performed, 2
Thomas Murach
Monoscopic Reconstruction for H.E.S.S. II
Cut parameter
std
loose
extraloose
Number of pixels Intensity Nominal distance ζ Θ
>3 > 60 p.e. < 1.15◦ > 0.9 0.13◦
>3 > 60 p.e. < 1.15◦ > 0.78 0.14◦
>3 > 35 p.e. < 1.15◦ > 0.55 0.23◦
Table 1: Cut values used in the three different cut configurations introduced in the main text.
several cuts are applied to guarantee a sufficient intensity and number of pixels. Also the nominal distance, i.e. the angular distance of the center of gravity (c.o.g.) of the Hillas ellipse from the centre of the camera, is cut on to make sure the image is not truncated at the camera edges. The cut values are summarised in Tab. (1) for several cut configurations. In each of the three main analysis steps neural networks are used to determine properties of the primary particles. The implementation of multilayer perceptrons (MLPs) within the TMVA framework [5] was used in this analysis. Before such neural networks can be used in an analysis they have to be trained. In the reconstruction chain presented here γ-ray Monte Carlo simulations were used in the training stage. In general the shape of a γ-ray air shower image in the focal plane of the telescope mirror is elliptical. For geometrical reasons the direction of the initial particle is a point assumed to be located along the major axis of the ellipse which is parameterised as a Hillas ellipse. Based on this assumption the direction is reconstructed using the c.o.g. together with a displacement value δ calculated as the distance between the c.o.g. and the direction to be reconstructed. When analysing data δ is retrieved from the previously trained MLP networks working in regression mode based on the following input parameters: the width and length of the Hillas ellipse, the total intensity divided by the area of the Hillas ellipse (called density), the logarithm of the image amplitude, the skewness and the kurtosis of the intensity distribution in the camera. As only the absolute value of δ can be retrieved from the MLP network it is unclear in which direction along the major axis of the ellipse the δ value has to be applied. This degeneracy can be resolved by using the asymmetry of the intensity distribution in the camera parameterised by the skewness. The reconstruction of the energy of the initial γ ray is also based on MLP networks working in regression mode using the same input variables as the MLP networks mentioned above. Finally the type of the primary particle has to be determined. In order to accomplish this task an MLP network operating in classification mode is used. The MLP network is provided with a set of variables (the width and length of the Hillas ellipse, the density, the skewness and kurtosis as well as the length over the logarithm of the intensity) from Monte Carlo simulations in case of γ rays and with parameters taken from so-called OFF runs, i.e. observations of regions of the sky containing no known sources of γ rays, in case of background events. Based on such input events of known signal or background class the MLP network is able to construct a function which calculates an output parameter ζ based on the set of input variables. This value is used to perform a cut in order to discriminate between γ rays and hadrons. The definition of the cut value is subject to an optimisation procedure. Several science cases differing in the assumed spectral index of γ-ray 3
Thomas Murach
Monoscopic Reconstruction for H.E.S.S. II
differential energy spectra were accounted for by the definition of several cut sets. A std cut set is defined such that the Q factor, defined as the signal efficiency divided by the square root of the background efficiency, of a source with a spectral index of −2 is maximal by adjusting the cut on ζ and the radius of the signal region Θ accordingly. A loose cut set is defined similarly but using an index of −3. An extraloose cut set designed for pulsar analyses is defined to obtain maximal effective areas at low energies. Cut values for ζ and Θ are given in Tab. (1). All neural networks used in this reconstruction chain were trained for several observation conditions, differing in zenith angle, azimuth angle and source offset from the centre of the camera. In analyses of real data the MLP networks trained for simulated positions adjacent to the real observation position are used to perform an interpolation.
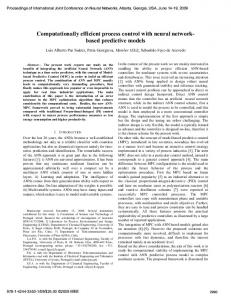
3. Performance of the Reconstruction Chain In the following the performance of the reconstruction chain will be evaluated. All events which have triggered CT 5 were analysed regardless of the trigger information of other telescopes in order to demonstrate the performance over the entire coverable energy range. For example when performing split observations with only CT 5 observing one source events at all energies need to be reconstructed monoscopically. 3.1 Direction Reconstruction Performance The direction reconstruction performance can be studied by means of an angular resolution distribution as presented in Fig. (1a) for three different zenith angles. In this figure the 68 % containment radius R68 of the distribution of reconstructed directions around the direction of the simulated γ rays is shown as a function of their simulated energy. The angular resolution at low energies is ∼ 0.3◦ and improves with increasing energy as the shower images become brighter to reach a minimum of ∼ 0.1◦ , roughly comparable to values achieved by the more advanced ImPACT analysis, which uses a template likelihood fit to determine γ-ray properties [6], [7]. Towards highest energies the angular resolution worsens as the shower images become so large that some images are cropped at the camera edges. In general this leads to poorer event reconstruction. 3.2 Energy Reconstruction Performance The quality of the energy reconstruction can be quantified by the energy reconstruction bias and resolution. The bias is the mean and the resolution is the RMS of the distribution of the relative deviation of the reconstructed energies from the true energy as a function of the true energy. Both quantities can, by definition, only be calculated from Monte Carlo data. The bias curves corresponding to three different zenith angles are displayed in Fig. (1b). In all cases the bias is smaller than 10 % at energies up to ∼ 5 TeV. At low energies the bias is positive because only γ-ray air showers whose recorded intensities fluctuated upwards can be detected. Energy resolution curves are shown in Fig. (1c). At the lowest energies all shower images look approximately the same, thus the reconstructed energies are very similar leading to a small resolution at lowest energies. At higher energies the resolution stays almost constant around 20 30 %. All values are very similar to the performance of the ImPACT analysis. 4
Thomas Murach
0.8
Energy Bias
R68 / [°]
Monoscopic Reconstruction for H.E.S.S. II
20° zenith 40° zenith 55° zenith
20° zenith 40° zenith 55° zenith
0.6 0.4 0.2 0 -0.2 -0.4
10-1 -1.5
-0.6 -1
-0.5
0
0.5
1
1.5 2 log (E 10
True
-0.8 -1.5
2.5 3 / [TeV])
-0.5
0
0.5
1 log (E 10
True
1.5 /TeV)
(b) Energy bias Aeff / [m2]
(a) Angular resolution Energy Resolution
-1
20° zenith 40° zenith 55° zenith
0.7 0.6
105 104
0.5 103
0.4
102
0.3 0.2
1
0.1 0 -1.5
20° zenith 40° zenith 55° zenith
10
-1
-0.5
0
0.5
1 log (E 10
True
-1
10
1.5 /TeV)
(c) Energy resolution
10-2
10-1
1
10
102 ETrue / [TeV]
(d) Effective area
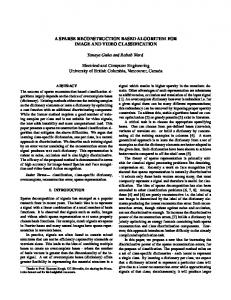
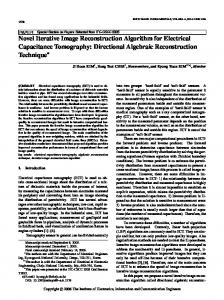
Figure 1: Instrument response functions corresponding to several zenith angles are shown in the above figures as functions of the true energy ETrue . An azimuth angle of 0◦ and a wobble offset of 0.5◦ was used to produce all curves. The displayed response functions are (a) the 68 % containment radius R68 , (b) the energy bias, (c) the energy resolution and (d) the effective area. 3.3 Effective Area The effective area is defined as the γ-ray detection efficiency multiplied by the area corresponding to the maximum impact distance of the simulated air shower axes with respect to the telescope (500 m at 20◦ zenith). Effective areas as a function of the true energy for three different zenith angles are shown in Fig. (1d). At the lowest energies the detection efficiency is very low. As the showers get brighter and more regular with increasing energy the efficiency increases until a maximum is reached. At the highest energies the efficiency begins to drop because the showers tend to get cropped at the camera edges leading to a worse classification performance. The maximum value of the effective areas increases with the zenith angle due to projection effects. 3.4 Sensitivity The lowest point-source flux that can be detected with a significance of 5σ within 50 h of observations in an energy interval is called differential sensitivity. This quantity expressed in units of the differential Crab nebula flux is shown in Fig. (2) as a function of the reconstructed energy. p The significances were estimated as Nγ / NBkg , with Nγ being the number of excess events and NBkg being the exposure-corrected number of background events. The lowest detectable flux value 5
Thomas Murach
Sensitivity [Crab]
Monoscopic Reconstruction for H.E.S.S. II
MonoReco Std Model++ Mono Std
1
H.E.S.S. Preliminary
10-1
-1.5
-1
-0.5
0
0.5 1 log (Erec / [TeV]) 10
Figure 2: Differential sensitivities obtained by the MonoReco (black) and Model++ (red, [8]) analyses in units of the differential Crab Nebula flux as a function of the reconstructed energy Erec . The curves correspond to a zenith angle of 20◦ , an azimuth angle of 180◦ and a wobble offset of 0.5◦ . per energy bin at a zenith angle of 20◦ corresponds to 4 % of the Crab Nebula flux. More advanced reconstruction chains like ImPACT or Model++ [8], [9] reach values of ∼ 3 %, as shown in Fig. (2).
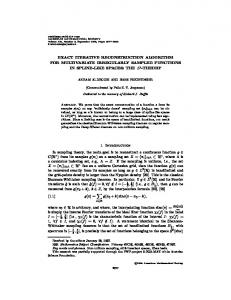
4. Analysis of Crab Nebula Data The reconstruction chain presented in the previous sections was applied to data from observations of the Crab Nebula. In total 16 observation intervals lasting 28 min each were analysed, resulting in a live time of 7.2 h. The observations were performed with a wobble offset of 0.5◦ from the camera centre at a mean zenith angle of 47◦ . Using the reflected background method [10] 4800 excess events were measured in the ON region with respect to the number of events detected in OFF regions. This corresponds to a significance of 91σ using Eq. (17) from Li & Ma [11]. The Θ2 distributions shown on the left hand side of Fig. (3) visualise the distributions of the squared angular distances of the reconstructed shower directions from the centres of the corresponding ON and OFF regions. It can be seen that there is an excess towards the position of the Crab Nebula whereas there is none towards the test positions in the OFF regions. Significances can also be calculated from any position in the sky using the ring background method [10]. The resulting significance map is shown on the right hand side of Fig. (3). It can be seen that there are no artefacts visible in the field of view and that the source is point-like and centred on the position determined from radio measurements conducted with the VLBI [12]. At zenith angles around 45◦ the safe energy threshold is approximately 150 GeV, compared to a threshold of ∼ 300 GeV in case of H.E.S.S. I. The threshold is defined as the energy at which the effective area reaches 10 % of its maximum value. This definition does not take the shape of the energy bias or energy resolution curves into account, thus the bias could, in principle, be arbitrarily 6
Declination
dN/dΘ2 / [1/°2]
4500 4000 3500 3000 2500 2000 1500 1000 500 0 0
7.2 live hours ON=5940 OFF=11248 (α=0.10) 4823.0 γ , σ=92.4 11.15 γ /mn, S/B=4.32
24°00' 23°00' 22°00' 21°00'
H.E.S.S. Preliminary
H.E.S.S. Preliminary
20°00'
0.1
0.2
0.3
0.4 0.5 2 Θ / [°2]
90 80 70 60 50 40 30 20 10 0
Significance / [σ]
Thomas Murach
Monoscopic Reconstruction for H.E.S.S. II
05h40m 05h35m 05h30m Right Ascension
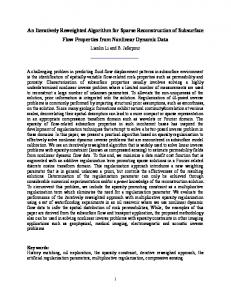
Figure 3: Left: Squared angular distance of the reconstructed directions to the test positions in the centre of the ON (black) and OFF (red) regions. Right: Sky map. large. Therefore a forward-folding technique was used to derive a differential energy spectrum. The resulting spectrum is shown in Fig. (4) together with the spectrum published by the MAGIC collaboration [13]. The spectral points are well-fit by a log-parabolic function. The fit parameters are given in the inset. The reference energy is 0.27 TeV. The spectrum is compatible with the result obtained by the MAGIC collaboration within systematic uncertainties.
5. Summary and Outlook A new method of reconstructing the main properties of VHE γ rays has been presented. The performance of the different parts of this reconstruction chain is competitive to other reconstruction concepts as discussed above. A big advantage of this chain is the speed with which events can be analysed. On average only 0.8 s of CPU time are required to analyse 5000 events, compared to approximately 20 s in the case of ImPACT. This makes the chain well-suited for an analysis of newly taken data on site in Namibia shortly after observations have been performed, enabling the H.E.S.S. collaboration to check for flux variability in the observed sources. Based on this, decisions can be made whether to continue observing certain sources during the following nights. It will always be important to have a monoscopic reconstruction chain available with which the entire energy range accessible to H.E.S.S. can be analysed, for example for split observation campaigns with only CT 5 observing a source. Still it is desirable to combine both monoscopic and stereoscopic reconstruction algorithms into one combined analysis, making it possible to decide on an event-by-event basis whether a monoscopic or a stereoscopic reconstruction algorithm should be used. Such an improvement will be provided in the near future.
References [1] Online Gamma-Ray Catalog, http://tevcat.uchicago.edu/ [2] The H.E.S.S. Collaboration, http://www.mpi-hd.mpg.de/hfm/HESS/
7
Thomas Murach
dN/dE [cm-2.s-1.TeV-1]
Monoscopic Reconstruction for H.E.S.S. II
10-8
Crab Minimization summary for LogParabolic : φ = (6.079 +/- 0.145) 10
-9
10
0
-10
cm-2.s-1.TeV -1
α = (1.695 +/- 0.050) β = (0.269 +/- 0.024)
10-10
Φ (1 TeV) = (4.326 +/- 0.102) 10-11 cm-2.s-1.TeV -1 E Dec = 0.397 TeV
10-11
-10
Φ (0.397 TeV) = (3.137 +/- 0.061) 10
cm-2.s-1.TeV -1
10-12 10-13 10-14 10-15 10-16
H.E.S.S. Preliminary
(nexp-nth)/n
th
10-17 10 5 0 -5 -10
0.2
0.3 0.4
1
2
3
4 5 6 7 8 910
20
30 40
Energy [TeV]
Figure 4: Reconstructed differential energy spectrum of the Crab Nebula as a function of the true energy. The purple line represents the Crab spectrum published by the MAGIC collaboration [13]. [3] The Fermi Large Area Telescope, http://www-glast.stanford.edu/ [4] A. M. Hillas. Cerenkov light images of EAS produced by primary gamma. International Cosmic Ray Conference. 3:445–448, 1985 [5] A. Hoecker et al. TMVA: Toolkit for Multivariate Data Analysis. PoS, ACAT:040, 2007 [6] R.D. Parsons and J. Hinton. A Monte Carlo Template based analysis for Air-Cherenkov Arrays, arXiv:1403.2993 [astro-ph.IM] [7] R.D. Parsons, M. Gajdus and T. Murach. HESS II Data Analysis with ImPACT, Proceedings of the 34th International Cosmic Ray Conference, 2015 [8] M. Holler et al. Photon Reconstruction for H.E.S.S. Using a Semi-Analytical Shower Model, Proceedings of the 34th International Cosmic Ray Conference, 2015 [9] M. de Naurois and L. Rolland. A high performance likelihood reconstruction of γ-rays for imaging atmospheric Cherenkov telescopes, Astroparticle Physics, 32:231-252, 2009 [10] D. Berge, S. Funk and J. Hinton. Background Modelling in Very-High-Energy gamma-ray Astronomy, arXiv:astro-ph/0610959 [11] T.-P. Li and Y.-Q. Ma. Analysis methods for results in gamma-ray astronomy. Astrophysical Journal, 272:317–324, September 1983. doi: 10.1086/161295. [12] A. P. Lobanov, D. Horns and T. W. B. Muxlow. VLBI imaging of a flare in the Crab nebula: more than just a spot, http://cdsbib.u-strasbg.fr/cgi-bin/cdsbib?2011A&A...533A..10L [13] R. Zanin et al., arXiv:1406.6892 [astro-ph.HE]
8