A NEW BAYESIAN DESIGN METHOD FOR SUPPORT VECTOR CLASSIFICATION Wei Chu, S. Sathiya Keerthi, Chong Jin Ong Control Division, Department of Mechanical Engineering, National University of Singapore 10 Kent Ridge Crescent, Singapore, 119260
[email protected],
[email protected],
[email protected] ABSTRACT In this paper, we apply popular Bayesian techniques on support vector classifier. We propose a novel differentiable loss function called trigonometric loss function with the desirable characteristic of natural normalization in the likelihood function, and then follow standard Gaussian processes techniques to set up a Bayesian framework. In this framework, Bayesian inference is used to implement model adaptation, while keeping the merits of support vector classifier, such as sparseness and convex programming. Moreover, we put forward class probability in making predictions. Experimental results on benchmark data sets indicate the usefulness of this approach. 1. INTRODUCTION As a computationally powerful class of supervised learning networks, classical support vector classifier (SVC) exploits the idea of mapping the input data into a high dimensional (often infinite) Hilbert space defined by a reproducing kernel (RKHS), where a linear classification is performed. The discriminant function is constructed by solving a regularized functional via convex quadratic programming. The choice of the regularization parameter and the other kernel parameters in the SVC model crucially affect the generalization performance. Model selection is usually based on the criterion of some simple and pertinent performance measures, such as cross validation or various generalization bounds derived from statistical learning theory. Typically, Bayesian methods are regarded as suitable tools to determine the values of these parameters. Moreover, Bayesian methods can also provide probabilistic class prediction that is more desirable than just deterministic classification. There is some literature on Bayesian interpretations of classical SVC. Kwok [3] built up MacKay’s evidence framework [4] using a weight-space interpretation. The unnormalized evidence may cause inaccuracy in Bayesian inference. Sollich [6] pointed out that the normalization issue in Wei Chu gratefully acknowledges the financial support provided by the National University of Singapore through Research Scholarship.
Bayesian framework for classical SVC is critical and proposed an intricate Bayesian treatment with normalized evidence and error bar, where the evidence normalization depends on an unknown input distribution that limits its usefulness in practice. In this paper, we introduce a novel loss function for SVC, called the trigonometric loss function, with the purpose of integrating Bayesian inference with SVC smoothly while preserving their individual merits. The trigonometric loss function is smooth and naturally normalized in likelihood evaluation. Further, it possesses the desirable property of sparseness in sample selection. We follow standard Gaussian processes for classification [7] to set up a Bayesian framework. Maximum a posteriori (MAP) estimate of the latent functions results in a convex programming problem. The popular sequential minimal optimization algorithms could be easily adapted to find the solution. Optimal parameters can then be inferred by Bayesian techniques with the benefit of sparseness, and probabilistic class prediction can also be provided for test patterns. 2. TRIGONOMETRIC LOSS FUNCTION In the probabilistic approach for binary classification, logistic function is widely used as an approximation for the discontinuous heaviside step function in likelihood evaluation [7]. The logistic function is defined as P(yx |fx ) =
1 1 + exp(−yx · fx )
(1)
where the input vector x ∈ +1. These training samples are not involved in the Bayesian inference computations. The simplification of computational burden is usually referred to as the sparseness property. Logistic function (1) does not enjoy this property since it contributes a positive penalty to all the training samples. On the other hand, logistic function is attractive because it is naturally normalized in likelihood evaluation, i.e., the normalizer is a constant, a property that allows Bayesian techniques to be used smoothly. Based on these observations, we generalize the desirable characteristics in these loss functions for classification: it should be naturally normalized in likelihood evaluation; it should possess a flat zero region that results in sparseness property; it should be smooth and its first order derivative should be explicit and simple. Adhering to these requirements, we propose a novel loss function for binary classification, known as trigonometric loss function. The trigonometric loss function is defined as +∞ if δ ∈ (−∞, −1]; 2 ln sec( π4 (1 − δ)) if δ ∈ (−1, +1); `t (δ) = 0 if δ ∈ [+1, +∞), (4) where δ = yx · fx . The trigonometric likelihood function is therefore written as 0 if δ ∈ (−∞, −1]; cos2 ( π4 (1 − δ)) if δ ∈ (−1, +1); Pt (yx |fx ) = 1 if δ ∈ [+1, +∞). (5) The derivatives of the loss function are needed in the implementation of Bayesian methods. The first order derivative of (4) with respect to fx can be derived as ½ ∂`t (δ) −yx π2 tan( π4 (1 − δ)) if δ ∈ (−1, +1); = 0 if δ ∈ [+1, +∞), ∂fx and the second order derivative is ½ π2 2 π ∂ 2 `t (δ) 8 sec ( 4 (1 − δ)) = 2 0 ∂fx
if if
δ ∈ (−1, +1); δ ∈ [+1, +∞). (6)
Trigonometric Loss Function 10
1 8
0.8
6
0.6 0.4
4
0.2
2
0 −1.5
0 −1
−0.5
0 fx
0.5
1
1.5
−1.5
−1
−0.5
0 fx
0.5
1
1.5
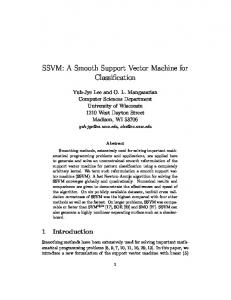
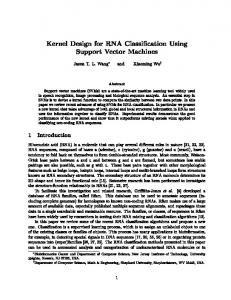
Figure 1: The graphs of trigonometric likelihood function and its loss function. The horizontal axis indicates the latent function fx of the input vector x.
From the definition (5) and Figure 1, it is easy to see that the normalizer ν(fx ) is a constant for any fx . From the definition (4) and Figure 1, we find that the trigonometric loss function possesses a flat zero region that is same as the loss functions in classical SVC, but it requires that yx · fx > −1 should always hold. 3. BAYESIAN INFERENCE Substituting the trigonometric loss function for the loss function in classical SVC, the trigonometric SVC (TSVC) minimizes the following regularized functional in a RKHS min R(f ) =
f ∈RKHS
n X
`t (yxi · fxi ) + λkf k2RKHS ,
(7)
i=1
where the regularization parameter λ is positive and kf k2RKHS is a norm in the RKHS. The function f could be also explained as a family of random variables in a Gaussian process due to the duality between RKHS and stochastic processes. Recently, Gaussian processes have provided a promising non-parametric Bayesian approach to classification problems [7]. The important advantage of Gaussian process models over other non-Bayesian models is the explicit probabilistic formulation. This not only builds the ability to infer model parameters in Bayesian framework but also provides probabilistic class prediction. 3.1. Bayesian Framework We follow the standard Gaussian process classifier to describe a Bayesian framework, in which we impose a Gaussian process prior distribution on the latent functions and employ the trigonometric loss function in likelihood evaluation. This classifier, TSVC in the Bayesian framework, is referred to as Bayesian TSVC (BTSVC). The functions f are usually assumed as the realizations of random variables indexed by the input vector xi in a stationary zero-mean
Gaussian stochastic process. The Gaussian process can then be specified by giving covariance matrix for any finite set of zero-mean random variables {f (xi )|i = 1, 2, . . . , n}. The covariance between the outputs corresponding to the inputs xi and xj could be defined as µ ¶ 1 2 Cov(xi , xj ) = κ0 exp − κkxi − xj k + κb , (8) 2 where κ0 > 0 and κ > 0.1 With ARD parameters, Gaussian covariance function could be enhanced as à ! d 1X Cov(xi , xj ) = κ0 exp − κι (xιi − xιj )2 + κb , (9) 2 ι=1 where xι denotes the ι-th entry of the input vector x, and κι is the ARD parameter and it determines the relevance of the ι-th input dimension to the target. We collect the parameters in the prior distribution, as θ, the hyperparameter vector. Thus, for a given hyperparameter vector θ, the prior probability of the random variables {f (xi )} is a multivariate Gaussian, which can be written as P(f |θ) =
¡ 1 ¢ 1 exp − f T Σ−1 f , Zf 2
n Y
Pt (yxi |f (xi )).
n ³π ´ X 1 ln sec ξi min f T Σ−1 f + 2 f,ξ 2 4 i=1
(11)
Based on Bayes’ theorem, the posterior probability of f can then be written as 1 exp (−S(f )) , (12) ZS Pn where S(f ) = 12 f T Σ−1 f + Ri=1 `t (yxi · f (xi )), `t (·) is defined as in (4), and ZS = exp(−S(f )) df . Since P(f |D, θ) ∝ exp(−S(f )), the MAP estimate on the values of f is therefore the minimizer of the following optimization problem P(f |D, θ) =
n
(14)
subject to yxi · f (xi ) ≥ 1 − ξi and 0 ≤ ξi < 2, ∀i. Standard Lagrangian techniques are used to derive the dual problem. The strict inequality ξi < 2 is assumed to hold and omitted. As we will see below, this condition will be implicitly taken into account in the solution. Let αi ≥ 0 and γi ≥ 0 be the corresponding Lagrange multipliers for other inequalities in the primal problem (14). The KKT conditions for the primal problem (14) require
(10)
i=1
X 1 min S(f ) = f T Σ−1 f + `t (yxi · f (xi )). f 2 i=1
In this subsection, we formulate the optimization problem (13) as a convex programming problem. As usual, slack variables ξi are introduced: ξi ≥ 1 − yxi · f (xi ), ∀i. The optimization problem (13) can then be restated as the following equivalent optimization problem, which we refer to as the primal problem:
f (xi ) =
where f = [f (x1 ), f (x2 ), . . . , f (xn )]T , Σ is the n × n covariance matrix whose ij-th element is Cov(xi , xj ), and n 1 Zf = (2π) 2 |Σ| 2 . The likelihood with the trigonometric likelihood function (5) can be written as P(D|f, θ) =
3.2. Convex Programming
n X
yxj αj Cov(xi , xj )
∀i;
(15)
∀i.
(16)
j=1
4 ξi = arctan π
µ
¶ 2 (αi + γi ) π
Note that with ξi defined as in (16), the condition ξi < 2 is automatically taken into account. The dual problem can be finally written as n n n X 1 XX (yxi αi )(yxj αj )Cov(xi , xj ) − αi α 2 i=1 j=1 i=1 Ã " µ ¶ µ ¶2 !# n X 2αi 2αi 4 αi arctan − ln 1 + + π π π i=1 (17) subject to αi ≥ 0, ∀i. The popular sequential minimal optimization algorithm for classical SVC [2] can be easily adapted to solve the optimization problem. Other methods for solving convex programming problems, such as dual subgradient schemes, can also be used for the solution. At the optimal solution to (17), the MAP estimate on the values of the random variables f can be written in column vector form
min
(13)
In the regularized functional, κ0 in covariance matrix plays the role as the regularization parameter.2 1 Note that the exponential term in (8) is exactly the Gaussian kernel in classical SVC. Other kernel functions in classical SVC could also be used in the covariance function, such as the polynomial and spline kernel function. 2 Note that there is an equivalence between the regularized functional (13) and that of TSVC in the RKHS (7).
fMP = Σ · w
(18)
where w = [yx1 α1 , yx2 α2 , . . . , yxn αn ]T . The training samples (xi , yxi ) associated with non-zero Lagrange multiplier αi are called support vectors (SVs). The other samples associated with zero αi do not involve in the solution representation and the following Bayesian computation. This property is usually referred to as sparseness, and it reduces the computational cost significantly.
3.3. Hyperparameter Inference The optimal values of hyperparameters θ can be inferred by maximizing the posterior probability P(θ|D), using P(θ|D) = P(D|θ)P(θ)/P(D). A prior distribution on the hyperparameters P(θ) is required here. As we typically have little idea about the suitable values of θ before training data are available, we assume a flat distribution for P(θ), i.e., P(θ) is greatly insensitive to the values of θ. Therefore, P(D|θ), known as the evidence of θ, can be used to assign a preference to alternative values of the hyperparameters θ [4]. The evidence could be calculated by an explicit formula after using a Laplacian approximation at fMP , and then hyperparameter inference may be done by gradient-based optimization methods. R We can get the evidence by an integral over all f : P(D|θ) = P(D|θ, f )P(f |θ) df . Using the definitions in (10) and (11), the evidence can also be written as Z 1 P(D|θ) = exp(−S(f )) df. (19) Zf The marginalization can be done analytically by considering the Taylor expansion of S(f ) around its minimum S(fMP ), and retaining terms up to the second order. Since the first order derivative with respect to f at the most probable point fMP is zero, S(f ) can be written as ¯ 1 ∂ 2 S(f ) ¯¯ S(f ) ≈ S(fMP )+ (f −fMP )T (f −fMP ), 2 ∂f ∂f T ¯f =fMP (20) ∂ 2 S(f ) −1 where ∂f ∂f T = Σ + Λ, and Λ is a diagonal matrix coming from the second order derivative of trigonometric loss function (6). Introducing (20) into (19) yields P(D|θ) = 1 exp(−S(fMP )) · |I + Σ · Λ|− 2 , where I is the identity matrix. Notice that only a sub-matrix of Σ plays a role in the determinant |I + Σ · Λ| due to the sparseness of the diagonal matrix Λ in which only the entries associated with SVs are non-zero. We denote their sub-matrices as ΣM and ΛM respectively by keeping their non-zero entries. From (18), we can write the MAP estimate of f in vector form as fMP = Σ · w, where w = [yx1 α1 , yx2 α2 , . . . , yxn αn ]T . We denote wM as the sub-vector of w by keeping entries associated with SVs. Because of these sparseness properties, the negative log of the evidence can then be simplified as ³π ´ X 1 T · ΣM · w M + 2 ln sec ξm − ln P(D|θ) = wM 2 4 m∈SVs 1 + ln |I + ΣM · ΛM |, 2 (21) where ξm = 1 − yxm · fMP (xm ), ∀m. The evidence evaluation is a convenient yardstick for model selection. The minimizer of − ln P(D|θ) (21) could be inferred by some gradient-based optimization methods, since it is easy to derive the gradient with respect to θ. In standard Gaussian
processes for classification [7], the inversion of the full matrix Σ has to be computed in iterative mode. This is a heavy burden for large-scale learning tasks. In our approach, only the inversion of the sub-matrix ΣM , corresponding to the SVs, is required in the gradient evaluation. This sparseness in gradient evaluation makes it possible for our approach to tackle reasonably large data sets with thousands of samples, as the SVs are usually a small subset of the training samples.
4. PROBABILISTIC CLASS PREDICTION In this section, we present the probabilistic class prediction on test patterns. This ability to provide the class probability is one of the important advantages of our probabilistic approach over the usual deterministic approach. Let us take a test case x for which the class label yx is unknown. The random variable f (x) index by x along with the n zero-mean random variables f have a joint n + 1 multivariate Gaussian distribution, and then the conditional distribution of f (x) given f is also a Gaussian µ ¶ 1 (f (x) − f T Σ−1 k) P(f (x)|f, D, θ) ∝ exp − 2 Cov(x, x) − kT Σ−1 k (22) where k = [ Cov(x, x1 ), . . . , Cov(x, xn ) ]T . To erase the uncertainty in f , we compute P(f (x)|D, θ) by an integral over f -space. The integral could be approximately evaluated as (see [1] for more details) µ ¶ 1 (f (x) − µ)2 =√ P(f (x)|D, θ) ∼ exp − 2σt2 2πσt (23) −1 with the variance σt2 = Cov(x, x) − kTM (Λ−1 + Σ ) kM M M T and the mean µ = wM kM , where kM is the sub-vector of k by keeping the entries associated with SVs. Now we make probabilistic class prediction. Given the hyperparameters θ, the probability of the binary class label yx for the testing case x can be evaluated as: N (µ, σt2 )
Z P(yx |D, θ) =
P(yx |f (x), D, θ)P(f (x)|D, θ) df (x) ,
where P(yx |f (x), D, θ) is evaluated by trigonometric likelihood function (5) and P(f (x)|D, θ) is given by (23). The one dimensional integral is easy to be computed as: µ ¶ 1 1 − yx µ √ P(yx |D, θ) = erfc 2σt Z +1 2 ³ ´ 2 π + cos (1 − yx f (x)) N (µ, σt2 ) df (x) , 4 −1 (24) R +∞ where erfc(ν) = √2π ν exp(−z 2 ) dz.
Table 1: Training results of BTSVC with Gaussian covariance function (8) on benchmark data sets. Splice∗ denotes the reduced Splice data set. TIME denotes the average CPU time in seconds consumed by Bayesian inference over the first five folds; RATE denotes the test error rate in percent averaged over all folds of that data set; SVC is the RATE of classical SVC with Gaussian kernel reported in [5]. Data Set Banana Breast Diabetis Flare German Heart Image Ringnorm Splice Splice∗ Thyroid Titanic Twonorm Waveform
TIME 8.65±2.78 3.24±0.64 22.43±5.61 85.15±12.26 106.35±26.96 1.23±0.64 71.85±28.45 4.50±1.10 308.22±87.41 42.00±14.64 0.21±0.04 1.29±0.47 1.19±0.35 4.52±2.76
RATE 10.39±0.50 25.70±4.46 23.13±1.75 34.26±1.75 23.37±2.28 16.33±2.78 3.50±0.62 1.99±0.26 12.36±0.72 5.87±0.58 3.95±2.07 22.51±1.01 2.90±0.27 9.94±0.42
SVC 11.53±0.66 26.04±4.74 23.53±1.73 32.43±1.82 23.61±2.07 15.95±3.26 2.96±0.60 1.66±0.12 10.88±0.66 — 4.80±2.19 22.42±1.02 2.96±0.23 9.88±0.43
relevant in the whole 60 dimensions. Thus, we create reduced Splice data sets by keeping the 7 relevant dimensions only. On the reduced data sets, Gaussian covariance kernel can still yields similar performance. It is one of the advantages of Bayesian design over the deterministic approach that large number of hyperparameters can be tuned systematically. 6. CONCLUSION We proposed a Bayesian support vector classifier by introducing trigonometric likelihood function. In the probabilistic framework of stationary Gaussian processes, various computational procedures are provided for the MAP estimate and the evidence of the hyperparameters. Model adaptation and ARD feature selection could be implemented intrinsically in hyperparameter inference. Furthermore, the sparseness reduces the computational cost significantly. Another benefit is the availability of class probabilities in making predictions. The results in numerical experiments verify that the generalization capability is competitive. We will further study the influence from outliers in future work. 7. REFERENCES
5. NUMERICAL EXPERIMENTS In numerical experiments, the initial states of the hyperparameters are chosen as κb = 100.0 and κ = 1/d, where d is the input dimension. The initial value of κ0 is chosen from {0.1, 1, 10, 100}, usually it is 10. The computer we used for these numerical experiments is PIII 866 PC with 384MB RAM and the operating system is Windows 2000.3 We carried out Bayesian inference with Gaussian kernel on the benchmark data sets used by R¨atsch et al. [5].4 We report the training results of BTSVC on these data sets in Table 1. The optimal hyperparameters used throughout the training on all folds of that data set is determined by the average results of Bayesian inference on the first five folds. We choose optimal hyperparameters in this way for a fair comparison with the results of classical SVC reported in [5]. We find that the generalization capability of our Bayesian approach is very competitive. In next series of experiments, we choose the Splice data, which has the highest dimension in these benchmarking data, to carry out ARD feature selection. Bayesian inference with ARD Gaussian kernel (9) yields more preferable evidence and reduces test error rate to 5.29%. From the optimal ARD parameters, we find that only the 28th − 34th input dimensions are significantly 3 The
program we used in the numerical experiments is available at www.guppy.mpe.nus.edu.sg/ mpessk/svm/bisvm.zip. 4 These 100-fold benchmark data sets (only 20 folds available for Image and Splice) and related experimental results can be accessed at http://www.first.gmd.de/∼raetsch/data/benchmarks.htm.
[1] W. Chu, S. S. Keerthi, and C. J. Ong, Bayesian trigonometric support vector classifier. Technical Report, CD-01-16 Dept. of Mechanical Engineering, National University of Singapore, 2001. http://guppy.mpe.nus.edu.sg/∼mpessk/btsvc/btsvc.pdf [2] S. S. Keerthi, S. K. Shevade, C. Bhattacharyya, and K. R. K. Murthy, Improvements to Platt’s SMO algorithm for SVM classifier design, Neural Computation, Vol. 13, 637-649, 2001. [3] J. T. Kwok, The evidence framework applied to support vector machines. IEEE Transactions on Neural Networks , 11(5):1162-1173, 2000. [4] D. J. C. MacKay, A practical Bayesian framework for back propagation networks. Neural Computation, 4(3), 448-472, 1992. [5] G. R¨atsch, T. Onoda, and K.-R. M¨uller, Soft margins for AdaBoost. Machine Learning. 42(3), 287320, 2001. [6] P. Sollich, Bayesian methods for Support Vector Machines: Evidence and predictive class probabilities. Machine learning, 46:21-52, 2002. [7] C. K. I. Williams and D. Barber, Bayesian classification with Gaussian processes. IEEE Transactions on Pattern Analysis and Machine Intelligence 20(12), 1342-1351, 1998.


![A Support Vector Machine Classification Model for Benzo[c] - MDPI](https://m.moam.info/img/260x300/a-support-vector-machine-classification-model-for-_59f7b3ff1723dd71c04fbf69.jpg)