for a condition monitoring, referred to as motor current signature .... A. Bearing Fault Signature. Fig. ..... in electrical and electronics from Lebanese Univer-.
4252
IEEE TRANSACTIONS ON INDUSTRIAL ELECTRONICS, VOL. 55, NO. 12, DECEMBER 2008
A New Bearing Fault Detection Method in Induction Machines Based on Instantaneous Power Factor Ali Ibrahim, Member, IEEE, Mohamed El Badaoui, François Guillet, and Frédéric Bonnardot
Abstract—Fault detection and diagnosis of asynchronous machine has become a central problem in industry over the past decade. A solution to tackle this problem is to use stator current for a condition monitoring, referred to as motor current signature analysis. This paper argues that bearing faults would have a negligible effect on motor currents and instead argues that the more likely reason why the faults can be detected in currents is because they entail a fluctuating resistive torque which acts immediately, in contrast to the radial displacement which takes time to integrate to a perceptible displacement even in response to a step change in velocity. In this context, we propose a new method for detecting bearing defects based on the exploitation of the instantaneous power factor that varies according to torque oscillations. Experimental results show the good performances of the proposed method which will be compared with the instantaneous power method to highlight the feasibility and advantages of this method. Index Terms—Bearings, fault diagnosis, induction machines, signal processing.
I. I NTRODUCTION
T
HE SUGGESTED work is related to the diagnosis of asynchronous machines. The growing of such machines is due to standardization, reliability, and low cost of purchase and maintenance. In fact, it is to be found in all the industrial fields and, particularly, in the growth industries like aeronautics, nuclear power, chemistry, or railway transports. However, the breakdown of one of the constitutive parts of this machine can stop processes and cause losses in terms of time and money. In nuclear industry, for example, it is essential to ensure the safety of people and make sure that no damage occurs. With all things considered, it is clear that these engines lead us to pay more attention to the way they operate and their availability. These reports have naturally led to the implementation of monitoring systems [1], [2], whose objective is to provide favorable operating condition of the various steps of the production process, in asynchronous machine and their loads. The possibility of faults is inherent in converting electrical energy to mechanical energy. Therefore, there has been a substantial amount of research into the creation of new monitoring
Manuscript received February 29, 2008; revised July 14, 2008. First published August 19, 2008; current version published December 2, 2008. This work was supported by the Rhône-Alpes region in France. The authors are with the Laboratoire d’Analyse des Signaux et des Processus Industriels, Academic Institute of Technology of Roanne, Université Jean Monnet de Saint-Etienne, 42334 Roanne, France (e-mail: Ali.Ibrahim@ ieee.org). Color versions of one or more of the figures in this paper are available online at http://ieeexplore.ieee.org. Digital Object Identifier 10.1109/TIE.2008.2003211
techniques for induction motor drives. One of the main maintenance efforts is to detect faults occurring in electrical machinery. Some faults develop slowly, and early detection of these faults is crucial to prevent machine breakdown. The failures of asynchronous machine are divided into various types of faults: broken rotor bars, shorted stator turns, shaft misalignments, load vibrations, torque oscillations, gearbox, and bearing faults. A classification of the most frequently encountered faults can be found in [3] and [4]. Detection and diagnosis techniques for rotor electrical faults are investigated in [5] and [6]. Stator short-circuit monitoring is studied in [7]. Fault detection in a gearbox has been studied in [8]. Approximately 45% of the failures are due to the bearing faults [4], [9], [10]. Sometimes, bearing faults might manifest themselves as rotor asymmetry faults [11], which are usually covered under the category of eccentricity-related faults [12]. Other studies consider that bearing faults induce load torque oscillations [13], and related signatures on stator current are demonstrated in [14]. Different techniques for condition monitoring using neural network can be found in [15] and [16]. A recent work based on frequency response analysis is introduced to detect bearing damages [17], [18]. Motor current signature analysis (MCSA) is one of the most powerful methods of online motor diagnosis for detecting motor faults. The use of MCSA has advantages such as no estimation of motor parameters and the simplicity of current sensors and their installation. Indeed, several electrical signals may contain information about the failure. Moreover, the environmental sensitivity of the sensors can provide unreliable indications. In some situation, such as for electrical submersible pumps, sensor installation is not practical or prohibitively costly. MCSA methods are obtained using only noninvasive sensors such as current and voltage sensors. Important results of previous MCSA researches were reviewed for guiding further studies of MCSA [4], [19]–[21]. Some methods based on high-resolution frequency estimation [22], [23], Wiener filtering and cyclostationarity [24], [25] are used to help the induction machine fault detection and diagnosis. In this paper, we discuss the effect of the bearing faults on the electric quantities, and we prove that the defects at incipient stage affect the electromagnetic torque and, thus, will be transmitted to electrical currents. A new method of diagnosis based on the instantaneous power factor (IPF) is thus introduced. A short overview of single-point defect in ball bearings is first recalled in Section II. A vibratory analysis is presented to highlight the presence of an outer raceway fault, and then, its impact on the machine is discussed. Section III deals the detection of bearing faults through torque
0278-0046/$25.00 © 2008 IEEE
Authorized licensed use limited to: Ali Ibrahim. Downloaded on December 4, 2008 at 10:26 from IEEE Xplore. Restrictions apply.
IBRAHIM et al.: NEW BEARING FAULT DETECTION METHOD IN INDUCTION MACHINES BASED ON IPF
Fig. 1.
Structure and dimensions of a bearing.
or instantaneous frequency analysis. The transmission of bearing fault on stator current is discussed in Section IV; electrical equations of the asynchronous machine will be pointed out to establish the relationships between the currents, the power, and the torque. Finally, the experimental results are presented in Section VI. II. V IBRATION A NALYSIS A. Bearing Fault Signature Fig. 1 shows the typical construction of a ball bearing and defines the dimensional parameters used in this paper. The balls are bound by a cage which ensures a uniform distance between them and prevents any contact. Bearing defects can occur as a result of fatigue of their material under normal operational conditions. First, cracks will appear on the tracks and the balls. Then, pitting and scuffing of material can quickly accelerate the wear of a bearing, and intensive vibrations are generated as a result of the repetitive impacts of the moving components on the defect. For instance, when a rolling element contacts a defect on the inner or outer raceway, it produces an impact which, in turn, excites the structural modes of the bearing and its support [26]. In an operating bearing, a series of impacts occurs with a repetition frequency which depends on whether the defect is on the inner or the outer race, or on the rolling element. Therefore, the overall vibration signal measured on the bearing shows a pattern consisting of a succession of oscillating bursts dominated by the major resonance frequencies of the structure. Rolling element bearings experience some slip of the rolling elements, thus yielding, as a consequence, that the occurrences of the impacts never reproduce exactly in the same position from one cycle to another. Furthermore, when the position of the defect is moving with respect to the load distribution on the bearing, the series of impacts is modulated in amplitude. From these considerations, some randomness should be expected in the measured vibration signal, as well as some amplitude modulation. B. Characteristic Fault Frequencies and Vibration Spectrum Single-point defects produce one of the four characteristic fault frequencies in the machine vibration, depending on which bearing surface contains the fault; each one of bearing defect has its own signature, and it is characterized by a frequency
4253
Fig. 2. Test rig.
(1)–(4) which can be calculated starting from the structure and dimensions of the bearing [3], [27]. � � 1 Db cos β FC = FR 1 − (1) 2 Dc � � NB Db cos β FR 1 − FO = (2) 2 Dc � � NB Db cos β FR 1 + FI = (3) 2 Dc � � �2 � Db cos β Dc FB = FR 1 − (4) Db Dc where FR rotor frequency; FC cage fault frequency; inner raceway fault frequency; FI FO outer raceway fault frequency; FB ball fault frequency; Db ball diameter; Dc pitch diameter; NB number of rolling elements; β ball contact angle. The experimental setup used in this paper is shown in Fig. 2. With this setup, a 1.1-kW, 230-V, three-phase, and four-pole induction motor is used. The motor is fed directly from the mains (230 V and 50 Hz). To make a load, the rotor shaft is coupled to a double reduction speed reducer. This one is coupled, through a synchronous belt, with a dc machine which outputs in a rheostat. The accelerometer is mounted on the stator to measure the vibration mV/g (millivolts per gravity); in fact, this is the sensitivity of the accelerometer. Three hookon ammeters and three differential voltmeters are used for electrical measurements (voltages and currents). The optical encoder fixed at the free end of the shaft gives the angular position of the rotor shaft, and it delivers a square signal whose frequency is a multiple of the rotational frequency. This enables the study of the speed fluctuations. Therefore, four sensors are treated: an accelerometer signal, a single-phase current, a single-phase voltage, and an optical encoder signal. These signals are acquired at 25 600 Hz, except the optical encoder signal sampled at 102 400 Hz by a 24-b data
Authorized licensed use limited to: Ali Ibrahim. Downloaded on December 4, 2008 at 10:26 from IEEE Xplore. Restrictions apply.
4254
IEEE TRANSACTIONS ON INDUSTRIAL ELECTRONICS, VOL. 55, NO. 12, DECEMBER 2008
TABLE I BEARING PARAMETERS
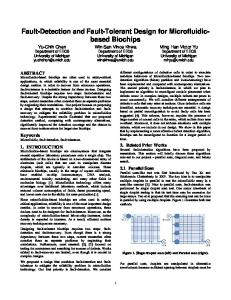
Fig. 5.
Outer raceway bearing fault.
Bearing faults are often low energy signals; they are difficult to detect until they become severe. Envelope analysis enables the detection of these signals and gives information about the precise fault frequencies but requires an accelerometer sensor as well as an analysis in high frequency. At low frequency, the defects of bearing are masked by the majority of the other mechanical events. C. Bearing Fault Impact
Fig. 3. Power spectrum density of vibration signal (accelerometer).
There is a crack in the outer raceway (Fig. 5) with a width of Δl = 1 mm. The rotor shaft speed is 24.7 Hz (∼155 rd/s). Knowing the dimensions of the bearing, we can calculate the time of passage past the damaged surface θ = ωr ∗ t
(5)
where θ is the angular position = Δl/r, r is the outer raceway radius = 20.74 mm, ωr = shaft speed, and t = time. t = θ/ωr = 310 μs.
(6)
If the defect causes a radial displacement, under gravity (a = 10 ms−2 ), the rotor shaft falls a maximum distance of s=
Fig. 4. Power spectrum density of the envelope of vibratory signal.
acquisition system. Table I shows the parameters of the bearing taken from the data sheet, and cos(β) deduced from various measurements. The motor operates at 30% load and at the rated shaft speed of 1488 r/min (FR = 24.6 Hz). By using these parameters, the presence of outer raceway defect at 62.89 Hz is confirmed by (2) and is located at 62.89 Hz in the vibration spectrum (Fig. 3); this spectrum is very rich because there are other frequencies related to the kinematics of the machine and the gear system. For this paper, we are interested only in all which is related to the bearing faults. This result is corroborated by an envelope analysis [26] of acceleration signal at high frequency (8.5 kHz) which confirms also the presence of defect at 62.9 Hz. Fig. 4 shows the power spectrum magnitude of the squared envelope detected in the 600-Hz span around 8.5 kHz. It shows the first four harmonics of the FO = 62.9 Hz and the shaft speed at 24.71 Hz.
1 2 at = 0.48 μm. 2
(7)
This displacement can be modeled by a square pulse which lasts 0.31 ms and is repeated for the passage of each ball (16 ms). Thus, there will be 16/0.31 ∼ 52 harmonics in the Fourier series until the first zero passage in the spectrum. Since they are aligned in phase, the total displacement (0.48 μm) will be divided between 52 harmonics; therefore, the size of each harmonic is approximately equal to 0.009 μm. Single-point defect begins as localized defect on the raceways (or rolling elements). Moreover, as the rolling elements pass over these defect areas, small collisions occur, producing mechanical shockwaves which then excite the frequencies of natural mechanical resonance in the machine. This process occurs every time that the defect collides with another part of the bearing, and its rate of occurrence is equal to one of the previously defined characteristic fault frequencies. Restated, the mechanical resonant frequencies (carriers) are modulated by the characteristic fault frequency (baseband signal) [28]. Bearing damages cause torque oscillations as well as a disturbance in the velocity signal, which can be easily detected by mechanical measurements. In order to provide proof of this approach, the instantaneous frequency will be analyzed in the following.
Authorized licensed use limited to: Ali Ibrahim. Downloaded on December 4, 2008 at 10:26 from IEEE Xplore. Restrictions apply.
IBRAHIM et al.: NEW BEARING FAULT DETECTION METHOD IN INDUCTION MACHINES BASED ON IPF
4255
III. U SING THE I NSTANTANEOUS S PEED AS I NDICATOR FOR A NALYSIS A. Definition Two basic definitions are proposed in the literature to calculate instantaneous frequency; one is established starting from the derivative of the phase of the analytic signal associated with the studied signal, and the other is given on the basis of the time–frequency representation of the studied signal. The instantaneous frequency fi (t) of a monocomponent analytic signal z(t) = a(t) ∗ ejφ(t) is defined as the derivative of its phase fi (t) =
1 dϕ(t) . 2π dt
(8)
The analytical signal z(t) is a complex signal containing the same information as the real signal x(t). In contrast to the real signal, the complex signal contains only positive frequencies. B. Algorithm of the Signal Processing The suggested method proceeds in five stages. 1) Bandpass filtering of the optical encoder signal around its fundamental frequency. 2) Calculation of the analytic signal starting from the filtered signal. 3) Calculation of the phase of the analytical signal. 4) Calculation of the instantaneous frequency. 5) The instantaneous frequency is not directly exploitable, because we are not interested in its value but in its frequential content. We thus calculate its power spectral density (PSD). The sampling frequency of the encoder signal used is 102 400 Hz, and the bandwidth of passband filter is 16 000– 34 000 Hz. Fig. 6 shows the power spectrum density of the instantaneous speed estimated using the optical encoder. The strongest components in this spectrum are related to the rotational frequency of 24.71 Hz and its harmonics. The bearing fault frequency at 62.89 Hz is also detected with its harmonics but with lower levels. This result proves that the bearing faults act immediately on the velocity and on the torque of the machine with a periodic disturbance equal to the fault signature. IV. T RANSMISSION OF B EARING F AULT ON S TATOR C URRENT A. Current Effect There are a number of papers giving evidence of the detection and diagnosis of faults in rolling element bearings, based on the analysis of the current of the induction motor driving the machine. The reason given for the effect of the faults on the current has so far been that the fault in the bearing causes the rotor to become displaced radially in the stator field. However, in Section II-C, we showed that in the case of small local faults in the races, even if their actual depth is, for example, 100 μm, the amount the shaft can actually move in the short time that the fault is being traversed is only a small fraction
Fig. 6. Power spectrum density of instantaneous frequency.
of this. Moreover, since the displacement takes place over a small fraction of the time between impacts (corresponding to the rolling element spacing), the total maximum displacement is divided over a large number of harmonics, and thus, the displacement attributable to the first harmonic (detected as a sideband in the motor current signature) would be approximately equal to 0.009 μm. It is not conceivable that such a displacement of the rotor would give a perceptible effect in the stator current, and the reason proposed here for this effect and proved in Section III is that the defect in the bearing acts on the torque of the machine. This paper argues that this would have a negligible effect on the motor current, and instead argues that the more likely reason why the faults manifest themselves in the current is because they give a fluctuating resistive torque which acts immediately, in contrast to the radial displacement which takes time to integrate to a perceptible displacement even in response to a step change in velocity. The torque oscillations generate stator current components [29] at predictable frequencies FBE related to the oscillations and electrical supply frequency by FBE = |FE ± k ∗ FV |
(9)
where FE is the power supply frequency, k = 1, 2, 3, . . ., and FV is one of the characteristic vibration frequencies (FC , FO , FI , FB , . . .). Equation (9) predicts the frequencies of interest in the current spectrum to be |FE ± k ∗ FO |. These current components are indicated on the spectral plots (Fig. 7) where FE = 50 Hz and FO = 62.89 Hz. B. Machine Equation The induction machine model is developed from its fundamental electrical and mechanical equations [30]. The electromagnetic torque in d−q frame for an induction motor is given by the following: Tem =
3 p Lm · · · (ψdr Iqs − ψqr Ids ) 2 2 Lr
Authorized licensed use limited to: Ali Ibrahim. Downloaded on December 4, 2008 at 10:26 from IEEE Xplore. Restrictions apply.
(10)
4256
IEEE TRANSACTIONS ON INDUSTRIAL ELECTRONICS, VOL. 55, NO. 12, DECEMBER 2008
increase the frequencies associated to the mechanical load and bearing fault. A basic spectral analysis of current signal is not sufficient to detect a bearing fault. Thus, we need to remove electrical components to make the detection of faults easier and to allow for better exploitation of the spectrum. We go further to introduce a new method based on IPF which extracts the mechanical information through electrical measurements. B. Solution: IPF In induction machine that operates in healthy conditions, the simple voltage Va has a lead of angle α over the current, and the power factor angle is seen as the angle between Ia and Va . In addition, because the induction motor is powered by a balanced three-phase source, then the simple voltage Vb lags the simple voltage Va by an angle 2π/3. The simple voltage Vc has a lead of 2π/3 over the simple voltage Va . The same reasoning can be employed for the three currents.
Fig. 7. Power spectrum density of stator current.
where stator currents in d−q frame; Ids , Iqs magnetizing inductance; Lm Lr rotor inductance; ψdr , ψqr rotor flux linkages; p number of pole pairs. Equation (10) highlights the relationship between the torque and the current and justifies the presence of the defect on the currents. Accordingly, any fault which generates torque oscillations will be reflected in the stator currents. The following mechanical equation will estimate the rotor angular velocity (ωr ): Tem − Tload = J
dωr dt
(11)
where J is the moment of inertia of the drive system. For motoring operation, load torque (Tload ) is positive, and for generating operation, load torque is negative. The electromagnetic torque in an induction machine is the product of the magnitudes of stator and rotor flux linkages and sine of the angle between them. V. E XPLOITATION OF E LECTRICAL S IGNALS A. Problematic Bearing faults give rise to torque oscillations which induce a phase modulation of the stator current [13], [18], [29]. The largest components present in the power spectrum density of the current (Fig. 7) occur at multiples of the supply frequency, and they are caused by saturation, winding distribution, and supply voltage. The frequency components produced by the bearing defect are relatively small when compared with the rest of the current spectrum. They are drowning in the noise, and their detection is not obvious. Fig. 7 shows a large difference in magnitude between the 50-Hz and the 112.89-Hz components equal to 77.47 dB. This fact makes the detection of bearing harmonics in the current spectrum a serious problem. This problem is discussed in [24], and the authors used Wiener filtering to decrease the dynamics of the power supply frequency and to
Va (t) = Um cos(ωs t)
(12)
Vb (t) = Um cos(ωs t − 2π/3)
(13)
Vc (t) = Um cos(ωs t + 2π/3)
(14)
Ia (t) = Im cos(ωs t − α)
(15)
Ib (t) = Im cos(ωs t − α − 2π/3)
(16)
Ic (t) = Im cos(ωs t − α + 2π/3)
(17)
where Um , Im , and ωs are the maximum voltage, the maximum current, and the power supply pulsation, respectively. In the presence of a fault, torque oscillations involve variations in the power factor, and in this case, in (15)–(17), α should be replaced by α(t). The goal now is to estimate the variable α that is assumed to contain information related to bearing defects. We proceed as follows. 1) Estimation of analytic signal IZ by using the Hilbert transform (Appendix). 2) Rejection of power supply frequency by multiplying the analytic signal by − exp(ωs t); thus, we obtain a residual signal equal to Im exp(jα(t)). 3) Phase estimation of residual signal to extract α(t). We confront a problem related to fluctuations in the power supply frequency coming from the electrical supply network. In reality, current and voltage pulsation are equal to ωs ± δωs . Equations (12) and (15) are rewritten to be Va� (t) = Um cos [(ωs ± δωs )t]
(18)
Ia� (t)
(19)
= Im cos [(ωs ± δωs )t − α(t)] .
To solve this problem, we are going to modify the previously described method through the combined use of current and voltage. The analytic signals for the current and voltage are written as VZ (t) = Um exp [(ωs ± δωs )t]
(20)
IZ (t) = Im exp [(ωs ± δωs )t − α(t)]
(21)
Authorized licensed use limited to: Ali Ibrahim. Downloaded on December 4, 2008 at 10:26 from IEEE Xplore. Restrictions apply.
IBRAHIM et al.: NEW BEARING FAULT DETECTION METHOD IN INDUCTION MACHINES BASED ON IPF
Fig. 8.
4257
Power factor estimator.
and thus, by subtraction of the phases, we will extract α(t) only ϕV (t) = (ωs ± δωs )t ϕI (t) = (ωs ± δωs )t − α(t) =⇒ α(t) = ϕV (t) − ϕI (t).
(22)
Fig. 8 summarizes all the steps of this method, and the experimental results are presented in Section VI. VI. E XPERIMENTAL R ESULTS Fig. 7 shows that the detection of the bearing faults by exploiting the current spectrum is not obvious. We will see that the exploitation of the IPF or the instantaneous power (IP) enables the best detection of faults because the use of these methods allows one, theoretically, to remove all the components related to the electric contribution and, particularly, the power supply frequency. The IPF is computed for healthy and outer raceway fault conditions. Fig. 9 shows the temporal evolution of the phase difference between the voltage and the current in the presence of a bearing fault in the machine. This signal has an average value of 0.6368 rd with a maximum and a minimum of 0.6779 and 0.5963 rd, respectively. This means that the power factor varies between 0.7789 and 0.8274 with an average value of 0.804. The spectral analysis of the IPF exploits these data better, and it allows the detection of the defect, as shown in Fig. 10. The results are analyzed through the PSD; dashed line corresponds to the defective mode, and the presence of the outer raceway fault signature at 62.89 Hz is clear while this signature does not appear in the healthy case. The difference in magnitude with the highest component (100 Hz) is reduced to 42 dB; in addition, we can detect its harmonics, as shown in Fig. 11. The appearance of a spectral line at 24.61 Hz corresponding to the rotor shaft speed and why it appears in the spectrum can be explained by the fact that torque fluctuations induce speed fluctuations. To evaluate the performances of this method, it will be compared with the IP. The relationship between the electric power and the electromagnetic torque is given by the following relation: Pabc = Tem ∗ ωs /p.
Fig. 9. IPF.
Fig. 10. Power spectrum density of IPF: (- - -) Bearing fault and (—) fault free.
(23)
where ωs is the current pulsation. The ratio ωs /p is constant; therefore, the fluctuations of torque appear directly on the IP. To highlight these fluctuations, we will treat the IP in the following, and we recall first the method of calculation based on current and voltage measurements. The phase-to-phase voltages are computed by Uab = Va − Vb
(24)
Ucb = Vc − Vb .
(25)
Fig. 11. Power spectrum density of IPF.
Authorized licensed use limited to: Ali Ibrahim. Downloaded on December 4, 2008 at 10:26 from IEEE Xplore. Restrictions apply.
4258
IEEE TRANSACTIONS ON INDUSTRIAL ELECTRONICS, VOL. 55, NO. 12, DECEMBER 2008
effects based on electrical approach. The bearing defect was modeled to show that the possibilities of a radial movement are very tiny and that the more likely reason why the faults manifest themselves in the current is because they give a fluctuating resistive torque which will be reflected in the stator currents. A new method based on the IPF was proposed for the detection of bearing defects based on electrical measurements only. The performances of this method were compared with that of the IP. Experimental results based on electrical measurements showed good agreement with the theoretical results. The use of signal processing is essential to detect the faults, and a good method must be chosen to allow for a reliable and precise diagnosis. A PPENDIX The Hilbert transform of the signal x(t) is defined as the signal whose frequency components are all phase shifted by −π/2 radians. The resulting signal is denoted by
Fig. 12. Power spectrum density of IP.
Partial instantaneous input powers Pab and Pcb are computed by multiplying Uab by Ia and Ucb by Ic
x ˆ(t) = H {x(t)} .
Pab = Uab ∗ Ia
(26)
Pcb = Ucb ∗ Ic .
x ˆ(t) is produced by passing x(t) through a filter with transfer function
(27)
Finally, the total instantaneous input power Pabc is then computed by adding the two partial powers Pabc = Pab + Pcb .
(28)
In the presence of a fault, torque oscillations involve variations in the power factor, and in this case, α must be replaced by α(t) = ωosc t + α, where ωosc is the fault frequency. Finally, the IP will be Pabc (t) =
3 Um Im cos (α(t)) . 2
(29)
Equation (29) highlights the close relationship between the IP and the IPF; this justifies the great resemblance in their spectra (Figs. 11 and 12) except for a factor due to the gain equal to 20 ∗ log((3/2)Um Im ). The use of the IPF is more advantageous than the IP. We can cite the following points. • The computation time of IPF is faster than IP. • Exploitation of IPF needs only on stator line. • The acquisition of IP requires more equipment (hook-on ammeters, differential voltmeters, cables, etc.) and a data acquisition system, with at least five input channels.
H(f ) = −jsgn(f ).
(30)
(31)
The magnitude and phase of H(f ) are |H(f )| = 1
(32)
φ {H(f )} = −
π sgn(f ). 2
(33)
The impulse response is the inverse Fourier transform of H(f ) h(t) =
1 . πt
(34)
It is instructive to contrast and compare the transfer function of the Hilbert transform to that of a pure time delay (x(t) → x(t − t0 )). The transfer function of the time delay is Hd (f ) = exp(−2πf t0 ) |Hd (f )| = 1 φ {Hd (f )} = − 2πf t0 .
(35) (36) (37)
Both have the same magnitude, but the time delay has a phase which is linear in frequency instead of constant.
VII. C ONCLUSION This paper contributes, in general, in the diagnosis of bearing faults in electric machines and, more particularly, in the diagnosis of asynchronous machines on the basis of electrical measurements. The impact of bearing faults on the electric quantities was studied. The effect of this type of defect on the stator current was for a long time modeled by a radial motion between the rotor and the stator of the machine, interpreted as an eccentricity. This paper gave another explanation for their
R EFERENCES [1] B. Raison, G. Rostaing, and J. P. Rognon, “Signal processing tools for monitoring induction drive,” in Proc. IEEE Ind. Electron. Soc. Conf., Nov./Dec. 1999, vol. 3, pp. 1198–1203. [2] J. Ilonen, J.-K. Kamarainen, T. Lindh, J. Ahola, H. Kälviäinen, and J. Partanen, “Diagnosis tool for motor condition monitoring,” IEEE Trans. Ind. Appl., vol. 41, no. 4, pp. 963–971, Jul./Aug. 2005. [3] J. R. Stack, T. G. Habetler, and R. G. Harley, “Fault classification and fault signature production for rolling element bearings in electric machines,” IEEE Trans. Ind. Appl., vol. 40, no. 3, pp. 735–739, May/Jun. 2004.
Authorized licensed use limited to: Ali Ibrahim. Downloaded on December 4, 2008 at 10:26 from IEEE Xplore. Restrictions apply.
IBRAHIM et al.: NEW BEARING FAULT DETECTION METHOD IN INDUCTION MACHINES BASED ON IPF
[4] S. Nandi, H. A. Toliyat, and L. Xiaodong, “Condition monitoring and fault diagnosis of electrical motors—A review,” IEEE Trans. Energy Convers., vol. 20, no. 4, pp. 719–729, Dec. 2005. [5] B. Ayhan, M.-Y. Chow, and M.-H. Song, “Multiple signature processingbased fault detection schemes for broken rotor bar in induction motors,” IEEE Trans. Energy Convers., vol. 20, no. 2, pp. 336–343, Jun. 2005. [6] S. Bachir, S. Tnani, J.-C. Trigeassou, and G. Champenois, “Diagnosis by parameter estimation of stator and rotor faults occurring in induction machines,” IEEE Trans. Ind. Electron., vol. 53, no. 3, pp. 963–973, Jun. 2006. [7] J. F. Martins, V. Ferno Pires, and A. J. Pires, “Unsupervised neuralnetwork-based algorithm for an on-line diagnosis of three-phase induction motor stator fault,” IEEE Trans. Ind. Electron., vol. 54, no. 1, pp. 259–264, Feb. 2007. [8] A. R. Mohanty and C. Kar, “Fault detection in a multistage gearbox by demodulation of motor current waveform,” IEEE Trans. Ind. Electron., vol. 53, no. 4, pp. 1285–1297, Jun. 2006. [9] P. O’Donnell, “Report of large motor reliability survey of industrial and commercial installations, Part I,” IEEE Trans. Ind. Appl., vol. IA-21, no. 4, pp. 853–864, Jul./Aug. 1985. [10] O. V. Thorsen and M. Dalva, “Failure identification and analysis for highvoltage induction motors in the petrochemical industry,” IEEE Trans. Ind. Appl., vol. 35, no. 4, pp. 810–818, Jul./Aug. 1999. [11] G. B. Kliman and J. Stein, “Induction motor fault detection via passive current monitoring,” in Proc. Int. Conf. Elect. Mach., Aug. 1990, pp. 13–17. [12] J. Grieger, R. Supangat, N. Ertugrul, W. L. Soong, D. A. Gray, and C. Hansen, “Estimation of static eccentricity severity in induction motors for on-line condition monitoring,” in Conf. Rec. IEEE IAS Annu. Meeting, Oct. 8–12, 2006, vol. 5, pp. 2312–2319. [13] M. Blodt, P. Granjon, B. Raison, and G. Rostaing, “Models for bearing damage detection in induction motors using stator current monitoring,” in Proc. IEEE ISIE, Ajaccio, France, May 2004, pp. 383–388. [14] M. Blodt, M. Chabert, J. Regnier, and J. Faucher, “Mechanical load fault detection in induction motors by stator current time–frequency analysis,” IEEE Trans. Ind. Appl., vol. 42, no. 6, pp. 1454–1463, Nov./Dec. 2006. [15] M. S. Ballal, Z. J. Khan, H. M. Suryawanshi, and R. L. Sonolikar, “Adaptive neural fuzzy inference system for the detection of inter-turn insulation and bearing wear faults in induction motor,” IEEE Trans. Ind. Electron., vol. 54, no. 1, pp. 250–258, Feb. 2007. [16] H. Su and K. T. Chong, “Induction machine condition monitoring using neural network modeling,” IEEE Trans. Ind. Electron., vol. 54, no. 1, pp. 241–249, Feb. 2007. [17] S. Villwock, H. Zoubek, and M. Pacas, “Rolling bearing condition monitoring based on frequency response analysis,” in Proc. IEEE SDEMPED, Cracow, Poland, Sep. 6–8, 2007, pp. 29–35. [18] H. Zoubek, S. Villwock, and M. Pacas, “Automated diagnosis of rolling bearing faults in electrical drives,” in Proc. ICPE, Daegu, Korea, 2007, pp. 718–723. [19] M. E. Benbouzid, “A review of induction motors signature analysis as a medium for faults detection,” IEEE Trans. Ind. Electron., vol. 47, no. 5, pp. 984–993, Oct. 2000. [20] W. T. Thomas and M. Fenger, “Current signature analysis to detect induction motor faults,” IEEE Ind. Appl. Mag., vol. 7, no. 4, pp. 26–34, Jul./Aug. 2001. [21] J.-H. Jung, J.-J. Lee, and B.-H. Kwon, “Online diagnosis of induction motors using MCSA,” IEEE Trans. Ind. Electron., vol. 53, no. 6, pp. 1842–1852, Dec. 2006. [22] S. H. Kia, H. Henao, and G.-A. Capolino, “A high-resolution frequency estimation method for three-phase induction machine fault detection,” IEEE Trans. Ind. Electron., vol. 54, no. 4, pp. 2295–2304, Aug. 2007. [23] G. Bouleux, A. Ibrahim, F. Guillet, and R. Boyer, “A subspace-based rejection method for detecting bearing fault in asynchronous motor,” in Proc. IEEE Int. Conf. CMD, Beijing, China, Apr. 21–24, 2008. [24] A. Ibrahim, M. El Badaoui, F. Guillet, and W. Youssef, “Electrical signals analysis of an asynchronous motor for bearing fault detection,” in Proc. IEEE IECON, Paris, France, Nov. 6–10, 2006, pp. 4975–4980. [25] A. Ibrahim, M. El Badaoui, F. Guillet, and M. Zoaeter, “Using the cyclostationarity of electrical signal for bearing fault detection in induction machine,” in Proc. IEEE, ICIT, Mumbai, India, Dec. 15–17, 2006, pp. 3008–3013. [26] J. Antoni and R. B. Randall, “On the use of the cyclic power spectrum in rolling element bearings diagnostics,” J. Sound Vib., vol. 281, no. 1/2, pp. 463–468, Mar. 2005. [27] R. A. Collacott, Vibration Monitoring and Diagnosis. New York: Wiley, 1979, pp. 109–111.
4259
[28] J. R. Stack, R. G. Harley, and T. G. Habetler, “An amplitude modulation detector for fault diagnosis in rolling element bearings,” IEEE Trans. Ind. Electron., vol. 51, no. 5, pp. 1097–1102, Oct. 2004. [29] R. R. Schoen and T. G. Habetler, “Effects of time-varying loads on rotor fault detection in induction machines,” IEEE Trans. Ind. Appl., vol. 31, no. 4, pp. 900–906, Jul./Aug. 1995. [30] P. Vas, Sensorless Vector and Direct Torque Control, 1st ed. Oxford, U.K.: Oxford Univ. Press, 1998.
Ali Ibrahim (M’06) received the Dipl. Eng. degree in electrical and electronics from Lebanese University, Beirut, Lebanon, in 2000, the M.Sc. degree in signal, image, speech, and telecom from the National Polytechnic Institute of Grenoble, Grenoble, France, in 2002, and the Ph.D. degree in signal processing from the Université Jean Monnet de Saint-Etienne, Roanne, France, in collaboration with Lebanese University, in 2008. He is currently with the Laboratoire d’Analyse des Signaux et des Processus Industriels, Academic Institute of Technology of Roanne, Université Jean Monnet de Saint-Etienne, Roanne, France. His research interests include signal processing applied for the diagnosis of electromechanical machines by vibratory, electric, and instantaneous speed analysis, including cyclostationary process studies.
Mohamed El Badaoui received the Dipl. Eng. degree and the M.Sc. degree in electronics engineering in 1996 and the Ph.D. degree in signal processing in 1999 from the Université Jean Monnet de SaintEtienne, Roanne, France. He is currently an Associate Professor with the Laboratoire d’Analyse des Signaux et des Processus Industriels, Academic Institute of Technology of Roanne, Université Jean Monnet de Saint-Etienne. His research interests include signal processing applied to vibratory analysis, system identification, cyclostationary analysis, and blind sources separation.
François Guillet received the M.Sc. and Ph.D. degrees in signal processing from the National Polytechnic Institute of Grenoble, Grenoble, France, in 1987 and 1990, respectively. From 1991 to 1994, he was the Director of the Department of Industrial Engineering and Maintenance, Academic Institute of Technology of Roanne, Université Jean Monnet de Saint-Etienne, Roanne, France. In 1995, he contributed in the creation of the Laboratoire d’Analyse des Signaux et des Processus Industriels (LASPI). Since 2003, he has been a Professor with Université Jean Monnet de Saint-Etienne and the Head of LASPI. His research interests include signal processing applied for the diagnosis of rotating machines by vibratory, electric, and instantaneous speed analysis, including cyclostationary process studies, blind system identification, and deconvolution.
Frédéric Bonnardot was born in Roanne, France, on December 19, 1977. He received the Ph.D. degree in signal processing from the National Polytechnic Institute of Grenoble, Grenoble, France, in 2004. He is currently a Lecturer with the Academic Institute of Technology of Roanne, Université Jean Monnet de Saint-Etienne, Roanne, France. His research interests at the Laboratoire d’Analyse des Signaux et des Processus Industriels include cyclostationarity and resampling. Applications are concerned with noise and vibration analysis and system diagnosis.
Authorized licensed use limited to: Ali Ibrahim. Downloaded on December 4, 2008 at 10:26 from IEEE Xplore. Restrictions apply.