Behav Ecol Sociobiol (2013) 67:1867–1875 DOI 10.1007/s00265-013-1612-8
METHODS
A novel application of Approximate Bayesian Computation for detecting male reproductive advantages due to mating order M. Catherine Duryea & Andrew D. Kern & Robert M. Cox & Ryan Calsbeek Received: 15 April 2013 / Revised: 5 July 2013 / Accepted: 17 July 2013 / Published online: 21 August 2013 # Springer-Verlag Berlin Heidelberg 2013
Abstract Studies of the effects of mating order on fertilization success, classically analyzed as the proportional paternity of the second male, have advanced our understanding of the relative influences of postcopulatory male–male competition and female choice on sexual selection. However, results from these studies are often difficult to analyze because (1) distributions of offspring per dam rarely follow a normal distribution and (2) proportional paternities are never normally distributed. Previous studies partially account for these limitations by using nonparametric statistics. However, behavioral studies are often plagued by relatively small sample sizes and require a more powerful analytical approach. Here, we develop a new analytical framework for studying fertilization bias. Our Approximate Bayesian Computational (ABC) model overcomes many of the limitations of currently employed methods. We apply our model to analyze the effects of male mating order on paternity success in the brown anole lizard, Anolis sagrei. Using our ABC simulation, we find a marked first-male advantage: first males sired approximately 80 % of the offspring in our study. Next, based on re-analysis of four previously published datasets, we show that traditional statistical methods often over- or underestimate biases related to Communicated by S. J. Downes Electronic supplementary material The online version of this article (doi:10.1007/s00265-013-1612-8) contains supplementary material, which is available to authorized users. M. C. Duryea (*) : A. D. Kern : R. M. Cox : R. Calsbeek Department of Biological Sciences, Dartmouth College, 78 College St, Hanover, NH 03755, USA e-mail:
[email protected] A. D. Kern Department of Genetics, Rutgers University, Piscataway, NJ 08854, USA R. M. Cox Department of Biology, University of Virginia, Charlottesville, VA 22904, USA
mating order. Moreover, by comparing our model to more traditional statistical tests, we show that the ABC method is robust to relatively small samples sizes and should therefore be useful for studying mating-order effects in a variety of systems. Our model is implemented as an R package, ABCp2, and is freely available for use. Keywords Mating order . P2 . Paternity . Sperm precedence
Introduction Sexual selection is a major driver of biodiversity with the power to create spectacular forms of variation (Darwin 1871; Andersson 1994). However, only recently have we begun to understand how processes operating at the postcopulatory level can create variation through cryptic mechanisms of male–male competition and female choice. Longterm sperm storage is one such postcopulatory process and is widespread in the animal kingdom (Eberhard 1996; Birkhead and Møller 1998; Simmons 2001). Whenever a female mates with and stores sperm from multiple males, there is the potential for fertilization to be biased on the basis of mating order. This is because the first male may prevent subsequent males from mating (through physical barriers such as sperm plugs or behaviors such as mate guarding), whereas the last male can manipulate sperm from previous males (e.g., sperm scooping in odonates, Eberhard 1996). Studying fertilization biases that arise due to mating order is one important means of understanding cryptic processes that influence reproductive success (Thornhill 1983; Birkhead et al. 1995). Molecular methods for analyzing paternity make it possible to study the role of long-term sperm storage in fertilization biases. The proportional paternity of the second male to mate (P2) has been used as a means to analyze molecular data for evidence of sire precedence based on mating order (Birkhead and Hunter 1990; Parker and Pizzari 2010). Many studies of
1868
P2 face a common analytical challenge when testing the relative fitness advantage of one male over another, namely that the data do not easily lend themselves to simple statistical analysis. This is expected based on theory since males should have large variance in reproduction success, and thus, distributions of reproductive success are usually not normally distributed (Bateman 1948; Andersson 1994). Additionally, most count data, such as the number of offspring sired, tend to be Poisson-distributed. Moreover, mating-order data are typically analyzed as proportions (i.e., P2), which further complicates statistical analysis. Some studies have dealt with these challenges using arcsine square root transformations of P2 (Kraaijeveld-Smit et al. 2002; House et al. 2007; Harano et al. 2008), but these transformations do not always result in normalized distributions. Indeed, Eggert et al. (2003) showed that violation of the assumptions of statistical analyses could lead to inaccurate interpretations and concluded that a complete understanding of sperm competition dynamics strongly depends on using appropriate statistical analyses. In cases where P2 can be estimated as a binomial probability, an alternative approach to investigating effects of mating order is to use analyses that assume binomial probability distributions of offspring sired by the second male (Kraaijeveld-Smit et al. 2002; Evanno et al. 2005). Although this method may increase statistical power, it is not always appropriate to assume a binomial distribution of offspring paternities, especially when large sample sizes are not available, or when there is large variance in reproduction among females. In cases of small sample sizes or high variance among females, the degree of noise in the data may make it difficult to detect relevant biological patterns through a binomial analysis or nonparametic analysis. Cook et al. (1997) developed an approach that creates a hypothetical distribution of P2 values based on empirical estimates of the mean and variance in number of sperm transferred per male. Still, this method requires knowledge of the amount of sperm transferred and thus is not easily applied to most systems. Clearly, there remains a pressing need for a powerful and broadly applicable analytical framework for studying paternity biases and their role in sexual selection. Approximate Bayesian Computation (ABC) has been used to address a number of biological questions in which the data are not easily or appropriately analyzed through classical statistical methods (e.g., Pritchard et al. 1999). The ABC approach involves simulating data based on priors from the observed data and then comparing simulated and observed data. The simulated data are accepted if they are found to be reasonably close to the observed data, based on predefined rejection criteria. Following this approach, a posterior distribution of accepted values is generated and used to gain inference on the observed data. Here, we develop a novel ABC statistical package (ABCp2) in R (R Development Core) to
Behav Ecol Sociobiol (2013) 67:1867–1875
study fertilization bias with respect to mating order. Our model uses summary statistics calculated from molecular paternity data as priors and matches the underlying distribution of the data (Poisson or special cases of Normal and Gamma) for enhanced sensitivity at detecting variation in male reproductive success due to mating order. We test the robustness of our model using simulation and apply the model to a molecular paternity dataset from a breeding study of brown anoles, Anolis sagrei. This lizard has recently become the subject of much research on postcopulatory fertilization biases (Cox and Calsbeek 2010; Cox et al. 2011) and represents an ideal system in which to test our model. Additionally, although the majority of reptiles that have been studied exhibit long-term sperm storage, the effects of mating order on paternity success in these species are largely unknown (but see Olsson and Madsen 1998; Zamudio and Sinervo 2000; Calsbeek et al. 2007; Radder et al. 2008). Thus, our study provides important additional data on sperm storage in reptiles. We further demonstrate the utility of our model by applying it to four previously published datasets: studies of mating order biases in rough-skinned newts, Taricha granulosa (Jones et al. 2002), fungus beetles, Bolitotherus cornutus (Conner 1995), rove beetles, Aleochara curtula (Benken et al. 1999), and in soapberry bugs, Jadera haematoloma (Carroll 1991). We chose these studies because they represent a range of biological patterns that can result from the effects of mating order (first- to last-male precedence), a range of previous statistical approaches, and a range of biological systems for which a P2 approach may be relevant. We predicted that, in some cases, our method would reveal mating order biases not previously detected by more traditional statistical tests, owing to the enhanced power that our model provides by fitting each analysis to the appropriate statistical distribution. This new ABC approach to studying mating order biases overcomes many of the shortcomings of previous studies and can be adapted to analyze reproductive patterns in future studies.
Methods Approximate Bayesian Computation To assess the effects of male mating order on reproductive success, we developed an Approximate Bayesian model using the ABC inference framework and rejection algorithm outlined by Pritchard et al. (1999). We designed our model in the R (Version 2.11.1; R Development Core Team) programming language and compiled all functions into an R package (ABCp2), which is freely downloadable from the Comprehensive R Archive Network (http://cran.r-project. org). Below, we outline the general framework of the model and then describe how it was applied to the Anolis paternity data and four previously published datasets.
Behav Ecol Sociobiol (2013) 67:1867–1875
First, we determine the statistical distribution that best fits the distribution of total offspring per female using the fitdistr function in the MASS package (Venables and Ripley 2002). Next, we generate a distribution of total offspring per dam according to the estimated parameters (e.g., mean and standard deviation, if normal) and test the goodness of fit using a chi-squared test. Our R package automates this for the Poisson, Normal, and Gamma distributions using our functions fit_dist_pois, fit_dist_norm, and fit_dist_gamma. For the normal and gamma distributions, we exclude negative and zero values of offspring when generating the distribution of total offspring to more closely approximate actual offspring count data. If the distribution is a good fit based on the chisquared test, the estimates for the distribution parameters can be used as hyperpriors in the ABC model for estimating P2. Once the best-fit distribution has been chosen, our functions ABC_P2_pois, ABC_P2_norm, and ABC _P2_gamma can be used to estimate P2. The first step in these functions is to generate a large number of distributions of number of offspring per dam. The number of dams (n) can be varied in our model to match empirical data of different sample sizes. The distribution of offspring is generated according to the hyperpriors that were estimated from the parameters of the offspring distribution using the fit_dist functions. Then, the proportional paternity of the second male (P2) is estimated from these simulated datasets using a prior from the empirical data, the mean number of progeny sired by the second male (ObsMean). For each simulated distribution, we use a random binomial number generator to assign a proportion of offspring to the second male based on a random proportion (P2) drawn from the uniform distribution. Prior values of P2 range from 0 to 1. To compare the randomly generated P2 to the actual P2 observed in the empirical data, we calculate the difference (delta) between the mean number of progeny sired by the second male from the simulated distribution (MeanP2) and the mean number of progeny sired by the second male from the data (ObsMean) (e.g., |meanP2−ObsMean|). The user defines the delta value according to the desired maximum allowed difference between the observed and estimated mean number of offspring sired by the second male. If |meanP2− ObsMean|≤delta, the P2 value is accepted and saved to the posterior distribution. To generate a posterior distribution of P2 values, this process is iterated several thousand times (e.g., 10,000 times) by specifying the iter argument in the function. The value of P2 is estimated based on the mean and 95 % credible intervals (CI) of this posterior. Verification and sensitivity of model To verify the effectiveness of our model, we simulated virtual datasets according to set P2 values ranging from 0.1 to 0.9 in increments of 0.1 (we exclude 0 and 1 from this range as these, by definition, rule out multiple paternity) and tested the ability
1869
of the model to accurately estimate these set values. All simulations were conducted in R (Version 2.11.1; R Development Core Team) using scripts to automate the process. For each simulation, we generated a virtual dataset according to the parameters from our Anolis dataset (shape and scale values of the distribution), calculated a mean number of offspring from the second male in each virtual dataset, and used this value as the prior in the model. We estimated P2 values from 1,000 iterations for each P2 value and compared the posterior distributions to the set P2 values of the simulated data using 95 % credible intervals. To establish the sensitivity of our model to the underlying distribution of the number of offspring per female, we conducted a series of misspecified models. Simulated datasets were generated for a sample size of 100 dams, according to an assigned P2 value, under Poisson, Normal, and Uniform distributions of offspring counts, and we tested the ability of the model to accurately estimate the assigned value by analysis under the gamma distribution. Accuracy of the estimates was judged based on 95 % credible intervals. To establish the sensitivity of the model to variation in sample size (numbers of dams), we simulated P2 values for sample sizes that ranged from 10 to 50 dams in increments of ten and for P2 values ranging from 0.1 to 0.9 by increments of 0.1. We also tested the performance of our model using large sample sizes to establish the sample size needed to detect P2 values at fine deviations from random. For this test, we compared the same assigned values of P2 for sample sizes of 100–1,000 in increments of 100. For each simulation, we generated virtual datasets according to the parameters from our Anolis dataset (shape and scale values of the gamma distribution and 1.32 as an observed mean number of offspring from the second male). For each sample size and at each P2 value, we calculated the 95 % credible intervals from the generated posterior distributions for 100 iterations to quantify the precision of the estimate at varying sample sizes. Comparison to classical statistics To compare our approximate Bayesian model to classical methods of P2 analysis, we resampled from an existing paternity dataset for Anolis lizards (Cox and Calsbeek 2010; Cox et al. 2011) using increasingly larger sample sizes (see below) to determine the proportion of significant results from 1,000 iterations of resampling. We resampled data for two statistical tests: the Binomial and the Wilcoxon tests. For both tests, we resampled values for the number of offspring sired by each male, at random and with replacement, from our laboratory dataset. For the Binomial test, we tested whether the sampled value of offspring sired by the second male differed from the null hypothesis of 0.5 for P2. We used the nonparametric Wilcoxon test to determine whether the mean number of offspring differed between the first and second male, for the
1870
resampled data. For both tests, we used sample sizes of 50, 100, 200, 300, 400, and 500 dams. Values of paternity were sampled equally for both males (i.e., for 50 dams, we sampled 25 values from offspring sired from the first male and 25 values of offspring from the second male from our laboratory dataset). All resampling and statistical tests were conducted in R (Version 2.11.1; R Development Core Team). Applying the model We analyzed Anolis paternity data from a previously published breeding study of brown anoles (Cox and Calsbeek 2010; Cox et al. 2011). This dataset is ideal for assessing the effects of mating order on paternity because each captive dam (N =67) was provided with two potential mates. Complete details of animal husbandry and care are described by Cox et al. (2011). Briefly, we placed both males in the dam's cage and allowed her to assess them together for 2 days. We then removed one male and allowed the other male to mate exclusively with the dam for 1 week. Finally, we removed the first male and allowed the second male to mate exclusively with the dam for 1 week. Using this design, each male mated with two dams, once as the first and once as the second male, thus controlling for the potential effects due to individual males on mating precedence. We allowed dams to oviposit in potted plants and subsequently collected tissue samples from all hatchlings upon emergence. We genotyped each dam, sire, and hatchling at six microsatellite loci (Bardeleben et al. 2004) using procedures described in Cox et al. (2011). Maternity was known with certainty, and we assigned paternity using the software package CERVUS (Marshall et al. 1998) following methods reported elsewhere (Calsbeek and Bonneaud 2008; Cox et al. 2011). To analyze the Anolis paternity data, offspring were simulated according to the gamma distribution. This distribution was chosen based on fitting the distribution of total offspring per dam using our fit_dist functions and testing the goodness of fit of each distribution using the results of the chi-squared test. Hyperpriors of this distribution were estimated by varying the shape and scale parameters of the gamma distribution and determining which parameters most accurately reflected the offspring distribution of the empirical data and returned the most precise estimate for P2, based on width of the credible interval. We tested priors of the shape parameter from 2–20 and values of scale parameters from 0.1–1. Starting values for these ranges were chosen based on the fit of the gamma distribution conducted using our fit_dist_gamma function. After estimating these hyperpriors, scale and shape parameters of the gamma distribution were randomly generated from a uniform distribution around the best-fit values from the initial simulations. Distributions were generated for 67 dams (n), according to the number of dams in our empirical data, and the prior value for the observed mean number of offspring of the
Behav Ecol Sociobiol (2013) 67:1867–1875
second male (ObsMean) was set at 1.32, according to the mean calculated from our Anolis paternity data. We tested delta values of 0.1 and 0.01. Because we were analyzing offspring counts, differences smaller than 0.01 in numbers of offspring were not likely to be biologically relevant. We ran the model for 10,000 iterations and estimated P2 for the Anolis data based on the mean and 95 % credible intervals of the posterior. We also analyzed sperm precedence data from four previously published datasets (Carroll 1991; Conner 1995; Benken et al. 1999; Jones et al. 2002). Although these studies varied in the particulars of experimental design, they all involved a mating design in which females were allowed to mate sequentially with two males and the proportional paternity of each male was assessed by using the sterile male technique (Carroll 1991), or by genotyping using starch gel electrophoresis (Conner 1995), DNA fingerprinting (Benken et al. 1999), or microsatellite markers (Jones et al. 2002). We analyzed these four datasets using our ABC model following a procedure similar to our analysis of the Anolis data. First, the distribution of total offspring per dam for each dataset was analyzed using our fit_dist functions to determine the best-fit distribution (Normal, Poisson, or Gamma). Then, the goodness of fit of each distribution was verified using the results of the chisquared test. Next, the hyperpriors of each model were optimized—mean and standard deviation if normally distributed, lambda if fit to a Poisson distribution, and shape and rate if fit to a gamma distribution. Finally, we estimated P2 for each data set using the optimized hyperpriors and the observed mean number of offspring from the second male (ObsMean) as a prior. P2 was estimated based on a posterior generated through 1,000 iterations of the model.
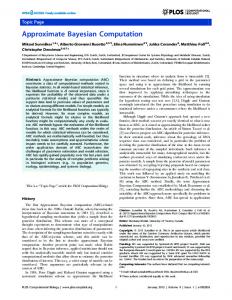
Results Verification and sensitivity of model In our simulation tests of the effectiveness of our model, mean estimates of P2 always agreed with the assigned values used in each model and credible intervals were small in all cases (mean CI, 0.102; Fig. 1). Thus, our model is both accurate and precise at estimating P2. Our model was not sensitive to the underlying distribution and accurately estimated assigned values of P2 for misspecified models. For models analyzed under gamma and simulated under other distributions, the credible intervals were small, suggesting that our model is not sensitive to the underlying distribution. Lengths of credible intervals were as follows: Poisson (0.17), Normal (0.16), and Uniform (0.21). This suggests that even if the chosen distribution is not the best-fit distribution, the estimated P2 value should be only 0.11 units above or below the actual value, at most.
1871
1.0
Behav Ecol Sociobiol (2013) 67:1867–1875
0.6 0.4
Comparison to classical statistics
0.0
0.2
Estimated P2
0.8
more sensitive to the mean number of offspring per dam than to the total number of dams, with the model being more accurate for species in which individual females produced greater numbers of offspring (see “Applying the model” below).
0.1
0.2
0.3
0.4
0.5
0.6
0.7
0.8
0.9
True P2
Fig. 1 Accuracy of approximate Bayesian model in predicting P2 for set P2 values from 0.1 to 0.9. Boxplots show the estimated P2 for 1,000 iterations of the model. The model returned set values with narrow credible intervals for all values of P2. Dashed lines indicate the 1:1 line for estimated and true values of P2
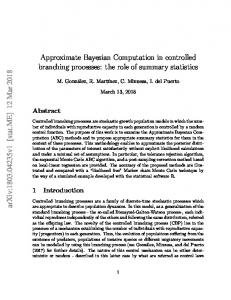
Simulations indicated that sample sizes of at least 30 dams are required to accurately estimate significant P2 effects (i.e., different from 0.50) using priors from our Anolis data. At smaller values, the credible interval was too wide to accurately estimate departures from random (Fig. 2). Simulations also indicated that our model could accurately estimate very fine deviations in P2 values from random, if very large samples sizes are available (e.g., n >200, Fig. 2). However, application of the model to other datasets shows that our model is perhaps
Our resampling simulations showed that much larger sample sizes are needed to detect significant differences in P2 values using either the Binomial or Wilcoxon test, compared to our ABC method. At sample sizes of 50 dams, only 26 % of the Binomial simulations and 14 % of the Wilcoxon simulations returned a significant result based on 1,000 iterations using the Anolis dataset (Table 1). Sample sizes of at least 300 dams were needed to return a majority of significant results for both tests (Table 1). Applying the model For the Anolis data, paternity was reliably assigned (i.e., 95 % confidence) to 211 offspring from 67 dams (Fig. S1). Only dams that produced offspring were included in the study. Of these offspring, 122 were assigned to the first male and 89 to the second male (Fig. S1). Mean proportional second-male paternity (P2) was 0.42, while the median P2 was 0.20 (Fig. S2). We report these values for comparative purposes although the disparity between these two measures of central tendency indicates the non-normality of the data and thus its inappropriateness for analysis through parametric statistical methods. Examining the distribution of per male difference
Table 1 Results from 1,000 iterations of resampling from a laboratory paternity dataset of Anolis sagrei Test
Sample size
Proportion significant
Binomial
50 100 200 300 400 500 50 100
0.26 0.36 0.50 0.57 0.68 0.76 0.14 0.21
200 300 400 500
0.37 0.55 0.68 0.80
Wilcoxon
Fig. 2 Sensitivity of approximate Bayesian model to sample size for set P2 values of 0.1–0.9. Credible interval refers to the 95 % credible interval from the posterior distributions generated by the model. Smaller credible intervals indicate greater confidence in an estimate
The table shows the proportion of iterations that resulted in a significant difference in paternity by mating order based on the Binomial and Wilcoxon tests
1872
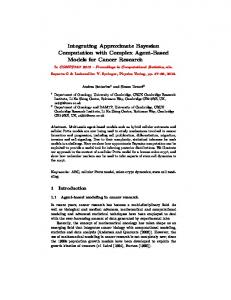
between the numbers of offspring sired when sires were first versus the number they sired when second demonstrates that males tended to sire more offspring when they were the first to mate (Fig. S3). The second male sired an average of 1.32 offspring, and this value was used as a prior in the approximate Bayesian model. Goodness-of-fit tests indicated that the Anolis offspring count data best fit a gamma distribution. Initial simulations showed that the model performed best at shape priors greater than 10 and scale priors greater than 0.5. This was judged based on the width of the credible interval. Thus, prior ranges for shape and scale parameters were set at 10–15 and 0.5–1, respectively. We selected a delta value of 0.1 because a value of 0.01 did not greatly improve the precision of the model in estimating P2, judged by width of credible interval. The approximate Bayesian model estimated a mean P 2 value of 0.16 after 10,000 iterations (Fig. 3). These results indicate that the second male sires significantly less than 50 % of the offspring (95 % credible interval, 0.09–0.25; Fig. 3), and thus, there appears to be a first-male advantage in Anolis sagrei. Distribution of total offspring per dam for the roughskinned newt, Taricha granulosa (Jones et al. 2002) best fit a Poisson distribution with lambda values of 167–177. The prior value of mean number of offspring sired by the second male was calculated from the data as 43.2. Our model estimated a P2 value of 0.25 with 95 % confidence intervals of 0.23–0.28 (Fig. 4). This agrees with the estimate of P2 reported by Jones et al. (2002) of 0.25 (±0.03) based on the mean and standard deviation.
Behav Ecol Sociobiol (2013) 67:1867–1875
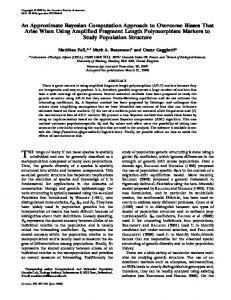
Distributions of total offspring per dam for the fungus beetle, Bolitotherus cornutus (Conner 1995); rove beetle, Aleochara curtula (Benken et al. 1999); and soapberry bug, Jadera haematoloma (Carroll 1991) best fit a special case of the normal distribution in which zero and negative values were excluded. Prior ranges for the average of the distributions were 12–18, 34–44, and 105–119 for the fungus beetle, rove beetle, and soapberry bug, respectively. Similarly, prior ranges for the standard deviations were 8–12, 16–22, and 26– 36, respectively. P2 for the fungus beetle was estimated at 0.52 (CI, 0.46–59; Fig. 4), confirming the findings of Conner (1995). Conner (1995) reported an average P2 value of 0.67, but a one-sample t test showed no significant difference between this value and an average value of 0.5. For the rove beetle, we estimated P2 to be 0.54 (CI, 0.51–0.58; Fig. 4). This suggests that the median value of 0.87 reported by Benken et al. (1999) may be an overestimate. For the soapberry bug, we estimated P2 to be 0.62 (CI, 0.60–0.64; Fig. 4), which suggests that there is a second-male advantage that was undetected by the analysis conducted in the original study (Carroll 1991). Additionally, application of our model to previously published data shows that our model is most accurate when dams tended to produce large numbers of offspring. This is evidenced by the rough-skinned newt data and soapberry bug data in which dams' average total number of offspring was high (172±40 and 111±32, mean ± SD, respectively), and our model returned a very precise estimate of P2 (mean, 0.25; CI, 0.23–0.28 and mean, 0.62; CI, 0.60–0.64; Fig. 4). This is in contrast to the fungus beetle data in which a dam's average total offspring was 14 (±11; SD), and our estimates of P2 were decidedly less precise (mean, 0.52; CI, 0.46–59; Fig. 4). Data from the rove beetle had an intermediate value for average offspring by dam (39±19), and P2 was estimated with an intermediate level of accuracy (mean, 0.54; CI, 0.51– 0.58; Fig. 4).
Discussion
Fig. 3 Posterior distribution of P2 from approximate Bayesian analysis of Anolis sagrei paternity data. Bold line indicates the mean estimate and dashed lines indicate 95 % credible intervals for 10,000 iterations with a sample size (N) of 67 dams and a delta value of 0.1 between simulated and observed means
Bayesian analysis has proven useful for addressing a wide range of biological questions. Although it is perhaps best known for its applications to population genetics (Pritchard et al. 1999; Beaumont et al. 2002), it has been applied to a diversity of topics, such as gene expression analysis (Friedman et al. 2000) and conservation biology (Wade 2000). Similar to Bayesian applications in conservation biology, our approximate Bayesian model uses known ecological data to analyze a pattern in a way that is intuitive and easily interpreted. Specifically, by including parameters that were calculated from ecological data (such as the mean and dispersion of the distribution of offspring), we developed a robust analysis for an ecological question.
Behav Ecol Sociobiol (2013) 67:1867–1875
1873 Fungus Beetle
0.22
0.24
0.26 P2
0.28
0.30
0.40
0.45
0.50
0.55
0.60
0.65
P2
100
Frequency
0
50 0
50
Frequency
150
200
200 150
200 150
Frequency
100 50 0
50 0 0.20
Soapberry Bug
100
300 250 200 150 100
Frequency
Rove Beetle
250
Newt
0.45
0.50
0.55 P2
0.60
0.65
0.58
0.60
0.62
0.64
0.66
P2
Fig. 4 Posterior distributions of P2 resulting from application of the approximate Bayesian model to previously published data for the rough-skinned newt (Taricha granulosa ), the fungus beetle (Bolitotherus cornutus ), the rove beetle (Aleochara curtula ), and
the soapberry bug (Jadera haematoloma ). Bold lines indicate the mean estimate and dashed lines indicate 95 % credible intervals for 1,000 iterations with a delta value of 0.1 between simulated and observed mean
Through simulation and application of our model to published data, we have shown that our model requires much smaller sample sizes to detect significant differences than classical statistical methods, such as the Binomial and Wilcoxon test, and will be useful for investigating biological processes for organisms in which large sample sizes are not readily available. This is perhaps best demonstrated through our re-analysis of data from the rough-skinned newt, where our model was able to estimate a very precise value of P2 when data were only available for ten dams. Additionally, we have shown that traditional methods of analysis often miss relevant patterns related to mating order. For example, Carroll (1991) reported no effect of mating order in a study of the soapberry bug; however, we find that there may actually be a second-male advantage, with second males siring 62 % of offspring on average. In the original study, Carroll (1991) did not conduct a statistical test on the soapberry bug P2 data; he simply reported the two modes of the distribution of P2 values, 0.30 and 0.80. Perhaps this was because the bimodal nature of the data made it difficult to analyze under the available statistical means. Alternatively, the use of summary statistics may overestimate an effect of mating order when the data are not normally distributed. For example, in a study of the rove beetle, Benken et al. (1999) reported a median value of P2 of 0.87, which would indicate a strong second-male advantage. However, when we fit the data to the appropriate distribution (a special case of the normal), our model estimated P2 to be 0.54, which would indicate only a slight second-male advantage. Because Benken et al. (1999) did not report confidence values for their estimate and found high variance for P2, we believe our estimate to be a more accurate representation of the biological pattern. Thus, the use of appropriate analysis is essential to accurate interpretation of the data. This is a pervasive problem in behavioral ecology, a field in which sample sizes are often small and not normally distributed. Our model
represents a simple solution to this problem and will be useful to a number of studies of reproductive behavior. Although P2 has been widely applied to investigate sperm competition and cryptic female choice, it has often been criticized because, by focusing on an average value of P2, one is often ignoring the variance around the value, which may actually provide more information on the biology of a mating system (Cook et al. 1997; Corley et al. 2006). However, we propose that estimation of P2 through our model will be useful for two reasons: (1) estimating P2 can give preliminary insight into postcopulatory patterns that can lead to further investigation of the biology and behaviors that result in these patterns and (2) our model provides a credible interval on the estimate of P2, which allows for an estimation of the variance. Additionally, future versions of our model could analyze data from more than two sires by incorporating multiple priors for average offspring per male and estimating the proportional paternity of each. Thus, through the power, simplicity, and robustness of our model, we hope to open the doors for investigation of postcopulatory sexual selection in a wide range of mating systems. Although our primary goal in this paper is to develop a new analytical tool for broad application, our initial motivation was to gain greater insight into the effect of mating order on fertilization success in the brown anole. Implementing our approximate Bayesian model, we have shown that male brown anoles gain a strong paternity advantage when they are the first to copulate with a female (P 2 =0.16). Given the nature of our mating design, females were allowed to initially interact with both males together, and thus, there may have been matings during that initial 3-day period of assessment. This caveat would be of primary concern in our study if a second-male advantage had been detected. The first male advantage reported here suggests that any unintended matings during the initial assessment period only make our findings conservative.
1874
A first-male advantage in the brown anole could result either from male–male competition or through a female's preference for the first male. Copulatory plugs and mate guarding have both been reported in other lizard species (Olsson and Madsen 1998; Moreira and Birkhead 2003). Although either of these could result in a first-male advantage, we observed no obvious copulatory plugs and mate guarding was prevented by the design of the experiment. However, one male's ejaculate could serve as a physical impediment and limit sperm transfer by subsequent males. A first-male advantage could also arise if females get a majority of their sperm stores from the first male with which they mate. For example, the second male to mate may choose to deliver less sperm to a non-virgin female (Birkhead and Møller 1998; Parker and Pizzari 2010) or a female may accept less sperm from the second male. Female rough-skinned newts primarily receive sperm from their first mate and then “top off” their sperm stores with sperm from additional males only if space remains in their spermathecae (Jones et al. 2002). Alternatively, females could be choosing whether or not to use the majority of sperm from the first male depending on their assessments of male quality. In this case, P2 is expected to have a bimodal distribution with peaks at zero and one (i.e., relatively few females produce offspring with both the first and second male). This bimodal pattern has been suggested to occur when females “trade up” or remate to gain higher quality sperm (Evans and Magurran 2001; Pitcher et al. 2003). Recent work has shown that larger males tend to have more fit sons, as measured by survival (Cox and Calsbeek 2010). This suggests that body size may indicate something about a male's genetic quality. Thus, female brown anoles may be deciding to trade up when the second male is larger or of better quality and the first-male advantage may be, at least in part, related to female choice. Although the mechanisms that account for the matingorder bias observed in this study require further investigation, our model is applicable to a wide range of taxa (especially nonmodel organisms) and could provide valuable insight into pre- and postcopulatory mating processes that are related to mating order. Simulations show that our model is able to detect departures from random paternity based on mating order, even at relatively small sample sizes, and can easily be adapted to fit other distributions of offspring counts and service other systems in which offspring are distributed nonnormally. In two cases, our model confirmed patterns detected through other statistical analysis (Conner 1995; Jones et al. 2002); for rough-skinned newts, our model showed a clear first-male advantage, and in the fungus beetle, there are no detectable differences between the two males. In the other two cases, we have shown that traditional analysis can fail to detect a mating-order advantage (e.g., soapberry bugs; Carroll 1991) or can overestimate an advantage (e.g., rove beetle; Benken et al. 1999). Additionally, components could be added to our
Behav Ecol Sociobiol (2013) 67:1867–1875
model to address differences in paternity related to male characters other than mating order and thus could be useful for determining biases related to a wide variety of postcopulatory processes. Acknowledgments Research was conducted under permits from the Bahamas Ministry of Agriculture and approval from the Dartmouth College Institutional Animal Care and Use Committee (protocol 07-0203). An award from the National Science Foundation (DEB 0816862 to R. Calsbeek) and funding from Dartmouth College provided financial support. We thank M. Najarro for the help with laboratory data collection. Genotypes were collected in the Molecular Biology and Proteomics Core Facility at Dartmouth College; we thank C. H. Lytle and S. A. Tyndall for their help with microsatellite fragment analysis. We thank M. A. McPeek and his graduate writing class for feedback on early versions of this manuscript. Ethical standards The experiments described in this manuscript comply with the current laws of the countries in which they were conducted. Conflict of interest The authors declare no conflict of interest.
References Andersson M (1994) Sexual selection. Princeton University Press, Princeton, NJ Bardeleben C, Palchevskiy V, Calsbeek R, Wayne RK (2004) Isolation of polymorphic tetranucleotide microsatellite markers for the brown anole (Anolis sagrei). Mol Ecol Notes 4:176–178 Bateman AJ (1948) Intra-sexual selection in Drosophila . Heredity 2:349–368 Beaumont MA, Zhang W, Balding DJ (2002) Approximate Bayesian computation in population genetics. Genetics 162:2025–2035 Benken T, Knaak A, Gack C, Eberle M, Peschke K (1999) Variation of sperm precedence in the rove beetle Aleochara curtula (Coleoptera: Staphylinidae). Behaviour 136:1065–1077 Birkhead TR, Hunter FM (1990) Mechanisms of sperm competition. Trends Ecol Evol 5:48–52 Birkhead TR, Møller AP (1998) Sperm competition and sexual selection. Academic, London Birkhead TR, Wishart GJ, Biggins JD (1995) Sperm precedence in the domestic fowl. P Roy Soc Lond B Bio 261:285–292 Calsbeek R, Bonneaud C (2008) Postcopulatory fertilization bias as a form of cryptic sexual selection. Evolution 62:1137–1148 Calsbeek R, Bonneaud C, Prabhu S, Manoukis N, Smith TB (2007) Multiple paternity and sperm storage lead to increased genetic diversity Anolis lizards. Evol Ecol Res 9:495–503 Carroll SP (1991) The adaptive significance of mate guarding in the soapberry bug, Jadera haematoloma (Hemiptera:Rhopalidae). J Insect Behav 4:509–530 Conner JK (1995) Extreme variability in sperm precedence in the fungus beetle, Bolitotherus cornutus (Coleoptera Tenebrionidae). Ethol Ecol Evol 7:277–280 Cook PA, Harvey IF, Parker GA (1997) Predicting variation in sperm precedence. Philos T Roy Soc B 352:771–780 Corley LS, Cotton S, McConnell E, Chapman T, Fowler K, Pomiankowski A (2006) Highly variable sperm precedence in the stalk-eyed fly, Teleopsis dalmanni. BMC Evol Biol 6:53 Cox RM, Calsbeek R (2010) Cryptic sex-ratio bias provides indirect genetic benefits despite sexual conflict. Science 328:92–94
Behav Ecol Sociobiol (2013) 67:1867–1875 Cox RM, Duryea MC, Najarro M, Calsbeek R (2011) Paternal condition drives progeny sex-ratio bias in a lizard that lacks parental care. Evolution 65:220–230 Darwin C (1871) The descent of man, and selection in relation to sex. Murray, London Eberhard WG (1996) Female control: sexual selection by cryptic female choice. Princeton University Press, Princeton, NJ Eggert A-K, Reinhardt K, Sakaluk S (2003) Linear models for assessing mechanisms of sperm competition: the trouble with transformations. Evolution 57:173–176 Evanno G, Madec L, Arnaud J-F (2005) Multiple paternity and postcopulatory sexual selection in a hermaphrodite: what influences sperm precedence in the garden snail Helix aspersa? Mol Ecol 14:805–812 Evans JP, Magurran AE (2001) Patterns of sperm precedence and predictors of paternity in the Trinidadian guppy. P Roy Soc Lond B Bio 268:719–724 Friedman N, Linial M, Nachman I, Pe'er D (2000) Using Bayesian networks to analyze expression data. J Comput Biol 7:601–620 Harano T, Nakamoto Y, Miyatake T (2008) Sperm precedence in Callosobruchus chinensis estimated using the sterile male technique. J Ethol 26:201–206 House C, Hunt J, Moore A (2007) Sperm competition, alternative mating tactics and context-dependent fertilization success in the burying beetle, Nicrophorus vespilloides. P Roy Soc Lond B Bio 274:1309– 1315 Jones AG, Adams EM, Arnold SJ (2002) Topping off: a mechanism of first-male sperm precedence in a vertebrate. Proc Natl Acad Sci USA 99:2078–2081 Kraaijeveld-Smit FJL, Ward SJ, Temple-Smith PD, Paetkau D (2002) Factors influencing paternity success in Antechinus agilis: last-male sperm precedence, timing of mating and genetic compatibility. J Evolution Biol 15:100–107
1875 Marshall TC, Slate J, Kruuk LEB, Pemberton JM (1998) Statistical confidence for likelihood-based paternity inference in natural populations. Mol Ecol 7:639–655 Moreira PL, Birkhead TR (2003) Copulatory plugs in the Iberian Rock Lizard do not prevent insemination by rival males. Funct Ecol 17:796–802 Olsson M, Madsen T (1998) Sexual selection and sperm competition in reptiles. In: Birkhead TR, Möller AP (eds) Sperm Competition and Sexual Selection. Academic, London, p 504 Parker GA, Pizzari T (2010) Sperm competition and ejaculate economics. Biol Rev 85:897–934 Pitcher TE, Neff BD, Rodd FH, Rowe L (2003) Multiple mating and sequential mate choice in guppies: females trade up. P Roy Soc Lond B Bio 270:1623–1629 Pritchard JK, Seielstad MT, Perez-Lezaun A, Feldman MW (1999) Population growth of human Y chromosomes: a study of Y chromosome microsatellites. Mol Biol Evol 16:1791–1798 Radder RS, Elphick MJ, Warner DA, Pike DA, Shine R (2008) Reproductive modes in lizards: measuring fitness consequences of the duration of uterine retention of eggs. Funct Ecol 22:332– 339 Simmons LW (2001) Sperm competition and its evolutionary consequences in the insects. Princeton University Press, Princeton, NJ Thornhill R (1983) Cryptic female choice and its implications in the scorpionfly, Harpobittacus nigriceps . Am Nat 122:765– 788 Venables W, Ripley B (2002) Modern applied statistics with S, 4th edn. Springer, New York Wade PR (2000) Bayesian methods in conservation biology. Conserv Biol 14:1308–1316 Zamudio K, Sinervo E (2000) Polygyny, mate-guarding, and posthumous fertilization as alternative male mating strategies. Proc Natl Acad Sci USA 97:14427–14432