Apr 6, 2017 - important creep compliance and overestimates the small creep compliance. In order to overcome this inaccuracy, new correction coefficients ...
International Journal of Civil and Structural Engineering Volume 4 : Issue 1 [ISSN 2372-3971] Publication Date : 6 April, 2017
Approximate Bayesian Computation Method: Update of the Eurocode 2 Creep model Deterministic and Probabilistic – Rejection Algorithm Approach [Zgheib E., Raphael W., Matar P., Moukarzel I., Faddoul R.] safety and the development of a reliability method that accounts for imperfect states of knowledge and recognizes all sources of uncertainty arising in structural problems. The Approximation Bayesian Computation method (ABC method) based on the rejection algorithm [3] will be applied in this study to introduce correction coefficients to the Eurocode 2 creep formulas.
Abstract— The deformation due to creep has an important effect on the behavior of concrete structures especially for their long term integrity. Undesirable consequences may appear in the structures due to incorrect or inaccurate prediction of creep deformation. A large database coming from international laboratories and research centers is used in order to compare the experimental results with the Eurocode 2 creep prediction. This study shows that the Eurocode 2 underestimates the important creep compliance and overestimates the small creep compliance. In order to overcome this inaccuracy, new correction coefficients are introduced to the formulas of the Eurocode 2 using an Approximate Bayesian Computation method based on the rejection algorithm. Keywords— concrete, creep, Approximate Computation method, strength, regression.
I.
II. A.
Evaluation of the Eurocode 2
Database
Starting from a large database coming from international laboratories and research centers such as RILEM, LCPC, CEBTP, and from the Northwestern University’s Infrastructure Technology Institute [4], a comparison is performed between the results obtained by laboratory testing and those given by the theoretical model as indicated in the Eurocode 2 – Annex B [5]. This database is composed of 1614 creep tests, each one having different properties including but not limited to water-to-cement ratio, cement type, concrete strength, effective thickness, age at loading, temperature, relative humidity, sustained stress, admixtures, etc. Since the admixtures influence the behavior of concrete, the tests with admixtures are separated from those without admixtures. Therefore, this study is based on 245 creep tests having different properties with no admixture added.
Bayesian
Introduction
In construction, the concrete is the most used material due to its strength, durability and workability. The concrete is a material that “lives in time”, it is subjected to deformations during his life. These deformations are classified into two categories: deformations due to shrinkage that are revealed without application of external loads and deformations that are manifested with application of external loads. The latter are divided into two types: instantaneous deformations that occur instantaneously when the load is applied and deformations due to creep that appear with time. The creep deformations have an important impact on the behavior, stability and durability of structures. An inaccurate creep analysis may cause excessive deflections, difficulties with closure or un-esthetic permanent deflections. Using a large experimental database provided by multinational research centers, a comparison between the experimental results and the Eurocode 2 prediction creep formulas is performed.
B.
Evaluation Methods
The creep compliance J(t,t0) is the time-dependent strain per unit stress. In order to evaluate the accuracy of the Eurocode 2 creep compliance prediction on the basis of the experimental tests, four methods have been applied, in which Obs Xij means the experimental creep compliance at time j of experiment i, Cal Xij, the predicted creep compliance at time j of experiment i, n the total number of measurement at fixed time j of experiment i, and N the total number of experiments.
The Bayesian updating is an advantageous method of analyzing experimental data [1,2]. Bayesian model assessment is essential for a good evaluation of structural
1) The Residual method The residuals Rij are calculated by the difference between the experimental compliance and the theoretical one, as given in the following equation:
Elise Zgheib Higher Institute of Engineering in Beirut (ESIB), Saint Joseph University Doctoral School of Sciences and Technology (EDST), Lebanese University Lebanon
Rij = (Obs Xij – Cal Xij). Wassim Raphael / Rafic Faddoul Higher Institute of Engineering in Beirut (ESIB), Saint Joseph University Lebanon
(1)
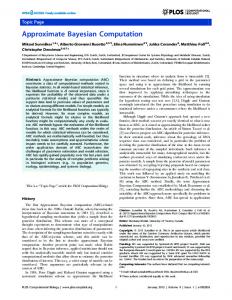
The graphical representation given by the scatter plot of Eurocode 2 residuals versus experimental creep compliance is shown in Fig. 1. The scatters located near the X-axis shows that the residual is close to zero and the prediction is accurate. The scatters located below the X-axis indicate that the model overestimates the creep compliance. Contrary, the
Pierre Matar / Ibrahim Moukarzel Doctoral School of Sciences and Technology (EDST), Lebanese University Lebanon
29
International Journal of Civil and Structural Engineering Volume 4 : Issue 1 [ISSN 2372-3971] Publication Date : 6 April, 2017 n
scatters located above the X-axis means that the model underestimates the creep compliance.
Yi
Si
VCEB
Fig. 1 shows clearly that before correction, the Eurocode 2 residuals increase linearly with the experimental creep compliance. This linearity is the most pronounced for the positive residuals, therefore, the more the experimental compliance increases, the more the residual increases, and then the difference between the experimental and theoretical compliance increases and the underestimation is more pronounced. In order to represent this linearity in an analytical equation, a linear regression is applied. Since Fig.1 shows that the linearity is more pronounced for J(t,t 0) > 250x10-6 MPa-1, then the linear regression will be applied for two categories, less than 250x10 -6 MPa-1 and more than 250x10-6 MPa-1.
,
n
,
(4)
,
(5)
Si 100 Yi ,
(6)
1 N 2 Vi N i 1
.
(7)
4) The FCEB method The FCEB method calculates the mean square error of the predicted values. By considering fj as the difference in percentage between the predicted and experimental values and FCEB as the mean square error, then the FCEB may be calculated by using the following formulas: fj
(CalX ij ObsX ij )
100
(ObsX ij )
Fi
1 n CalX ij n j 1 ObsX ij
ij
Small values of VCEB show that the predicted creep compliance are equal to the experimental creep compliance. In this study, we have obtained a VCEB = 197, which indicates that before correction the Eurocode 2 does not estimate accurately the creep compliance.
2) The MCEB method The MCEB method calculates an average gap and indicates if a model overestimates or underestimates systematically the experimental values. It may be calculated using the following formulas: Mi
j 1
n 1 2 Yij n 1 j 1
Vi
Figure 1. Eurocode 2 residuals versus experimental creep compliances (J(t,t0) in MPa-1).
Y
1 n 2 fj n 1 j 1
,
(8)
,
(9)
(2) FCEB
1 N 2 Fi N i 1
.
(10)
N
M CEB
Mi i 1
N
.
(3)
When the MCEB coefficient is near 1, the values of the predicted compliance are close to the experimental results. If the MCEB coefficient exceeds 1, this means that the Eurocode 2 overestimates the strains. Contrary, if the MCEB coefficient is less than 1, then the Eurocode 2 underestimates the strains. In this study, by using the entire database in order to validate the time-dependent variation of the Eurocode 2, we have obtained an MCEB = 1.54 before correction, which indicates that the Eurocode 2 overestimates the creep compliance.
Similar to VCEB, small values of FCEB show that the predicted creep compliance are equal to the experimental creep compliance. In this study, before correction, FCEB = 414.4, which indicates that the Eurocode 2 does not estimate accurately the creep compliance. C.
Division of the Creep Compliance in Categories
The division of the creep compliance in categories has been used effectively to study the impact of the range of the creep compliance. In their study [6], W. Raphael et Al. have divided the creep compliance into three categories: small creep compliance for 0 < J < 60x10 -6 MPa-1, medium creep compliance for 60x10-6 MPa-1 < J < 120x10-6 MPa-1 and important creep compliance for J > 120x10 -6 MPa-1. In this paper, based on the graphical representation of the residuals versus the experimental compliances, we have noticed that for the experimental compliances values less than 250x10 -6 MPa-1, the scatters are distributed around the X-axis with a concentration above the X-axis. But, for the experimental compliances values exceeding 250x10-6 MPa-1, the scatters behave linearly and follow a line with a positive slope.
3) The VCEB method The VCEB method calculates an average coefficient of variation in order to evaluate a model relatively to the experimental database. By considering Si as the standard error of Yij of experiment i, VCEB as the average coefficient of variation, Yi as the average value of creep of experiment i, Yij as the experimental creep at time j of experiment i, and Yij, as the difference between the experimental and predicted creep compliance at time j of experiment i, then the VCEB may be calculated using the following formulas: 30
International Journal of Civil and Structural Engineering Volume 4 : Issue 1 [ISSN 2372-3971] Publication Date : 6 April, 2017 Therefore, in this study, we have subdivided the creep compliance into two categories as follows: Small creep compliance (SC): J(t,t0) < 250x10-6 MPa-1.
Important creep compliance (IC): J(t,t0) > 250x10-6 MPa-1.
D.
S = 21.71916966 r = 0.85992971
Euroco de 2 re si dua ls (1 0 -6 MPa -1 )
2 residuals versus experimental creep compliances J exp scatter plot.
Eurocode 2 Creep Calculation
The creep compliance according to the Eurocode 2 is calculated based on the following equation: 1 (t , t0 ) J (t , t0 ) Ecm (t0 ) Ecm 2 8
.6 9
93. - 27
02
.6 4
8 .3
1
0.0
121.8
243.6
365.3
487.1
608.9
730.7
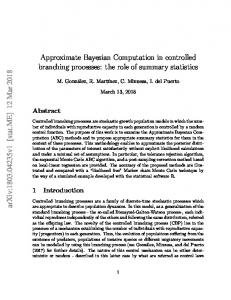
Eurocode 2 residuals versus experimental creep compliance quadratic fit (J in MPa-1).
Fig.2 shows that the Eurocode 2 residuals versus experimental creep compliance follow a quadratic equation:
Ecm (t0 ) is the modulus of elasticity of concrete at the
Residual = 6.28x10⁻⁴ Jexp 2 + 0.45 Jexp – 34,
Ecm 2 8 is the modulus of elasticity of the concrete at 28
Since the residual is the difference between the experimental and theoretical values, and by considering the experimental values as the corrected theoretical values, therefore, by substituting the residual with its expression and considering the Obs Xij = Jcorr and Cal Xij = JEC2, we found:
Approximate Bayesian Computation
III.
(12)
with a correlation coefficient r = 0.86.
φ(t,t0) is the creep coefficient.
(6.28x10⁻⁴) Jcorr2 – 0.55 Jcorr + JEC2 – 34 = 0,
The Bayesian calibration provides an automated process for calibrating models by multiplying the expert knowledge known as a priori distribution by the likelihood coming from the database [1,7]. Therefore, an a posteriori distribution will be defined, which will be an update of the knowledge already known by using the latest database provided. Different methods of Bayesian calibration may be used. In this study, the Approximate Bayesian Computation (ABC) rejection algorithm will be applied [3]. The ABC method is applied when the likelihood function is unknown, which is our case. The Approximate Bayesian Computation rejection algorithm is based on generating a random value for each correction coefficient following an a priori distribution [3]. For each random variable, the updated compliance is calculated and compared to the experimental compliance. If the difference between the updated and the experimental compliance is less than the threshold, then the random variable is accepted; if not, it is rejected. Once this procedure is applied, at the end we obtain a set of correction coefficient values following a known a posteriori distribution or an empirical a posteriori distribution.
A.
.3 5
J(t,t0) is the creep compliance,
The detailed calculation procedure is presented in the Eurocode 2 – Annex B [5]. E.
213
.0 2
Figure 2.
days after casting,
334
.6 8
Expérimental Compliance (10-6 MPa-1)
loading date t0 in GPa,
455
- 14
(11)
where:
575
(13)
with Jcorr x10-6 MPa-1 and JEC2x10-6 MPa-1. Therefore, knowing JEC2, which is the predicted creep compliance according to the Eurocode 2, and by substituting its value in (13), we can calculate the corrected creep compliance Jcorr After applying (13), a comparison between the corrected creep compliance and the experimental results was performed using the evaluation methods. TABLE I.
EVALUATION METHOD VALUES BEFORE AND AFTER QUADRATIC CORRECTION
Results Before Correction Results After Quadratic Correction
MCEB 1.54 1.35
VCEB 197 148
FCEB 414.4 384
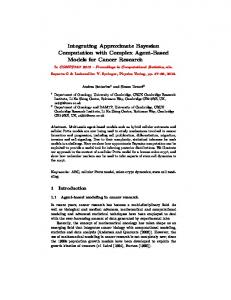
Table I shows that MCEB, VCEB and FCEB have decreased after correction. Therefore, the application of the quadratic correction results in an optimization of MCEB, VCEB and FCEB. As shown in Fig. 2, a linear behavior is the most pronounced for experimental compliances exceeding 250x10-6 MPa-1. Therefore, in order to study the linear behavior of the Eurocode 2 residuals versus the creep compliance for J(t,t0) > 250x10-6 MPa-1, a division of the tests between two categories was performed. Fig. 3 and Fig. 4 show the Eurocode 2 residuals versus experimental compliances for J(t,t0) < 250x10-6 MPa-1 (small creep compliance) and J(t,t0) > 250x10-6 MPa-1 (important creep compliance) respectively.
Results and Discussions
The Residual Method Results
In order to evaluate the best curve that fits the scatter plot of the residual values versus the experimental compliances, regressions were performed using curve expert. Fig. 2 below shows the best fit curve of the Eurocode
31
International Journal of Civil and Structural Engineering Volume 4 : Issue 1 [ISSN 2372-3971] Publication Date : 6 April, 2017 Jcorr = 16.31xJEC2 – 1564,
(17)
with Jcorr x10-6 MPa-1 and JEC2x10-6 MPa-1. This equation is applied for JEC2 > 111 (x10-6 MPa-1). TABLE III. EVALUATION METHOD VALUES BEFORE AND AFTER LINEAR CORRECTION FOR IMPORTANT CREEP COMPLIANCE CATEGORY Figure 1. Eurocode 2 residuals versus experimental creep compliance linear regression for J(t,t0) < 250*10-6 MPa-1.
Results Before Correction Results After Linear Correction
VCEB 55.7 36.8
FCEB 54.4 41.3
Table III shows that the MCEB value is almost equal to 1 after correction and the values of VCEB and FCEB have decreased after correction. Therefore, applying the above equation leads to a correction of the predicted values.
The equation relating the Eurocode 2 residuals to the experimental compliance for small creep category is: Residual = 0.5384xJexp – 35.841,
MCEB 0.5 0.97
(14)
with a correlation coefficient r = 0.73.
In order to evaluate these corrections on the entire database, a combination of the correction equations is performed as below:
By substituting the residual with its expression and considering the Obs Xij = Jcorr and Cal Xij = JEC2, we found:
Jcorr = 2.16xJEC2 – 77.64 for 36 < JEC2 < 152 (x10-6 MPa-1) (18)
-6 -1 (15) Jcorr = 16.31xJEC2 – 1564.37 for JEC2 > 152 (x10 MPa ) (19) After applying (18) and (19), a comparison between the -6 -1 -6 -1 corrected creep compliance and the experimental results was with Jcorr x10 MPa and JEC2x10 MPa . performed using the evaluation methods. This equation is applied for 36 < J EC2 < 152 (x10-6 MPa1 ). The results obtained by applying the above equation and TABLE IV. EVALUATION METHOD VALUES BEFORE AND AFTER comparing the corrected creep compliance to the COMBINED CORRECTION experimental values are shown in Table II.
Jcorr = 2.16*JEC2 – 77.64,
Results Before Correction Results After Combined Correction
TABLE II. EVALUATION METHOD VALUES BEFORE AND AFTER LINEAR CORRECTION FOR SMALL CREEP COMPLIANCE CATEGORY
Results Before Correction Results After Linear Correction
MCEB 1.54 1.37
VCEB 197 144
MCEB
VCEB
FCEB
1.54 1.38
197 145
414.4 386
Table IV shows that, after the combined correction, the MCEB, VCEB and FCEB have decreased from 1.54 to 1.38, from 197 to 145 and from 414.4 to 386 respectively.
FCEB 414.4 386
After the linear correction, MCEB, VCEB and FCEB have decreased from 1.54 to 1.37, from 197 to 144 and from 414.4 to 386 respectively.
B.
The Approximate Bayesian Computation method results
In order to study the accuracy of the creep coefficient ratio (t, t ) , a comparison between the experimental and 0
Ecm 2 8
theoretical values was performed for both compressive strength categories specified in the Eurocode 2, less and greater than 35 MPa. TABLE V. THE EVALUATION METHOD RESULTS BEFORE CORRECTION FOR EACH CREEP CATEGORY: SMALL CREEP AND IMPORTANT CREEP
Figure 3. Eurocode 2 residuals versus experimental creep compliance linear regression for J(t,t0) > 250x10-6 MPa-1.
Categories of Creep
The equation relating the Eurocode 2 residuals to the experimental compliance for important creep category is: Residual = 0.9387xJexp – 95.896
(16)
This equation describes confidentially the Eurocode 2 residuals versus the experimental creep compliance since the correlation coefficient (r) is near 1 (r = 0.98). Therefore, the residual values estimated by the equation meet the exact residual values calculated from the database. By substitution we found: 32
Creep Coefficient Ratio for fcm ≤ 35 MPa Creep Coefficient Ratio for fcm ≥ 35 MPa
MCEB
VCEB
FCEB
Small Creep Important Creep
1.67 0.48
132 60
393 58
Small Creep
1.16
125
191
Table V shows that the Eurocode 2 overestimates the small creep coefficient ratio for fcm ≤ 35 MPa and underestimates the important creep coefficient ratio for fcm ≤ 35 MPa. For fcm ≥ 35 MPa, the creep coefficient ratio is well estimated by the Eurocode 2. To overcome the difference in results between the experimental and theoretical values of the creep coefficient ratio for fcm ≤ 35 MPa, correction
International Journal of Civil and Structural Engineering Volume 4 : Issue 1 [ISSN 2372-3971] Publication Date : 6 April, 2017 coefficients are introduced to the Eurocode 2 equation as follow:
IV.
Conclusions
The first step in this study consists in a comparison between theoretical results and experimental database. For (t, t ) (t - t ) RH * (t - t ) 10 1 16.8*10 O * [(1 + )* ]* * * fcm fcm ≤ 35 MPa, the Eurocode 2 underestimates the important E [ (t t )] (0.1 t0 ) 22000 h 10* h * [ (t t )] (20) creep and overestimates the small creep. For fcm ≥ 35 MPa, the Eurocode 2 estimates accurately the creep coefficient With, O a global correction coefficient, and P a correction ratio. The approach used in the design codes is clearly coefficient for the strength of concrete due to its important insufficient for practical engineering structures. The errors impact on the creep. of ignorance and simplifications, and the measurement errors are the principal causes of code inadequacy. Two correction approaches were adopted in this study. The first TABLE VI. THE CORRECTION COEFFICIENT VALUES FOR EACH CREEP correction is based on a deterministic approach; quadratic CATEGORY and linear equations were deducted by regressions due to the Categories of Creep Correction Coefficients shape of the residual scatter plot versus the experimental O = 2.64 P = 1.47 Small Creep Creep Coefficient values. This correction does not take into consideration the Important Ratio for fcm ≤ 35 MPa O = 2.4 P = 0.97 simplification and measurements error, therefore, the Creep Bayesian updating approach was applied to the Eurocode 2, Table VI summarizes the correction coefficients obtained using Matlab and the experimental database. Correction by applying the Approximate Bayesian Computation method coefficients that are implemented in the Eurocode 2 on the creep coefficient ratio for fcm ≤ 35 MPa. We can formulas were calculated for the important and small creep notice that for the small creep category, the correction category for fcm ≤ 35 MPa. The Approximate Bayesian coefficients are O = 2.64 and P = 1.47. As for the important Computation rejection algorithm has proven to be an creep category, the correction coefficients are O = 2.4 and P effective solution for the improvement of the creep = 0.97. prediction according to the Eurocode 2. 0.3
0
cm 2 8
0.3
0
0
H
-0 .8* P
0
0.3
3
0 .3
0
0.3
3
0
H
0 .2
0
TABLE VII. THE EVALUATION METHOD RESULTS BEFORE AND AFTER APPROXIMATE BAYESIAN COMPUTATION CORRECTION FOR EACH CREEP CATEGORY Creep Coefficient Ratio for fcm ≤ 35 MPa Results Before Correction Small Creep Results After ABC Correction Results Before Correction Important Creep Results After ABC Correction
MCEB 1.67 1.23 0.48 1.23
VCEB 132 90 60 56
Acknowledgment The authors gratefully acknowledge Professors Zdeněk Pavel Bažant, Fabrice Guérin, David Bigaud and Mr. Hassen Riahi for their help. Many thanks go also to all persons from RILEM, LCPC and CEBTP and Northwestern University for their kind support for providing experimental data. This work has been supported by the National Council for Scientific Research, Lebanon (CNRS-L) and the Research Council of Saint-Joseph University of Beirut.
FCEB 393 272 58 55
Table VII summarizes the results of MCEB, VCEB and FCEB before and after correction of each creep category. We can notice that for the small creep category, although we have an overestimation of the creep coefficient ratio before and after correction, the mean deviation is closer to the expected value 1 by applying the correction coefficients O = 2.64 and P = 1.47. After this correction, VCEB and FCEB have decreased. As for the important creep coefficient, we have passed from an underestimation before correction to an overestimation after applying the correction coefficients O = 2.4 and P = 0.97. The VCEB and FCEB have decreased after this correction.
References [1] [2]
[3]
[4] [5] [6]
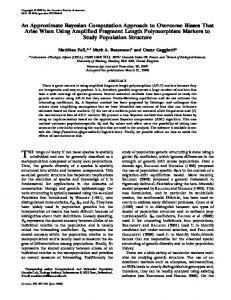
[7] Figure 4. The MCEB diagram for each creep category.
Fig. 5 shows the variation of the MCEB before and after applying the Bayesian correction. For small creep category the MCEB is nearer to the expected value 1 after correction. As for the important creep category, this correction leads to an overestimation instead of an underestimation of the creep coefficient ratio.
G. Box and G. Tiao, Bayesian Inference in Statistical Analysis, Wiley Classics Library Edition, 1992. A. Gandomi, S. Sajedi, B. Kiani, and Q. Huang, “Genetic programming for experimental big data mining: A case study on concrete creep formulation”, in Automat Constr, vol. 70, Elsevier, 2016, pp. 89-97. M. Robillart “Étude de stratégies de gestion en temps réel pour des bâtiments énergétiquement performants”, Thèse de doctorat de l’École Nationale Supérieure des Mines de Paris, Spécialité Énergétique, Paris, 2015. Z. P. Bažant, “Creep and shrinkage database”. EN 1992-1-1: Eurocode 2: Design of concrete structures – Part 1-1: General rules and rules for buildings, 2004. W. Raphael, A. Chateauneuf, M. Lemaire, J.L. Favre, J.A. Calgaro, and P. Peyrac, “Reliability based assessment of prestressed concrete structures subject to creep – Application to a bridge”, International Conference on Applications of Statistics and Probability in Civil Engineering, ICASP 9, Berkeley, USA, 2003. M. Riddle and R. Muehleisen, “A Guide to Bayesian Calibration of building energy models”, ASHRAE/IBPSA-USA Building Simulation Conference, Atlanta, GA, USA, September 10-12, 2016.
About Author (s):
[The concrete is a material that “lives in time”.]
33