A novel wavelet based algorithm for spike and wave detection in absence epilepsy Petros Xanthopoulos
Steffen Rebennack
Chang-Chia Liu
Jicong Zhang
Industrial and Systems Industrial and Systems J. Crayton Pruitt Family Department Industrial and Systems Engineering Department, Engineering Department, of Biomedical Engineering, Engineering Department, University of Florida, USA. University of Florida, USA. University of Florida, USA. University of Florida, USA. Email:
[email protected] Email:
[email protected]
Gregory L. Holmes
Basim M. Uthman
Panos M. Pardalos
Department of Neurology, Weill Cornell Medical College in Qatar, Industrial and Systems Engineering Department and Dartmouth Medical School Doha, Qatar. Biomedical Engineering Department, Hanover NH, USA. University of Florida, USA. Corresponding author Email:
[email protected] Abstract—Absence seizures are characterized by sudden loss of consciousness and interruption of ongoing motor activities for a brief period of time lasting few to several seconds and up to half a minute. Due to their brevity and subtle clinical manifestations absence seizures are easily missed by inexperienced observers. Accurate evaluation of their high frequency of recurrence can be a challenge even for experienced observers. We present a novel method for detecting and analyzing absence seizures acquired from electroencephalogram (EEG) recordings in patients with absence seizures. Six patients were included in this study; two seizure free, of a total recording time of 26 hours, and four experiencing over 100 seizures within 14.5 hours of total recordings. Our algorithm detected only one false positive finding in the first seizure free patients and 148 of 186 continuous uninterrupted 3Hz spike and wave discharge (SWD) epochs in the rest of the patients. Out of the total 38 missed SWD epochs 28 were ≤ 2.1 sec in duration. The remaining epochs included interrupted 3Hz SWDs. Our proposed algorithm offers an efficient automatic detection scheme that can be used in diagnostic and therapeutic evaluations in patients with absence seizures.
I. I NTRODUCTION The term “petit mal” was coined by physicians and attendants in hospitals of the grand city Paris early in the 19th century and “absence” was introduced by Calmeil in 1824 [1]. The first term underscores the lack of convulsions normally associated with “grand mal” seizures; a major factor contributing to the confusion between complex partial seizures (seizures of focal onset) and typical absence seizures (bihemispheric activity from onset). The two terms, “petit mal” and “absence”, may be complimentary; however, the latter may better describe symptomatology of the seizures that manifest as brief episodes of loss of consciousness and responsiveness. Absence seizures are few to several seconds long and it is not unusual that they are easily missed even by experienced witnesses such as parents and teachers. Furthermore, individuals may experience hundreds of absence seizures each day resulting in poor performance at school and interfering with their quality of life. Anti-epileptic
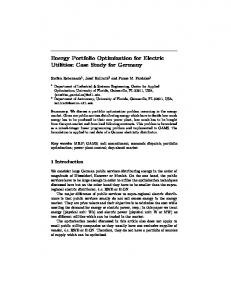
drug (AED) treatments usually prevent and control the recurrence of absence seizures [2]. In current clinical trials, counting seizure frequency has been, traditionally, the most commonly used method in evaluating the efficacy of drug or other interventional therapy in the treatment of seizure disorders in general. This method is tedious and plagued with several sources of measurement errors including rater accuracy, rater and inter-rater reliability, experience of raters (usually family members or other companions of witnessing patients’ seizures) and erratic vigilance of observers. Owing to the brevity, subtlety and frequency of absence seizures in particular, these factors are magnified making the method of counting seizures by layman observers unreliable at best. The electroencephalogram (EEG) is usually used as a tool to support the diagnosis of seizures and their types but not for quantifying their occurrence. In absence seizures, the EEG offers a great opportunity to measure and compare the quantity of seizure activity during a finite period of time before and during interventional therapy. A typical absence seizure, for human beings, is characterized by generalized and bilaterally synchronous 3Hz spike and wave discharges (SWD) 5 to 20 seconds long in duration [1]. Like in most generalized epilepsies, SWD in absence seizures is maximal over the fronto-central midline and may start at a rate of around 4/sec, quickly slow down to 3-3.5/sec, and during the final phase of the absence, slow to about 2.5/sec [1]. Fig.1 shows a typical absence seizure time frequency spectrum. In current clinical studies of absence seizures, continuous 24hr EEG recordings are suggested when evaluating the efficacy of different AED treatments. Manual scoring of absence seizures is done by experienced qualified clinicians. This process is subject to clinicians expertise, fatigue (neurologist should take brakes during scoring process) and manual recording errors. This process is time consuming and tedious; it takes around 4 hours to score 4.5 hours of seizure blue and around
Fig. 1. Time frequency plot for a typical absence seizure. Absence seizure lasts something more than 5 sec and the spike an wave activity has maximum power in the band of 3 Hz (Indicated by bold red line). X axis is in seconds and Y axis is in Hz.
2.5 hours for a 24 hrs seizure free subject. Because of these factors, manual EEG scoring is also quite expensive. Since marking the absence seizure in long term EEG recordings manually is a time consuming task, especially if one is interested in the number of occurrences and durations for each absence seizure, an automatic absence seizure detection method is highly desired. Several detection methods have been reported previously in both human and animal models. Based on the method used we can classify absence seizure detection algorithms in the following categories: 1) Absence detection algorithms that use the information extracted from changes in the amplitude (magnitude) of the EEG signal when SWD occurs. 2) Detection based on monitoring the energy power in the frequency bands which SWD occupied 3) Combination of the first two methods together into labeling the SWD activities in the EEG recordings. The threshold, overlapping window technique and band pass filter are commonly used for enhancing the performance of the detection algorithm. In an animal model, Westerhuis et al. in [3], introduced an automatic SWD detector based on the first derivative of EEG signals, called the steepness of the signals. The SWD are detected if the value of teepness exceeds the threshold value in certain consecutive EEG epochs. In spite of the the reported high accuracy of this method it sometimes misclassifies eye movement artifacts as absence seizures. Fanselow et al. [4] described a method based on the maximum absolute value of the EEG amplitude in the rat model; the SWD in the EEG recordings were labeled if the amplitude is greater than the threshold for some manually defined time horizon. Again, this method cannot distinguish between high amplitude artifacts. A so-called spectral-comb based analysis method was proposed
by Hese et al. [5] for detecting the SWD in Strasbourg (GAERS) rat animal EEG recordings. The authors used the time frequency spectrum, produced by Short Time Fourier Transform (STFT), in order to extract some features that enable seizure detection. More recently, [6], [7] used linear models and artificial neural network for detecting absence seizure in a data set that contains twenty absence seizures acquired from five patients. Of note, the performance of a neural network highly depends on the training dataset meaning that one needs to choose “wisely” a “good” training dataset that will be used. This makes artificial neural network’s performance dependent on users’ expertise. In this paper, we present a robust absence seizure detection algorithm based on the spectral characteristics of the seizure. Wavelet transform based estimates have been successfully used by several groups for seizure detection and determination of seizure onset time [8], [9], [10]. Wavelet transform can be seen as a generalization of STFT. Wavelets extract the original signal into scales that can be mapped into different pseudofrequencies. The advantage over STFT transform is that with wavelets arbitrary resolution both in time and in frequency can be achieved. A variance technique is applied subsequently for localizing the absence seizure. The remainder of the paper is organized as follows: in section 2, we describe the EEG data information acquired from patients with typical absence seizures. In section 3, we present our approaches for detecting the absence seizures in detail. We present the computational results, evaluation of performance and comparisons with other methods in section 4. In section 5, the clinical and theoretical implications of the results are discussed. II. DATA I NFORMATION Ambulatory EEG recordings in this study were acquired from 6 children < 13 years of age; two seizure free (24 hours and 2 hours correspondingly) and 4 experiencing seizures (4 of two hours and one of 4.5 hours). Subjects were instructed to go about their normal life as usual while EEG recording was ongoing avoiding any type of activity that might result in the loosening or removal of electrodes from the scalp or result in excessive recording artifacts, e.g., gum chewing. The recordings were performed using a portable SleepMed recording device that allowed patients to move freely. The patients were at their home while the recordings took place. The international 10-20 electrode placement system with 19 electrodes was used and the following 16 bipolar channels were chosen: Fp1-F3, F3-C3, C3-P3, P3-O1, Fp2-F4, F4-C4, C4-P4, P4-O2, Fp1-F7, F7-T3, T3-T5, T5-O1, Fp2-F8, F8-T4, T4-T6, T6-O2. Data points were collected at a sampling rate of 200 Hz for each channel. EEG recordings were scored by a board certified electroencephalographer noting the duration of each SWD from onset to offset to one decimal point of a second. Operationally we counted two separate epochs of SWD complexes as one event when the inter-epoch duration was < 1 sec.
III. M ETHOD A. Wavelet decomposition Computational methods including signal processing, data mining and optimization are gaining ground in biomedical data analysis and neuroscience [11], [12], [13], [14]. Wavelet decomposition has profound advantages over the classical Short Time Fourier Transform analysis because one can increase the frequency resolution in the frequency band of interest (in our case, the delta band ∼ 3Hz) while maintaining the same time resolution. It is very especially useful in detecting absence seizures because these spike and wave discharges (SWDs) are restricted to a 2.5-4.5 Hz narrow frequency window. We decomposed each bipolar channel of the recording using the Continuous Wavelet Transform (CWT) formula: Z +∞ ∗ C(t, a, b) = x(t)ψa,b (τ )dτ (1) −∞
√1 ψ( τ −b ) a α
where ψa,b (τ ) = is the mother wavelet function and * denotes the complex conjugate operation. The mother wavelet for Morlet wavelet used has the analytic expression τ2 given by ψ(τ ) = e 2 cos(5τ ). Morlet mother wavelet is extensively used in EEG analysis due to its minimum time - bandwidth product, it’s infinite differentiation and it has an explicit expression [15]. Fc We can transform scales into frequencies using Fa = α∆ where Fa is the frequency that corresponds to the scale α, Fc is the central mother wavelet frequency (for the Morlet mother 1 sec is the wavelet that we used Fc is 0.81 Hz and ∆ = 200 EEG’s sampling period). For the purpose of our application we used the scales 36:46 that correspond to the frequency bands of interest 2.5-4.5Hz. For the raw EEG recording consisting of M=16 channels and N sample points sampled at fs = 200Hz we computed the CWT. In this context wavelet is used as a band pass filter by keeping the scales of interest and rejecting all the rest. The proposed algorithm was implemented in MATLAB environment and the wavelets involved were computed using the cwt() function with the mother wavelet parameter set to ‘morl’. B. Sliding Variance Technique Based on the observation that during the absence seizures, variance of the wavelet decomposed signal increases rapidly, we propose the following algorithm for absence seizures detection. We compute the variance profile for each channel by using a moving window of length k samples. We use k = 200 samples that corresponds to 1 sec. For every wavelet filtered channel that can be seen as a time series of N sample points X = [x1 , x2 , . . . , xN ], we compute the (k) sample variances Vi that correspond to the sets wi = {xj ∈ X|j ≥ i, j < i + k} for i = 1, . . . , k and we compute the (k) variances Vi = V ar(wi ). After the variance calculation we can add the variance profiles for all channels (averaging is a known technique that amplifies characteristics common for all
channels and cancels noise) and then we can perform threshold (for details see next section) since the time intervals that contain seizure activity have relatively high values of variance. Thus a series of consecutive ones in the indicator function 1{Vi >P } (where P is some threshold) suggests the presence of absence seizure activity. The first and the last 1 in such a series corresponds to seizure onset and offset, respectively. A pseudocode description of the proposed algorithm is given below. Algorithm III.1 Sliding Variance Technique (SVT) Require: EEG recording X m with N sample points for each M channels m Parameters: high threshold, low threshold, sample size k Ensure: onset and offset of all detected seizures 1: 2: 3: 4: 5: 6: 7: 8: 9: 10: 11:
Continuous Wavelet Transformation: for all channel m do call Y m = CWTA(X m , αlow , αhigh , β) end for Variance Computation: for all channel m do for time windows i with k samples do compute variance vim end for end for P sum the variances: vi = m vim
16:
SWD Epoch Detection: for vi ≥ high threshold do onset = closest right point j where vj ≤ low threshold offset = closest left point j where vj ≤ low threshold end for
17:
Merge SWD Epochs with a distance of less than 1 sec.
18:
return all detected SWD Epochs.
12: 13: 14: 15:
Function III.2 CWTA(X m , αlow , αhigh , β) 1: 2: 3: 4:
for j = αlow to j = αhigh with step β do compute Yj with formula (1) for j end for P return Y m = j Yj .
To avoid detecting artifacts that appear in the frequency band of interest we used double thresholding. First we perform thresholding with a higher threshold (defined by the maximum variance value during a seizure) in order to detect the seizure and then for every seizure detected we perform a local search for the seizure onset and offset with a lower threshold. This second threshold can be estimated from the variance value between the onset and the offset for some known examples. We note that in the MATLAB environment the algorithm needs 163 sec in order to process and store 30 min of
recordings. Experiments were performed on a laptop with Pentium duo 2.00GHz with 1Gb of memory. IV. R ESULTS All the EEG recordings were carefully reviewed by a clinically experienced board certified electroencephalographer. The labeling of SWD was done separately and independently prior to applying our algorithm. The onset and offset of each epoch of continuous 3 Hz SWD were recorded to the nearest first decimal utilizing digital time stamped by the EEG acquisition machine. We defined operationally any typical 3Hz SWD interrupted by less than one second intervals as one epoch of 3Hz SWD. We subtracted onset from offset times to obtain duration of each epoch in seconds. Durations of all epochs obtained by manual scoring were compared to durations of matching epochs detected by our algorithm. For the two seizure-free EEG recordings, the algorithm produced only one false positive as shown in Fig. 2. It is worth mentioning that multiple sources of false positivity such as chewing artifacts, eye movement artifacts, vertex waves, sleep spindles and others have occurred frequently during the 26h recordings analyzed. Our algorithm rejected all these artifacts and reported only one false positive epoch that was 2 sec in duration. This epoch was reexamined by the electroencephalographer and confirmed to be an artifact.
Fig. 3. These are the three missed seizures of length 4.1, 3.3 and 3.1. As someone can see in these three seizures there is gap of less than one second therefore they are classified as seizures. Red lines indicate seizure onset and offset (according to manual scoring). X axis is in seconds and Y is in µV .
In total, the percentage of error in terms of number of seizures is: #missed 38 100% = 100% = 20.43% #missed + #detected 186 (2) If we compute the error in terms of missed SWD time versus total SWD time we have that:
Error =
time missed 100% = 5.61% time missed + time detected (3) The fact that the second error percentage is much lower indicates that the majority of the missed epochs are of short length. For the first/second line, the error percentage is calculated via in Table I respectively if only the epochs (missed and detected) longer than E seconds (E=1,1.5,2,3,4,5) are considered. Error =
TABLE I P ERCENTAGE ERROR AS A Fig. 2. One channel of false positive detected for seizure free patient. Artifact lies in the ∼ 3Hz band and the same artifact appeared in many channels. Red lines indicate the onset and offset detected by the algorithm. The second patient with total 4.5 hours of recordings the algorithm only missed totally 30 SWD epochs.
Some examples of missed epochs, that include interrupted 3Hz SWDs, are shown in Fig. 3. The inability of the algorithm to detect short epochs lies in the variance window parameter. If the window becomes too small then the algorithm will be more sensitive to small changes but also easier to detect short slow artifacts as SWD epochs. On the other hand, if the variance window becomes too long (in samples) its easy to miss epochs shorter than the window length. The choice of one second window was chosen based on the fact that we don’t “care” about short SWD events since they don’t produce clinically visible results. In case that we are interested in such epochs then some automatic spike sorting algorithm should be employed. The algorithm detected successfully 148 SWD epochs.
% missed seizures %missed seizure duration
FUNCTION OF
SWD EPOCH ( IN SECONDS )
>1
> 1.5
>2
>3
>4
>5
20
10.94
5.13
2.75
0.97
0
5.61
3.51
2.04
1.31
0.52
0
For the successfully detected events we computed the error both in terms of number of samples and duration (seconds) between the onset and offset (Table II). Also we computed the error for the total detected onsets and offsets (Table (III)). TABLE II E RROR FOR ONSET AND OFFSET FOR THE DETECTED SEIZURES .
Mean Std
Onset # samples time (sec) 66.48 0.33 60.70 0.30
Offset # samples time (sec) 81.94 0.41 101.13 0.51
We also present the false positives detected for the second patient. In total seven 7 false positives were detected (see
TABLE III E RROR FOR THE TOTAL DURATION OF THE DETECTED SEIZURES
Mean Std
Error # samples 65.74 92.62
Error seconds 0.33 0.46
TABLE IV C OMPARATIVE RESULTS OF THE S LIDING VARIANCE T ECHNIQUE (SVT) AND OTHER DETECTION ALGORITHMS . Recording length(hrs) SVT 24 (ns) 4.5 2 2 2 (ns) 2 Fig. 4. Electrode artifacts detected as SWD epochs. Red lines indicate algorithms onset and offset. Potential way to reject these false positives automatically is spike scoring among the detected epochs. X axis is time in seconds. Of 150 manually scored 3 Hz SWD epochs in patient 2 our program detected 120, 27 of the 30 missed epochs were ≤ 2.1 sec. All missed epochs more that 3 seconds long turned out to be fragmented 3 Hz SWD with interruptions of ≤1 sec; episodes that we defined operationally as one epoch of 3Hz SWD. X axis is in seconds and Y is in µV .
Fig.4). These false positives were due to high amplitude electrode artifacts. On average, the mean duration of the detected artifacts was 2.22 seconds with standard deviation of 0.62 seconds. We compare the proposed algorithm detection performance with two other detection methods in the literature [4], [16]. The idea behind the first method was to find thresholds for each recordings that were high enough to identify seizures in the recordings. The low-pass filter at 30 Hz was first applied to our data in order to decrease the high frequency noise embedded in the recordings. The magnitudes of the thresholds were manually selected for different recordings and were set to about three to five times larger than the average of the background activities. The second approach is to calculate the energy of the recordings. During the seizure intervals, the sudden changes in the signal energy can be used for detecting the abnormal seizure activity in the recordings [16]. In this study, we used the Teager energy operators (TEO) to detect the energy changes during seizure intervals [17]. Results are shown in Table IV. The proposed algorithm can combine high detection rates (order 95%) with low false positive rates (12.3% max). On the other side the other two algorithm although they might demonstrate high detection rate they detect a significant number of false positive epochs. This dicreases their practical usefulness. Note that for seizure free patients detection rate is not defined. Every line of the table corresponds to a different patient. V. D ISCUSSION
AND
C ONCLUSIONS
Due to the brevity and subtle manifestations, absence seizures can be easily missed by inexperienced observers
94.39 95.33 100 100
Detection rate % Fanselow et al. 8.64 96.26 100 84.29
TEO
SVT
100 53.2 48.10 38.10
0.08 2.33 0 0 0 13.40
false detection rate (sec/hr) Fanselow et al. 28.68 40.54 37.47 0 5.93 30.80
TEO 46.59 86.10 51.33 30.32 25.11 40.11
and they are challenging to detect even for experienced medical staff. Long term EEG recordings capturing 3 Hz SWD provide an accurate account of all typical discharges occurring the recording. Due to frequent recurrence accurate quantification of absence seizures can be a tedious task even to the most experienced electroencephalographer. Multiple factors influencing the electroencephalographer’s performance include fatigue, distraction and errors in tabulating times of onset and offset of SWD epochs. Interater variability can be another source of inconsistent results. Algorithm capable of automatic detection of SWD epochs would be most useful in quantifying their occurrence. Our SVT algorithm detected clinically significant 3 Hz SWD epochs with high sensitivity and precision. It detected only one false positive epoch in patient one and 97.25 % of all 3Hz SWD ≥ 3 sec long in patient 2. The sensitivity on our proposed SVT algorithm is related to the length of the sliding window. Smaller window length leads to higher sensitivity and higher chance for false positive detection whereas larger window lengths result in low resolution and lower chance for false positive detection. The window length in this study was optimized to yield highest sensitivity and specificity for this particular SWDs. Previous work in rats using different methods demonstrated high incidence of false positive detection due to artifacts [3], [4], [5]. Alkan et al. [6], [7] used linear models and artificial neural networks for detecting absence seizures in a data set that contained twenty absence seizures acquired from five patients. While Alkan’s method has high sensitivity in detecting absence seizures in his dataset artificial neural networks are highly dependent on the training set and may not be suitable for other datasets. In this preliminary study our SVT algorithm detected 97.25 % of all clinically significant absence seizures with minimal false positive detections. Further testing of the SVT method is underway. We believe our algorithm has a promising role in in efficient and effective evaluation of therapeutic interventions
in absence seizures. ACKNOWLEDGMENT This work was partially supported by NSF and Air Force grants. The authors would like to acknowledge NEFRE Inc. for their support of this study. We also would like to acknowledge the Department of Veterans Affairs through the North Florida Foundation for Research and Education for their support. R EFERENCES [1] L. da Silva, Ed., Electroencephalography: Basic Principles, Clinical Applications and Related Fields. Urban&Schwarzenberg, 1987. [2] D. L. S. Steven C. Schachter, Ed., The Comprehensive Evaluation and Treatment of Epilepsy: a practical guide. Academic Press, 1997. [3] V. S. W. Westerhuis F and V. L. G, “Automatic detection of spike-wave discharges in the cortical eeg of rats,” Measuring Behavior ’96, Int. Workshop on Methods and Techniques in Behavioral Research, trecht, The Netherlands 16-18 Oct. 1996. [4] E. E. Fanselow, A. P. Reid, and M. A. L. Nicolelis, “Reduction of pentylenetetrazole-induced seizure activity in awake rats by seizuetriggered trigeminal nerve stimulation,” The Journal of Neuroscience, vol. 20, pp. 8160–8, 2000. [5] P. V. Hese, J.-P. Martens, P. Boon, S. Dedeurwaerdere, I. Lemahieu, and R. V. de Walle, “Detection of spike and wave discharges in the cortical eeg of genetic absence epilepsy rats from strasbourg,” Physics in Medicine and Biology, vol. 48, pp. 1685–700, 2003 Jun. [6] A. Alkan, E. Koklukaya, and A. Subasi, “Automatic seizure detection in eeg using logistic regression and artificial neural network,” Journal of Neuroscience Methods, vol. 148, pp. 167–176, 2005. [7] Alkan, Ahmet, and M. K. Kiymik, “Comparison of ar and welch methods in epileptic seizure detection,” Journal of Medical Systems, vol. 30, pp. 413–419, 2006. [8] I. Osorio, M. G. Frei, and S. B. Wilkinson, “Real-time automated detection and quantitative analysis of seizures and short-term prediction of clinical onset,” Epilepsia, vol. 39(6), pp. 615–627, 1998. [9] Y. Khan and J. Gotman, “Wavelet based automatic seizure detection in intracerebral electroencephalogram,” Clinical Neurophysiology, vol. 114, pp. 898–908, 2003. [10] I. Osorio, M. G. Frei, S. Sunderam, J. Giftakis, N. C. Bhavaraju, S. F. Schaffner, and S. B. Wilkinson, “Automated seizure abatement in humans using electrical stimulation,” Annals of Neurology, vol. 24, pp. 258–268, 2005. [11] W. A. Chaovalitwongse, P. Pardalos, and P. Xanthopoulos, Eds., Computational Neuroscience. Springer, 2010. [12] P. P. O. Seref, O. E. Kundakcioglu, Ed., Data Mining, Systems Analysis and Optimization in Biomedicine. Springer, 2008. [13] P. Pardalos, V. Boginski, and A. Vazakopoulos, Eds., Data Mining in Biomedicine. Springer, 2007. [14] P. Pardalos, C. Sackellares, P. Carney, and L. Iasemidis, Eds., Quantitative Neuroscience. Kluwer Academic Publishers, 2004. [15] N. Ahuja, S. Lertrattanapanich, and N. Bose, “Properties determining choice of mother wavelet,” Vision, Image and Signal Processing, IEE Proceedings, 2005. [16] M. Atit, J. Hagan, S. Bansal, R. Ichord, R. Geocadin, C. Hansen, D. Sherman, and N. Thakor, “Eeg burst detection: performance evaluation,” vol. 1, pp. 441 vol.1–, 1999. [17] J. Kaiser, “Some useful properties of teager’s energy operators,” Acoustics, Speech, and Signal Processing, IEEE International Conference on, vol. 3, pp. 149–152, 1993.