Oct 7, 2014 - elization of the ship hull is used as input to impose body- boundary conditions ..... DTMB measurements, NFA predictions, and Das Boot predic- tions are ... the breakup of a turbulent spray sheet illustrate a novel application of.
27th Symposium on Naval Hydrodynamics Seoul, KOREA, 5 – 10 October 2008
A Numerical Formulation for Simulating Free-Surface Hydrodynamics
arXiv:1410.2240v1 [physics.flu-dyn] 7 Oct 2014
Thomas T. O’Shea, Kyle A. Brucker, Douglas G. Dommermuth, and Donald C. Wyatt Naval Hydrodynamics Division, Science Applications International Corporation, 10260 Campus Point Drive, MS C5, San Diego, CA 92121
Abstract Cartesian-grid methods in combination with immersedbody and volume-of-fluid methods are ideally suited for simulating breaking waves around ships. A surface panelization of the ship hull is used as input to impose bodyboundary conditions on a three-dimensional cartesian grid. The volume-of-fluid portion of the numerical algorithm is used to capture the free-surface interface, including the breaking of waves. The numerical scheme is implemented on a parallel computer. Recent improvements to the numerical scheme are discussed, including implementation of a new multigrid procedure and conversion to MPI communication. Numerical predictions are compared to laboratory measurements of a towed transomstern model.
Introduction Fu, Fullerton, Ratcliffe, Minnick, Walker, Pence & Anderson (2008b) have performed towing-tank experiments for a canonical transom-stern model for four different tow speeds. The objectives of the experiments are to improve understanding of transom-stern flows, provide validation of CFD methods, provide validation of a new transom-stern theory, and provide input to bubble modeling. The laboratory measurements include free-surface elevations using surface imaging techniques and wavecut methods, void fraction, bubble size and velocities, flow velocities, and turbulence including the formation of coherent structures. Preliminary laboratory results are compared to numerical predictions using the Numerical Flow Analysis (NFA) code. There is good agreement between measurements and predictions for drag force and wave cuts. The NFA code provides turnkey capabilities to model breaking waves around a ship, including both plunging and spilling breaking waves, the formation of spray, and the entrainment of air. NFA uses a cartesiangrid formulation with immersed-body and volume-offluid (VOF) methods. The governing equations are formulated on a cartesian grid thereby eliminating compli-
cations associated with body-fitted grids. The sole geometric input into NFA is a surface panelization of the ship hull. No additional gridding beyond what is already used in potential-flow methods and hydrostatics calculations is required. The ease of input in combination with a flow solver that is implemented using parallel-computing methods permit the rapid turn around of numerical simulations of complex interactions between free surfaces and ships. Details of the numerical formulation are provided in Dommermuth, O’Shea, Wyatt, Sussman, Weymouth, Yue, Adams & Hand (2006) and Dommermuth, O’Shea, Wyatt, Ratcliffe, Weymouth, Hendrikson, Yue, Sussman, Adams & Valenciano (2007). Recent enhancements to NFA include a new multigrid solver that improves the rate of convergence of the flow solver and new MPI communication algorithms that improve communication between processors on a parallel computer. These two improvements are a step toward simulating very large CFD problems with order one billion grid points. This grid resolution is required to span the wide range in scales in both space and time that characterize the current generation of naval ships. The results of several other NFA simulations are reported in the proceedings of this symposium. Fu, Fullerton, Brewton, Brucker & Dommermuth (2008a) perform preliminary studies of wave impact. NFA predictions of a plunging breaking wave agree very well with measurements for free-surface elevations and water-particle velocities. Ratcliffe, Minnick, O’Shea, Fu, Russell & Dommermuth (2008) continue their earlier studies of incident waves interacting with towed model. Numerical predictions of the diffracted waves agree with QViz measurements in the bow region for a high-speed case with a large incident wave. Wyatt, Fu, Taylor, Terrill, Xing, Bhusan, O’Shea & Dommermuth (2008) compare fullscale lidar measurements of the rooster-tail region behind the R/V Athena to numerical predictions using NFA. Mean free-surface elevations are in good agreement, but free-surface spectrums differ at higher frequencies.
with no mixing of air and water, H is a step function. In practice, a mollified step function is used to provide a smooth transition between air and water.
Formulation Consider turbulent flow at the interface between air and water. Let ui denote the three-dimensional velocity field as a function of space (xi ) and time (t). The coordinate system is fixed. For an incompressible flow, the conservation of mass gives ∂ui =0 . ∂xi
A no-flux condition is imposed on the surface of the ship hull: ui ni = vi ni
vi is the velocity of the ship. vi includes the effects of rigid-body translation and rigid-body rotation. ni denotes the normal to the ship hull that points into the fluid.
(1)
ui and xi are normalized by Uo and Lo , which denote the free-stream velocity and the length of the body, respectively.
As discussed in Dommermuth et al. (1998), the divergence of the momentum equations (3) in combination with the conservation of mass (1) provides a Poisson equation for the dynamic pressure:
Following a procedure that is similar to Rider, Kothe, Mosso, Cerutti & Hochstein (1994), we let φ denote the fraction of fluid that is inside a cell. By definition, φ = 0 for a cell that is totally filled with air, and φ = 1 for a cell that is totally filled with water.
∂ 1 ∂P =Σ , ∂xi ρ ∂xi
(2)
N UMERICAL T IME I NTEGRATION
Q is a sub-grid-scale flux that can model the entrainment of gas into the liquid. Dommermuth, Innis, Luth, Novikov, Schlageter & Talcott (1998) provide an example of a sub-grid model. Since the present formulation maintains a sharp interface, Q = 0.
Based on Sussman (2003a), a second-order RungeKutta scheme is used to integrate with respect to time the field equations for the velocity field. Here, we illustrate how a volume of fluid formulation is used to advance the volume-fraction function. Similar examples are provided by Rider et al. (1994). During the first stage of the Runge-Kutta algorithm, a Poisson equation for the pressure is solved: � k � ∂ 1 ∂P ∗ ∂ ui + Ri = , (8) ∂xi ρ(φk ) ∂xi ∂xi ∆t
Let ρ` and µ` respectively denote the density and dynamic viscosity of water. Similarly, ρg and µg are the corresponding properties of air. The flows in the water and the air are governed by the Navier-Stokes equations: dui ∂ 1 ∂P + (uj ui ) = − dt ∂xj ρ ∂xi ∂τij δi3 1 ∂ (2µSij ) − 2 + , + ρRe ∂xj Fr ∂xj
where Ri denotes the nonlinear convective, hydrostatic, viscous, sub-grid-scale, and body-force terms in the momentum equations. uki and ρk are respectively the velocity components at time step k. ∆t is the time step. P ∗ is the first prediction for the pressure field.
(3)
where Re = ρ` Uo Lo /µ` is the Reynolds number and Fr2 = Uo2 /(gLo ) is the Froude number. g is the acceleration of gravity. P is the pressure. δij is the Kronecker delta function. τij is the subgrid-scale stress (SGS) tensor. An example of a SGS closure for the convective terms is provided by Dommermuth et al. (1998). Sij is the deformation tensor: � � 1 ∂ui ∂uj Sij = + . (4) 2 ∂xj ∂xi
For the next step, this pressure is used to project the velocity onto a solenoidal field. The first prediction for the velocity field (u∗i ) is � � 1 ∂P ∗ (9) u∗i = uki + ∆t Ri − ρ(φk ) ∂xi The volume fraction is advanced using a volume of fluid operator (VOF): � φ∗ = φk − VOF uki , φk , ∆t (10)
ρ and µ are respectively the dimensionless variable densities and viscosities: ρ(φ) = µ(φ) =
λ + (1 − λ)H(φ) η + (1 − η)H(φ) ,
(7)
where Σ is a source term. As shown in the next section, the pressure is used to project the velocity onto a solenoidal field. If Q 6= 0 in equation (2), then Σ includes a sink-like term that accounts for mass diffusion.
The advection of φ is expressed as follows: ∂ ∂φ ∂Q + (uj φ) = , ∂t ∂xj ∂xj
(6)
A Poisson equation for the pressure is solved again during the second stage of the Runge-Kutta algorithm: � ∗ � ∂ 1 ∂P k+1 ∂ ui + uki = + R (11) i ∂xi ρ(φ∗ ) ∂xi ∂xi ∆t
(5)
where λ = ρg /ρ` and η = µg /µ` are the density and viscosity ratios between air and water. For a sharp interface, 2
This Neumann condition for the pressure is substituted ui is advanced to the next step to complete one cycle of into the integral formulation in equation 14: the Runge-Kutta algorithm: � �� � � � k Z Z 1 1 ∂P k+1 1 ∂P ∗ ui ni ∗ k uk+1 = u + u + ∆t R − , (12) i ds ni = + Ri ni ds i i i 2 ρ(φ∗ ) ∂xi ρ(φk ) ∂xi ∆t So S Z o v ∗ ni and the volume fraction is advanced to complete the al+ ds i (17) gorithm: ∆t Sb � ∗ � ui + uki k This equation is solved using the method of fractional φk+1 = φk − VOF , φ , ∆t (13) areas. Details associated with the calculation of the 2 area fractions are provided in Sussman & Dommermuth (2001) along with additional references. Cells whose cut E NFORCEMENT OF B ODY B OUNDARY C ONDITIONS volume is less than 25% of the full volume of the cell are merged with neighbors. The merging occurs along the A no-flux boundary condition is imposed on the surdirection of the steepest gradient of the signed-distance face of the body using a finite-volume technique. A function ψ. This improves the conditioning of the Poissigned distance function ψ is used to represent the body. son equation for the pressure. As a result, the stability of ψ is positive outside the body and negative inside the the projection operator for the velocity is also improved body. The magnitude of ψ is the minimal distance be(see equations 9 and 12). tween the position of ψ and the surface of the body. ψ is zero on the surface of the body. ψ is calculated using a surface panelization of the hull form. Green’s theorem is Numerical efficiency used to indicate whether a point is inside or outside the body, and then the shortest distance from the point to the The capability to simulate free-surface hydrodynamics surface of the body is calculated. Triangular panels are requires the ability to simulate a wide range of scales in used to discretize the surface of the body. The shortest both space and time with a large number of grid points. distance to the surface of the body can occur on either The numerical solver should scale linearly with the numa surface, edge, or vertice of a triangular panel. Details ber of unknowns and the number of CPU’s. In the next associated with the calculation of ψ are provided in Susstwo sections, we discuss upgrades to the Poisson solver man & Dommermuth (2001). and to the communication between processors that enCells near the ship hull may have an irregular shape, able very large-scale applications with order one billion depending on how the surface of the ship hull cuts the grid points. cell. On these irregular boundaries, the finite-volume approach is used to impose free-slip boundary conditions. Let Sb denote the portion of the cell whose surface is on the body, and let So denote the other bounding surfaces of the cell that are not on the body. Gauss’s theorem is applied to the volume integral of equation 8: Z ni ∂P ∗ ds = ρ(φk ) ∂xi So +Sb � k � Z ui ni + Ri ni . (14) ds ∆t So +Sb
P OISSON SOLVER Dommermuth et al. (2006) use a preconditioned conjugate-gradient method to solve the Poisson equation for the pressure (17). As the number of grid cells increase, the rate of convergence of the conjugate-gradient solver tends to stall. A new multigrid solver has been developed to address this issue. Multigrid uses a fine grid to reduce high-wavenumber residual errors and a coarse grid to reduce low-wavenumber errors in the residual. A key aspect of multigrid requires moving metrics and associated variables from fine grids to coarse grids during the restriction phase (Wesseling 1992). In Equation 17, the density and cut-surface areas are required on the coarser grids. They can be moved independently or their product can be moved as one unit. The density is located at cell centers and the cut-surface areas are located at cell faces. If the density is moved from cell centers on the fine grid to cell centers on the coarse grid, the sharp interface between air and water is excessively smoothed. As a result, the rate of convergence of the multigrid algorithm is reduced. Less smoothing occurs, if the density is first moved to cell faces before the restriction phase. In NFA,
Here, ni denotes the components of the unit normal on the surfaces that bound the cell. Based on equation 9, a Neumann condition is derived for the pressure on Sb as follows: ni ∂P ∗ u∗i ni uki ni = − + + Ri ni . ρ(φk ) ∂xi ∆t ∆t
(15)
The Neumann condition for the velocity (6) is substituted into the preceding equation to complete the Neumann condition for the pressure on Sb : ni ∂P ∗ v ∗ ni uk ni = − i + i + Ri ni . k ρ(φ ) ∂xi ∆t ∆t
(16)
3
100 Seconds per Timestep (sec)
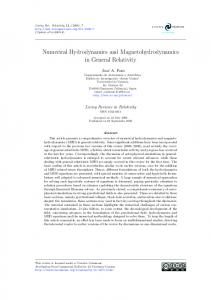
the product of one over the density times the cut-surface areas is evaluated on cell faces on the finest grid before moving it to the coarse grids. This improves convergence of the multigrid algorithm for sharp interface methods. Unlike the old preconditioned conjugate-gradient solver, the performance of the new multigrid method does not degrade as the number of grid points increases beyond ten million grid cells. PARALLEL COMPUTING Scaling, in this paper, refers to the ability of a parallel code to make adequate use of all of the processors on which it is being run. Ideally, when a massively parallel code is run on double the number processors, it would finish in half the amount of clock time. Realistically, there will be some amount of overhead associated with communicating data among processors and the time will not quite be halved while doubling processor count.
10 CRAY – SHMEM CRAY – MPI
1 10
CLUSTER – MPI
100
1000
CPU's Figure 1: Scaling of NFA.
High grid densities are increasingly needed to resolve the small-scale phenomena that are present in many current hydrodynamic calculations. This increase in grid resolution necessitates increasing the number of processors on which NFA is run to keep simulation time down to a reasonable level. NFA’s communication package has been recently upgraded to run effectively with this higher processor count. The original communication routines were written using the CRAY’s native package called shmem (shared memory.) Shmem routines are optimized for large contiguous data transfers and thus are not ideal for passing guard or ghost cells between blocks in the domain decomposition method that is used by NFA.
new version of NFA uses MPI commands to allow each processor to read from or write to its own memory offset location in a common file. With no communication to perform, the files are written significantly faster. The development of this new version of NFA has taken place on a recently constructed LINUX cluster. The cluster houses 32 AMD quad core Opteron CPU’s and an infiniband interconnect to handle all communication between processors. Inifiniband is optimized for remote memory access or RMA. One-sided communication calls such as MPI get and MPI put make use of this and allow the processor whose memory is being accessed to continue working on its subsection of the domain while the inifiniband hardware handles most of the communication overhead.
A new version of the the communication routines has been written using MPI-2 (message passing interface.) The set of routines is optimized for noncontiguous data transfer through the creation of strided vector types. Strided vector types provide information to the MPI implementation regarding exactly how data to be transferred is arranged in an array. This allows NFA to pass only the minimum amount of data necessary between blocks.
As a result of these upgrades, the scaling performance of NFA is greatly increased. Figure 1 shows a plot of NFA’s clock time per time step while solving a domain of 16.8 million cells. The data is plotted using log-log axes; consequently, a slope of negative one would indicate perfect scaling, since the doubling of CPU’s would halve the computation time. There is a significant improvement between the old shmem version of NFA and the new MPI version especially as CPU count reaches 512, which shows a speed up that is almost four times the old version. More importantly, the roll off as the number of CPU’s increases is much less severe for the new MPI version relative to the old shmem version. It should be noted that the same MPI version of NFA is running on both the CRAY and the LINUX Cluster attesting to the portability of the MPI-2 standard.
The upgrade of the communication package has provided a unique opportunity to additionally overhaul the rest of the code. The entire code has been ported from Fortran 77 to Fortran 90. All common blocks have been removed and replaced with modules and allocatable arrays. The inputs to the code have been taken out of include files and are now input by the user. As a result, the code does not need to be recompiled for every run and can be executed using simple scripts. The file input and output in NFA has also been updated using MPI parallel file I/O. Originally when files had been read in and out of NFA, the master process would have to collect or distribute all the data to each individual process and perform all file I/O itself. The 4
Depth (inches) 12.84 14.33 15.31 15.55
Speed (knots) 5 7 8 9
Fr
350
0.27163 0.38028 0.43461 0.48894
300
250
Drag (lb)
Length (inches) 360 360 360 360
Table 1 Details of transom model tests.
200
150
Results 100
NFA predictions of of the free-surface elevations near a transom-stern model moving with constant forward speed are compared to laboratory measurements. Table 1 provides details of the transom-stern model tests, including the length of the model, the depth of the transom, the speed of the model, and the Froude number. All length and velocity scales are respectively normalized by the model’s length (Lo ) and speed (Uo ) . The threedimensional numerical simulations use 768x192x160= 23,592,960 grid points, 24x6x5=720 sub-domains, and 180 nodes on a Cray XT3. The length, half width, depth, and height of the computational domain are respectively 3.0, 0.84917, 0.66667, 0.5 ship lengths (Lo ). These dimensions match the cross section of the DTMB towing tank. A symmetry boundary condition is imposed on the plane y = 0. Grid stretching is employed in all directions. Details of the grid-stretching algorithm are provided in Dommermuth et al. (2006). The smallest grid spacing is 0.002 near the ship and mean waterline, and the largest grid spacing is 0.007 in the far field. The fore perpendicular and transom are respectively located at x = 0 and x = −1. The numerical simulations are slowly ramped up to full speed. The period of adjustment is To = 0.5 (Dommermuth et al. 2006). Mass conservation is ensured using the regridding algorithm that is implemented by Dommermuth et al. (2006). The density is not smoothed, but a clipping algorithm is implemented (Dommermuth et al. 2006). For this simulation, the non-dimensional time step is ∆t=0.00025. The numerical simulation runs 20,000 time steps corresponding to 5 ship lengths. The simulation requires about 23 hours of wall-clock time.
50
4
5
6
7
8
9
10
Speed (knots)
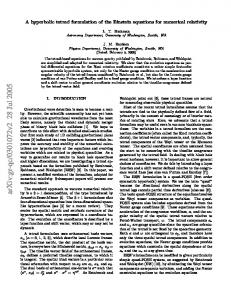
Figure 2: Drag of transom-stern model as a function of speed. DTMB measurements, NFA predictions, and Das Boot predictions are respectively denoted by black circular, blue square, and red diamond symbols.
ongoing in this area. Figure 3 (a-d) show perspective views of measured and predicted free-surface elevations in the transomstern region. The numerical results are shown at nondimensional time t = 5. The transom is wet when the towing speed is five knots, and dry at nine knots. Glassy regions immediately behind the transom are evident at speeds of eight and nine knots. On average, the rooster tails are higher for the two intermediate speeds, seven and eight knots. Figure 4 (a-d) compares DTMB measurements and NFA predictions of wave cuts for four speeds and four transverse locations. The numerical results are shown at non-dimensional time t = 5. The agreement between measurements and predictions is very good for all four speeds and locations. Some wave breaking and air entrainment is evident in the numerical predictions.
Conclusions
Figure 2 compares DTMB measurements of the transom-stern model’s drag as a function of speed to NFA and Das Boot predictions. The NFA and Das Boot force predictions are respectively based on formulations that are provided in Dommermuth et al. (2007) and Wyatt (2000). We note that Das Boot uses a Hughes form factor of 0.08. For speeds greater than five knots, NFA and Das Boot predictions agree with each other and are very close to DTMB measurements. At five knots, the predicted drags are higher than the measured drag. This could indicate that the numerical methods have inadequate recovery of the pressure in the stern region. Research is
In terms of progress, it is interesting to consider the results of research reported in earlier ONR symposiums. Dommermuth et al. (1998) study the flow near the bow of model 5415 using a variable-density, cartesian-grid formulation. A body force is used by Dommermuth et al. (1998) to impose the body boundary condition. The numerical results of Dommermuth et al. (1998) barely capture the initial onset of wave overturning near the bow. Sussman & Dommermuth (2001) continue to develop interface capturing methods. Once again, comparisons are shown to the bow flow of model 5415. The results 5
Purtell is the program manager. This work is supported in part by a grant of computer time from the DOD High Performance Computing Modernization Program (http://www.hpcmo.hpc.mil/). The numerical simulations have been performed on the Cray XT3 at the U.S. Army Engineering Research and Development Center (ERDC).
do not show significant improvement over their earlier results. However, their calculations of the breakup of a turbulent spray sheet illustrate a novel application of interface-capturing methods. Dommermuth, Sussman, Beck, O’Shea, Wyatt, Olson & MacNeice (2004) use two methods to study the flow around model 5415, a vertical strut, and a bluff wedge. The first method uses freeslip conditions on the hull in combination with a hybrid level-set and VOF interface-capturing method. In addition, adaptive mesh refinement (AMR) is used to improve grid resolution near the hull and free-surface interface. Their preliminary results illustrate the efficiency of AMR. The second method uses body-force and VOF formulations on a cartesian grid with no grid stretching. The results show more fine-scale detail than the earlier studies. The predicted free-surface elevations compare well with experiments, but the body-force method is too “sticky” because too much fluid is dragged with the ship hull. Based on these results, Dommermuth et al. (2006) use free-slip boundary conditions to impose the body boundary condition to reduce stickiness. The VOF algorithm is generalized to include free-slip conditions on the ship hull. The grid is stretched along the cartesian axes to improve grid resolution. Numerical predictions compare well with laboratory measurements of ship models moving with constant forward speed. Fu et al. (2008a) perform preliminary studies of wave impact. NFA predictions of a plunging breaking wave agree very well with measurements for free-surface elevations and waterparticle velocities. Ratcliffe et al. (2008) continue their earlier studies of incident waves interacting with towed model. Numerical predictions of the diffracted waves agree with QViz measurements in the bow region for a high speed case with a large incident wave. Wyatt et al. (2008) compare full-scale lidar measurements of the rooster-tail region behind the R/V Athena to numerical predictions using NFA. Mean free-surface elevations are in good agreement, but free-surface spectrums differ at higher frequencies. Aliasing may have adversely affected their numerical results. Also, unlike the full-scale ship, their numerical model is not appended.
References
Dommermuth, D., Innis, G., Luth, T., Novikov, E., Schlageter, E., & Talcott, J., “Numerical simulation of bow waves,” Proceedings of the 22nd Symposium on Naval Hydrodynamics, Washington, D.C., 1998, pp. 508–521. Dommermuth, D. G., O’Shea, T. T., Wyatt, D. C., Ratcliffe, T., Weymouth, G. D., Hendrikson, K. L., Yue, D. K., Sussman, M., Adams, P., & Valenciano, M., “An application of cartesian-grid and volume-of-fluid methods to numerical ship hydrodynamics,” Proceedings of the 9th International Conference on Numerical Ship Hydrodynamics, Ann Arbor, Michigan, 2007, to appear. Dommermuth, D. G., O’Shea, T. T., Wyatt, D. C., Sussman, M., Weymouth, G. D., Yue, D. K., Adams, P., & Hand, R., “The numerical simulation of ship waves using cartesian-grid and volume-of-fluid methods,” Proceedings of the 26th Symposium on Naval Hydrodynamics, Rome, Italy, 2006, to appear. Dommermuth, D. G., Sussman, M., Beck, R. F., O’Shea, T. T., Wyatt, D. C., Olson, K., & MacNeice, P., “The numerical simulation of ship waves using cartesian-grid methods with adaptive mesh refinement,” Proceedings of the 25th Symposium on Naval Hydrodynamics, St. John’s, Newfoundland and Labrador, Canada, 2004, pp. 1–17. Fu, T., Fullerton, A., Brewton, S., Brucker, K., & Dommermuth, D., “An experimental and computational study of breaking-wave impact forces,” Proceedings of the 27th Symposium on Naval Hydrodynamics, Seoul, Korea, 2008a, to appear.
The present research shows preliminary comparisons between measurements and predictions for a transom-stern model towed at four different speeds. The comparisons include drag and wave cuts. There is good agreement between numerical predictions and laboratory measurements. Future research will focus on establishing convergence and detailed studies of the transom-stern region, including wave breaking, spray formation, and air entrainment.
Fu, T., Fullerton, A., Ratcliffe, T., Minnick, L., Walker, D., Pence, M., & Anderson, K., A Detailed Experimental Study of Transom Breaking Waves, Technical Report NSWCCD-50-TR-2008/???, Naval Surface Warfare Center Carderock Division, Hydromechanics Department, 2008b. Ratcliffe, T., Minnick, L., O’Shea, T., Fu, T., Russell, L., & Dommermuth, D., “An integrated experimental and computational investigation into the dynamic loads and free-surface wave-field perturbations induced by head-sea regular waves on a 1/8.25 scale-model of the R/V Athena,” Proceedings of the 27th Symposium on
Acknowledgements The Office of Naval Research supports this research under contract number N00014-07-C-0184. Dr. Patrick 6
Naval Hydrodynamics, Seoul, Korea, 2008, to appear. Rider, W., Kothe, D., Mosso, S., Cerutti, J., & Hochstein, J., “Accurate solution algorithms for incompressible multiphase flows,” AIAA paper 95–0699. Sussman, M., “A second order coupled level set and volume-of-fluid method for computing growth and collapse of vapor bubbles,” J. Comp. Phys., Vol. 187, 2003a, pp. 110–136. Sussman, M. & Dommermuth, D., “The numerical simulation of ship waves using cartesian-grid methods,” Proceedings of the 23rd Symposium on Naval Ship Hydrodynamics, Nantes, France, 2001, pp. 762–779. Wesseling, P., An introduction to multigrid methods, John Wiley & Sons, 1992. Wyatt, D., “Development and assessment of a nonlinear wave prediction methodology for surface vessels,” J. Ship Res., Vol. 44, 2000, pp. 96–107. Wyatt, D., Fu, T., Taylor, G., Terrill, E., Xing, T., Bhusan, S., O’Shea, T., & Dommermuth, D., “A comparison of full-scale experimental measurements and computational predictions of the transom-stern wave of the R/V Athena I,” Proceedings of the 27th Symposium on Naval Hydrodynamics, Seoul, Korea, 2008, to appear.
7
(a)
(b)
(c)
(d)
Figure 3: Transom-stern perspective views. (a) 5 knots, (b) 7knots, (c) 8 knots, and (d) 9 knots. NFA predictions and DTMB measurements are respectively shown on the left and right.
8
(a)
0.01
(b)
0
0 −0.01 −2.5
−2
−1.5
−1
−0.5
0
−0.02 −2.5
0.5
0.01
0.02
0
0
−0.01 −2.5
−2
−1.5
−1
−0.5
0
−0.02 −2.5
0.5
0.01
0.02
0
0
−0.01 −2.5
−2
−1.5
−1
−0.5
0
−0.02 −2.5
0.5
0.01
0.02
0
0
−0.01 −2.5
(c)
0.02
−2
−1.5
−1
−0.5
0
−0.02 −2.5
0.5
(d)
0.02
−2
−1.5
−1
−0.5
0
−0.02 −2.5
0.5
0.02
0
0
−2
−1.5
−1
−0.5
0
−0.02 −2.5
0.5
0.02
0.02
0
0
−0.02 −2.5
−2
−1.5
−1
−0.5
0
−0.02 −2.5
0.5
0.02
0.02
0
0
−0.02 −2.5
−1
−0.5
0
0.5
−2
−1.5
−1
−0.5
0
0.5
−2
−1.5
−1
−0.5
0
0.5
−2
−1.5
−1
−0.5
0
0.5
−2
−1.5
−1
−0.5
0
0.5
−2
−1.5
−1
−0.5
0
0.5
−2
−1.5
−1
−0.5
0
0.5
−2
−1.5
−1
−0.5
0
0.5
0.02
0.02
−0.02 −2.5
−1.5
0
0 −0.02 −2.5
−2
−2
−1.5
−1
−0.5
0
−0.02 −2.5
0.5
Figure 4: Transom-stern model wave cuts. (a) 5 knots, (b) 7knots, (c) 8 knots, and (d) 9 knots. DTMB measurements (red lines) are compared to NFA predictions (black lines). For each speed and from top to bottom, the transverse cuts are located at y/Lo =0.14375, 0.22847, 0.3125, and 0.39514
9