Probabilistic robotics. MIT press, 2005. [26] Dominic Zeng Wang, Ingmar Posner, and Paul Newman. What could move? finding cars, pedestrians and bicyclists.
A Probabilistic Framework for Real-time 3D Segmentation using Spatial, Temporal, and Semantic Cues David Held, Devin Guillory, Brice Rebsamen, Sebastian Thrun, Silvio Savarese Computer Science Department, Stanford University {davheld, deving, thrun, ssilvio}@cs.stanford.edu
Abstract—In order to track dynamic objects in a robot’s environment, one must first segment the scene into a collection of separate objects. Most real-time robotic vision systems today rely on simple spatial relations to segment the scene into separate objects. However, such methods fail under a variety of realworld situations such as occlusions or crowds of closely-packed objects. We propose a probabilistic 3D segmentation method that combines spatial, temporal, and semantic information to make better-informed decisions about how to segment a scene. We begin with a coarse initial segmentation. We then compute the probability that a given segment should be split into multiple segments or that multiple segments should be merged into a single segment, using spatial, semantic, and temporal cues. Our probabilistic segmentation framework enables us to significantly reduce both undersegmentations and oversegmentations on the KITTI dataset [3, 4, 5] while still running in real-time. By combining spatial, temporal, and semantic information, we are able to create a more robust 3D segmentation system that leads to better overall perception in crowded dynamic environments.
I. I NTRODUCTION A robot operating in a dynamic environment must identify obstacles in the world and track them to avoid collisions. Robotic vision systems often begin by segmenting a scene into a separate component for each object in the environment [2, 11, 24]. Each component can then be tracked over time to estimate its velocity and predict where each object will move in the future. The robot can use these predictions to plan its own trajectory and avoid colliding into any static or dynamic obstacles. Due to the real-time constraint on these systems, many 3D robotic perception systems rely on simple spatial relationships to find the objects in a scene [2, 11, 14, 24]. For instance, a common strategy is to use proximity to group points together: if two 3D points are sufficiently close, they are assumed to be part of the same object, and if the points are far apart and disconnected, they are assumed to belong to different objects. However, spatial relations alone are not sufficient for distinguishing between objects in many real-world cases. For example, in autonomous driving, it is common for a pedestrian to get undersegmented together with a neighboring object, such as a tree, a nearby car, or a building, as shown in Figure 1 (top). If an autonomous vehicle is not aware of a nearby pedestrian, the vehicle will have difficulty anticipating the pedestrian’s actions, which could lead to a disastrous
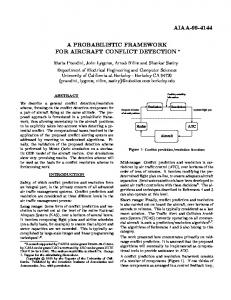
Fig. 1. Top: Using only spatial cues, a person is segmented together with a nearby building. By tracking this person over time, we segment it as a separate object. Bottom: Using only spatial cues, a car is oversegmented into multiple pieces. Using semantic and temporal information, we determine that these multiple pieces all belong to a single object. Each color denotes a separate object instance, estimated by the segmentation algorithm. (Best viewed in color)
collision. It is also common for a nearby object such as a car to get oversegmented into multiple pieces, with the front, side, and interior of the object being considered as separate segments (Figure 1, bottom). This oversegmentation can lead to poor tracking estimates, causing the autonomous vehicle to incorrectly predict the future position of nearby objects. We present the first real-time 3D segmentation algorithm that combines spatial, temporal, and semantic information in a coherent probabilistic framework. A single frame of an environment is often ambiguous, as it can be difficult to determine if a segment consists of one object or multiple objects. The temporal cues in our framework allow us to resolve such ambiguities. By watching objects over time, we obtain more information that can help us determine how to segment the scene. If we can recognize an object, then we can also incorporate the object class into our framework to assist our segmentation. At the same time, because we are using a probabilistic framework, the semantic cues are optional, enabling us to segment unknown objects: if we do not recognize an object, then our semantic probabilities will be uninformative and our framework will automatically rely on the spatial and temporal information for segmentation. Our method outputs an “instance segmentation”, i.e. a partition of a collection of 3D points into a set of clusters, with
one cluster corresponding to each object instance in the scene. These objects can then be individually tracked to estimate their future positions and avoid collisions. We apply this method to the KITTI dataset, which was collected from a moving car on crowded city streets for the purpose of evaluating perception for autonomous driving [3, 4, 5]. We show that our framework significantly reduces both oversegmentation and undersegmentation errors, with the total number of errors decreasing by 47%. Our method runs in only 34 milliseconds per frame and is thus suitable for real-time use in robotic applications. By combining spatial, semantic, and temporal information, we are able to create a more robust perception pipeline that should lead to more reliable autonomous driving. More information about our approach can be found on our website: http://davheld.github. io/segmentation3D/segmentation3D.html II. R ELATED W ORK Spatial segmentation. Most real-time 3D segmentation methods only use the spatial distance between points in the current frame for clustering [2, 11, 24], ignoring semantic information as well as temporal information from previous frames. However, because these methods only use the spatial distance between points, they cannot resolve ambiguous cases where an occlusion causes an object to become oversegmented or when multiple nearby objects become segmented together. Temporal segmentation. Some methods focus on segmenting objects that are currently moving [1, 17, 27]. For example, Petrovskaya and Thrun [17] use “motion evidence” to detect moving vehicles. After filtering out static objects, clustering the remaining moving objects becomes simpler. Another approach is to estimate the motion for each point in the scene and then to cluster these motions [22, 8]. However, these methods would not be able to segment a stopped car or other objects that are currently stationary but may move in the future. An additional approach is to cluster an image into coherent superpixels by enforcing spatial and temporal consistency [9, 28, 29]. However, these superpixels do not represent whole objects, so a post-processing method must be used to find the objects in the scene so that each object can be tracked for autonomous driving or other robotics applications. Further, most of these methods are applied to dense RGB-D images from indoor scenes [9, 28, 29, 22, 8] and would not directly apply to large outdoor scenes with sparse 3D sensors. Semantic segmentation. Other papers have attempted to incorporate semantic information for 3D segmentation. Many of these methods can only segment objects of particular classes that can be recognized by a detector [21, 13, 6]. Using our probabilistic framework, semantic information is an optional cue; we are able to use spatial and temporal information to segment novel objects that we cannot identify, which is important for robust autonomous driving in the real world. Wang et al. [26] use a foreground/background classifier to detect and segment objects. We compare to this method and demonstrate that we achieve much better performance by
also incorporating temporal information. Further, their method assumes that foreground objects are well-separated from each other, which does not hold for crowded urban environments. Point-wise labeling. Some papers apply a semantic label to each individual point in the scene [12, 20]. For example, these methods will give a label “person” to every point in a crowd of pedestrians or “car” to every point in a group of cars, without locating the individual objects in this group. The output of these methods are less useful for autonomous driving, since we need to be able to segment and track each object instance in our environment so we can predict where the object will go and avoid collisions. Our approach. We are able to segment both known and unknown objects, as well as objects that are either moving or stationary. Each segment output by our method represents a single object instance. Our real-time segmentation method is thus suitable for autonomous driving and other mobile robot applications, in which all objects in our environment must be segmented so we can track each one and avoid collisions. III. S YSTEM OVERVIEW Given a stream of input data, we first perform grounddetection, i.e. we determine which points belong to the ground and which points belong to objects. Next, we apply a fast initial segmentation method to cluster the non-ground points into separate segments. We modify these initial segments using our probabilistic framework, splitting segments apart or merging segments together using spatial, temporal, and semantic information. Our framework computes the probability that a set of points represents a single object or more than object. If we estimate that a segment consists of more than one object, then we split this segment apart; if we estimate that a group of segments represents a single object, then we merge these segments together. Our goal is to obtain a final set of segments where each segment is estimated to represent a single object. After obtaining the final segmentation for a given frame, each segment is tracked and classified to further improve the robot’s understanding of its environment. Various methods for the ground-detection, initial segmentation, tracking, and classification may be used; the methods used in our pipeline are listed in Section VI-D. IV. P ROBABILISTIC F RAMEWORK A. Segmentation Model Our probabilistic framework estimates whether a segment represents a single object or multiple objects, incorporating the current observation, the estimated data association, and the estimated segmentation of the previous frame. We also optionally incorporate semantic information if we can recognize the type of object being segmented, as explained in Section IV-C. Let st be any set of 3D points observed at time t, and let zt be a set of features (defined in Section IV-B) computed based on the points in st . In our segmentation framework, st will be formed by the union of one or more of our initial segments. We want to estimate whether the points in st belong to a single
object or more than one object, and based on this estimate, We can expand the final term of equation 1 using the we will merge the segments in st together or split st apart, as previous segmentation estimate as X explained in Section V. p(Nt , at |S1..t−1 ) = η2 p(Nt |at , Nt−1 ) p(Nt−1 |S1..t−1 ) To determine whether the points in st belong to a single Nt−1 object or more than one object, we compute a probability (3) p(Ntst |zt , S1..t−1 ) where Ntst = true if the points in st belong to only one object, and Ntst = f alse if the points belong to where we treat p(at |Nt−1 , S1..t−1 ) = p(at ) as a constant η2 , more than one object (we abbreviate this variable as Nt when and we have simplified the equation using the conditional it is clear which segment it refers to). We also incorporate independence assumption information from previous frames, given by S1..t−1 , where p(Nt |at , Nt−1 , S1..t−1 ) = p(Nt |at , Nt−1 ). (4) Si = {si,1 · · · si,n } represents the estimated segmentation of frame i, i.e. a partitioning of the points in frame i into disjoint The variable Nt−1 = true if segment st−1 is only one object subsets. Based on the computation of p(Nt |zt , S1..t−1 ), we and false otherwise. Thus Nt−1 is independent of all segments decide whether to split our initial segments apart or to merge from t − 1 other than segment st−1 (and its features zt−1 ), so we can rewrite the final term from equation 3 as segments together, as explained in Section V. We would like to accumulate segmentation evidence across p(Nt−1 |S1..t−1 ) = p(Nt−1 |zt−1 , S1..t−2 ) (5) time to better estimate this probability. To do so, we incorporate the data association ast t , which represents a matching The expression on the right of equation 5 is similar to the between a collection of points st in the current frame and a expression on the left side of equation 1 for the previous time collection of points in the previous frame (we abbreviate this step, so we compute this recursively, allowing us to accumulate variable as at ). Suppose that the estimated final segmentation segmentation evidence across time. The term p(Nt |at , Nt−1 ) in equation 3 represents the probat time t − 1, given by St−1 , is some partition of the ability that a segmentation remains consistent across time. Alpoints observed at time t − 1 into n segments, St−1 = though a segmentation usually remains consistent, sometimes {st−1,1 · · · st−1,n }. Then at is an n-dimensional vector where a single object can split to become more than one object. th the i element is 1 if a subset of the points in st match to For example, a person might dismount from a bicycle; in this a subset of the points in st−1,i and 0 otherwise. The data case, a single object (person-riding-bicycle) now becomes two association indicates that these points belong to the same separate objects as the person moves away from the bicycle. object or group of objects viewed at different points in time. Conversely, a person can enter into a car, in which case two We assume that the points in the previous frame have objects (person and car) are now treated as a single object. already been segmented and that the most likely data assoWe treat this probability as a constant, determined using crossciation has already been computed. For previous frames, we validation on our training set. only allow the data association at−k (for k ≥ 1) to take on The overall probability can now be written as: 2 possible values: either all elements are 0, or the element X corresponding to the single most likely data association is p(zt |Nt , at , z1..t−1 ) p(Nt |zt , S1..t−1 ) = η equal to 1 (and the rest are 0). Thus the segment st−1 is at X associated with an entire history of segments s1..t−1 , given by p(Nt |at , Nt−1 ) p(Nt−1 |zt−1 , S1..t−2 ) the most likely data association at each time step. Nt−1 We do not know the true data association for the current (6) frame, so we sum over different possible data associations: where η = η1 η2 . The three terms in equation 6 represent X p(Nt |zt , S1..t−1 ) = η1 p(zt |Nt , at , S1..t−1 ) p(Nt , at |S1..t−1 ) our current measurement model, temporal consistency, and at our previous estimate, respectively. Note that these terms (1) correspond to those in the standard update equations for a where we have expanded the probability using Bayes’ rule, Bayes filter [25]. with the normalization constant η1 = 1/p(zt |S1..t−1 ). Al- B. Measurement Model though at can take on 2n possible values, we show a tractable The term p(zt |Nt , at , z1..t−1 ) of equation 6 represents the way to compute this in Section VI-A. probability of our current observation’s features zt , known If we condition on the data association at , then we only as a “measurement model.” For segment st , we define zt = need to be concerned with the matching segments from the {ztp , zts } as a set of features for this segment, where ztp is the previous frames s1..t−1 and their features z1..t−1 rather than position of the segment’s centroid and zts are a set of features the entire previous segmentation S1..t−1 . Thus we have that that represent the segment’s shape (defined below). Assuming that the position and shape are independent, we p(zt |Nt , at , S1..t−1 ) = p(zt |Nt , at , z1..t−1 ). (2) can now write this as The probability p(zt |Nt , at , z1..t−1 ) incorporates the evidence p s from our current observation zt and will be explained in p(zt |Nt , at , z1..t−1 ) = pP (zt |Nt , at , z1..t−1 ) pS (zt |Nt , at , z1..t−1 ) Section IV-B.
= pP (ztp |at , z1..t−1 ) pS (zts |Nt ).
(7)
¯ + Q (and η3 is a where C1 = η3 |Σ|−1/2 and Σ = Σ normalization constant). We find that using the entire point cloud s¯t is more robust than simply using its centroid. 2) Shape Probability: The second term of equation 8, pS (zts |Nt ), is the probability of observing a measurement with shape features zts (defined below) conditioned on the number of objects in the points st . This probability is the main term in equation 8 that directly relates to the number of objects; the other terms are used to accumulate segmentation evidence across time. Without any semantic information, this probability is based only on the distance between points, as is a normally used in spatial clustering [2, 11, 24]. However, in our Xt p(Nt |at , Nt−1 ) p(Nt−1 |zt−1 , S1..t−2 ). framework, this probability is accumulated across time to give Nt−1 a more accurate segmentation, as described in Section IV-A. (8) To compute this probability, we define zts to be the largest 1) Position Probability: In equation 8, we sum over the gap d within the points st . Formally, we define d to be the different possible data associations at . Each data association largest distance such that the points in st can be partitioned represents a matching between the set of points st and a into two disjoint subsets, st,1 and st,2 , where previous set of points, st−1 (where st−1 might be a union ||pi , pj || ≥ d, ∀pi ∈ st,1 , pj ∈ st,2 , (12) of one or more of our previous segments). However, some of the data associations are more likely than others. The where || · || is the Euclidean distance. A large value for probability pP (ztp |at , z1..t−1 ) in equation 8 will allow us to the distance d implies that st is more likely to consist of weight more highly the terms in the summation corresponding more than one object, whereas a smaller value of d could be to more likely data associations and down-weight the terms caused by an oversegmentation of a single object. In practice, corresponding to less likely data assocations. we only compute d when we are considering merging two The position probability, pP (ztp |at , z1..t−1 ), is computed segments together (see Section V-B), in which case d is the from the position of the centroid ztp compared to its predicted distance between the nearest points between the two segments position, based on the estimated object velocity. To compute (computed with a kd-tree); otherwise, we use a constant value the position probability, we integrate over the different object for d, which is chosen using cross-validation. velocities xt : Using statistics from our training set, we find that the Z distance d between pairs of different objects varies according pP (ztp |at , z1..t−1 ) = p(ztp |xt ) p(xt |at , z1..t−1 ) dxt . (9) to an exponential distribution We have eliminated the dependency of the first term on Nt since the centroid’s position is not dependent on the number of objects. We have further simplified our shape probability computation by assuming that pS (zts |Nt , at , z1..t−1 ) = pS (zts |Nt ). Although in reality our current shape features zts depend on the s previous shape features z1..t−1 , this conditional independence assumption will greatly simplify our calculations. These two terms will be explained in more detail below. The overall probability can now be written as: X p(Nt |zt , S1..t−1 ) =η pP (ztp |at , z1..t−1 ) pS (zts |Nt )
xt
Note that this computation is related to the Bayesian update of a Kalman Filter [25]. To compute this, we assume that we have modeled the previous distribution over object velocities p(xt−1 |z1..t−1 ) as a Gaussian with mean µ and covariance Σ. To compute this integral, we first perform the Kalman Filter prediction step to get a prediction of the object’s current position and velocity (see [25] for details). The resulting prediction is given by a Gaussian with mean µ ¯ = [¯ µv , µ ¯x ] and ¯ with the predicted mean velocity and position covariance Σ, given by µ ¯v and µ ¯x respectively. If we model the measurement probability p(ztp |xt ) by a Gaussian with measurement noise Q, then equation 9 is the convolution of two Gaussians, which results in another Gaussian. The probability is thus given by ¯ + Q). pP (ztp |at , z1..t−1 ) = N (ztp ; µ ¯, Σ
(10)
To compute this probability, we first shift the point cloud from segment st−1 to its predicted position µ ¯x to get the predicted point cloud s¯t . Next, we find the point p¯i ∈ s¯t that is nearest to the centroid ztp . We then compute the probability as � � 1 pP (ztp |at , z1..t−1 ) = C1 exp − (ztp − p¯i )T Σ−1 (ztp − p¯i ) 2 (11)
pD (d|¬Nt ) =
1 exp(−d/µD ), µD
(13)
where µD is a parameter determined by our training set. On the other hand, occlusions or sensor noise can cause a single object to be oversegmented into multiple pieces that may have a gap of d between the pieces. We model the probability of observing an oversegmentation of a single object with a gap of d between two pieces by an exponential distribution pD (d|Nt ) =
1 exp(−d/µS ), µS
(14)
where µS is determined using cross-validation on our training set. Typically we have that µD > µS based on the intuition described above: a larger gap between points is indicative that the points may belong to multiple objects. The shape probability is then set to be equal to this distribution: pS (zts |Nt ) = pD (d|Nt ).
(15)
C. Semantics In the previous sections we have used spatial and temporal information (accumulating segmentation evidence across time) to estimate the segmentation. In this section we show how to incorporate semantic information: if we can recognize the type
of object for a given segment, this should give us additional information about how to segment the scene. On the other hand, if we cannot recognize the object, then the probabilistic model naturally reverts to the model of Sections IV-A and IV-B that incorporates spatial and temporal information. We assume that we have a segment classifier p(c|s1..t ) that computes the probability that the set of segments s1..t is some class c. To use the classifier, we must sum over class labels. Equation 1 can now be rewritten as XX p(Nt |zt , S1..t−1 ) =η1 p(zt |Nt , at , c, S1..t−1 ) at
c
p(Nt , at , c|S1..t−1 ).
(16)
0 = k2 σi,c for constants k1 , k2 > 1 with µ0i,c = k1 µi,c and σi,c chosen using cross-validation on our training set. We can now replace the shape probability from equation 15 with Y pS (zts |Nt , c) =pD (d|Nt , c) pV (li |Nt , c). (21) i
Note that one of the classes may be “unknown.” When we condition on the “unknown” class, then the size probability pV (li |Nt , c) will be uninformative; however, the probabilistic models from Sections IV-A and IV-B are still used. Thus, our segmentation model benefits when we recognize the object class, but we can still segment the scene even for unknown objects. V. S EGMENTATION A LGORITHM
The second term of equation 16 can be expanded as p(Nt , at , c|S1..t−1 ) = p(Nt , at |S1..t−1 ) p(c|Nt , at , S1..t−1 ). (17) For the second term of equation 17, if the data association is given then the class label c is only dependent on the corresponding matching segments s1..t−1 , so we compute this term as p(c|at , s1..t−1 ) using the segment classifier. We now compute a more accurate measurement probability, since we are also conditioning on the class label c. For example, we now compute equation 14 as pD (d|Nt , c) =
1 µS,c
exp(−d/µS,c ),
(18)
where the parameter µS,c can vary based on the class label. For example, for a car, an oversegmentation might reasonably cause a 15 cm gap between points, whereas for a single person, only a 3 cm gap might be considered reasonable. We choose µS,c for each class using cross-validation on the training set. We also incorporate more information about the object shape into the computation of pS (zts |Nt , c), since we are conditioning on the object class. Although a complex shape model can be used, for sake of efficiency we use the volumetric size of the segment st . We first compute the length and width (l1 , l2 ) of a bounding box fit to the segment st . We now define zts to be the set {d, l1 , l2 }, where d was defined in Section IV-B2. For each class, we model the size of an average segment for that class by a Gaussian with parameters µi,c and σi,c along each dimension i. However, a partially occluded segment may appear smaller than this; thus, we compute the probability along each dimension as � � ( −(li −µi,c )2 exp , if li ≥ µi,c 2 2σi,c pV (li |Nt , c) = η4 (19) 1, otherwise. where η4 is a normalization constant. If Nt = f alse (i.e. the points in st consist of more than one object), we expect the segment to be bigger than average with a large variance. We thus compute this probability as 0 pV (li |¬Nt , c) = N (li ; µ0i,c , σi,c )
(20)
We now describe how we use the probabilistic model described above, combining spatial, temporal, and (optionally) semantic information to improve our scene segmentation. A. Splitting After obtaining an initial coarse segmentation, we iterate over all of our initial segments st and compute the probability p(Nt |zt , S1..t−1 ) using equation 8 to determine whether the segment should be further split. Although the initial segmentation might only use spatial information, the computation of p(Nt |zt , S1..t−1 ) also incorporates semantic and temporal information, allowing us to make a more informed decision about how to segment the points in st . We defined Nt = f alse if the points in st belong to more than one object. Thus if p(¬Nt |zt , S1..t−1 ) > 0.5, we conclude that the segment st represents more than one object and should be split into smaller segments. The details of this splitting operation are explained in Section VI-C. B. Merging After all of our segments have been split using spatial, semantic, and temporal information, some objects may have become oversegmented. We now use our probabilistic model to determine when to merge some of these segments back together. To do this, we iterate over pairs of segments st,i and st,j , and we propose a merge of these segments to create a single merged segment st,ij = st,i ∪ st,j with features zt,ij . We then compute the probability p(Nt |zt,ij , S1..t−1 ) for this proposed merged segment, again using equation 8. If p(Nt |zt,ij , S1..t−1 ) > 0.5, then we conclude that these two segments are actually part of one object and we merge them together; otherwise, we keep these two segments separate. We continue to merge segments until no more segments can be merged, meaning that our segmentation has converged. VI. I MPLEMENTATION D ETAILS A. Approximations In order to make our method run in real-time, we have to perform a number of approximations. For example, in equation 1, we sum over all data associations for segment st . However, segment st can match to any number of segments
from the previous frame; if there are n segments in the previous frame, then there are 2n possible data associations. However, it is not necessary to compute all of these associations, since we only want to know whether segment st consists of one object or more than object. Therefore, we simplify the problem by only considering matches to either single segments, to pairs of segments, or to no segments from the previous frame. Formally, we only consider values of at where 0, 1, or 2 elements are equal to 1 and the rest are equal to 0. Thus we only need to consider n2 + n + 1 potential data associations, making this summation much faster to compute. Further, if a segment from the previous frame is sufficiently far away from the current segment, then it will likely not contribute very much to this probability, so we do not need to consider this segment for data association. Additionally, when we match to a single segment in the previous frame, we use the prior probability in the recursive computation, i.e. p1 (Nt−1 |zt−1 , S1..t−2 ) ≈ p1 (Nt−1 ), which speeds up our method at little cost in accuracy. We still compute the probability p(Nt−1 |zt−1 , S1..t−2 ) recursively when we consider a data association to multiple prior segments. We precompute the class probability p(c|at , s1..t−1 ) for each individual segment st−1 . For efficiency reasons, we therefore do not use semantics when conditioning on a value of at such that st matches to more than one previous segment. B. Lazy computation Normally, when using a Bayes filter, we take advantage of the Markov property: when computing frame t, we only need information from frame t − 1, so we do not need to keep any prior information. However, in our segmentation framework, we only need a subset of the information from the previous frame. Thus, we instead perform a lazy computation: we keep the last T frames of data, and we make use of the prior information only as needed for our recursive computation p(Nt−1 |zt−1 , S1..t−2 ). This allows our method to be much more efficient, because we do not need to compute probabilities for pairs of segments until needed by our framework. C. Splitting Operation As described above, we use our probabilistic framework to decide which segments st represent more than one object and therefore must be split into smaller segments. Once the decision to split segment st is made, the segment can be split using a variety of methods. We split the segment using spatial and temporal information as described below. 1) Temporal Splitting: First, we attempt to split segment st by matching it to segments from the previous frame. If more than one segment from the previous frame matches to segment st with high probability, then we split st based on the shape of those previous segments. First, we find the segments st−1,1 · · · st−1,n from the previous frame that have a strong match to the segment st in the current frame according to equation 11. Next, we compute whether these segments from the previous frame are likely to represent different objects; they may have merely been the
result of a previous oversegmentation. To do this, we take all pairs of these matching segments st−1,i and st−1,j and we merge each pair into a single segment st−1,ij . We then compute p(Nt−1 |zt−1,ij , S1..t−2 ) for this merged segment using equation 8. If p(¬Nt−1 |zt−1,ij , S1..t−2 ) > 0.5, then we assume that st−1,i and st−1,j belong to two different objects and can be used for temporal splitting. We then find the set of segments st−1,1 · · · st−1,m with a strong match to st that are all estimated to represent different objects. To perform the split, for each point in the current frame pi ∈ st , we compute the probability pP (pi |at , z1..t−1,j ) from equation 11 to match this point to each segment st−1,j from the previous frame. We assign point pi to the segment with the highest probability, and then the point assignments define a set of m new segments that get created. Using this approach, we split segment st into m new segments by matching the points in st to segments from the previous frame. 2) Spatial Splitting: The temporal splitting process described above may not lead to the segment st being split into multiple segments, for various reasons. The segment st may not match to any previous segment with high probability, or these previous segments could have resulted from an oversegmentation. In such a case, we will split segment st using spatial information, using a smaller threshold than was used in our initial segmentation. Note that we would not want to apply such a small threshold to all segments; however, we have determined using semantic and temporal information that segment st is too large, so a smaller threshold may be used. In our implementation, we split segment st using the Euclidean clustering method in PCL [18, 19], with a clustering threshold based on the sensor resolution r, ensuring that all points in each segment are at least k3 r from all points in a neighboring segment, for some constant k3 chosen using our training set. D. Pre- and Post-processing As a pre-processing step, we remove the points that belong to the ground using the method of Montemerlo et al. [15]. The initial coarse segmentation for our method is obtained using the Flood-fill method of Teichman et al. [24], extended to use a 3D obstacle grid. After segmentation, we perform data association using the position probability of Section IV-B1. We next estimate a velocity for each object using the tracker of Held et al. [7]. Finally, we classify these segments using the boosting framework of Teichman and Thrun [23], and we use the same classes as in that reference: pedestrians, bicyclists, cars, and background (which we refer to as unknown). The velocity and classification estimates are used to provide temporal and semantic cues to improve the segmentation, as we have described. We find the components listed here to be both fast and accurate; however, any method for ground-detection, tracking, and 3D classification may be used. VII. E VALUATION Below we discuss our quantitative evaluation. A video demonstrating our segmentation performance can be found on the project website.
Dataset: We evaluate our segmentation method on the KITTI tracking dataset [3, 4, 5]. The KITTI dataset was collected from a moving car on city streets in Karlsruhe, Germany for the purpose of evaluating perception for autonomous driving. The 3D point clouds are recorded with a Velodyne HDL-64E 64-beam LIDAR sensor, which is often used for autonomous driving [15, 16, 26]. This dataset is publicly available and consists of over 42,000 3D bounding box labels on almost 7,000 frames across 21 sequences. Although the bounding boxes do not create point-wise accurate segmentation labels, the segments produced by these bounding boxes are sufficiently accurate to evaluate our method. We use 2 of these sequences to train our method and select parameters, and the remaining 19 sequences are used for testing and evaluation. The specific parameter values chosen using our training set are listed in the project website. Although the KITTI tracking dataset has been made publicly available, the dataset has typically been used to evaluate only tracking and object detection rather than evaluating segmentation directly. However, segmentation is an important step of a 3D perception pipeline, and errors in segmentation can cause subsequent problems for other components of the system. Because the KITTI dataset is publicly available, we encourage other researchers to evaluate their 3D segmentation methods on this dataset using the procedure that we describe here. Evaluation Metric: The output of our method is a partitioning of the points in each frame into disjoint subsets (“segments”), where each segment is intended to represent a single object instance. The KITTI dataset has labeled a subset of objects with a ground-truth bounding box, indicating the correct segmentation. We wish to evaluate how well our segmentation matches the ground-truth for the labeled objects. To evaluate our segmentation, we assign a best-matching segment to each ground-truth bounding box. For each groundtruth bounding box gt, we find the set of non-ground points within this box, Cgt . For each segment s, let Cs be the set of points that belong to this segment. We then find the best-matching segment to this ground-truth bounding box by computing s = arg max |Cs0 ∩ Cgt |
(22)
s0
The best-matching segment is then assigned to this groundtruth bounding box for the evaluation metrics described below. We describe on the project website how the intersectionover-union metric on 3D points [26] is non-ideal for autonomous driving because this score penalizes undersegmentation errors more than oversegmentation errors. Instead, we propose to count the number of oversegmentation and undersegmentation errors directly. Roughly speaking, an undersegmentation error occurs when an object is segmented together with a nearby object, and an oversegmentation error occurs when a single object is segmented into multiple pieces. More formally, we count the fraction of undersegmentation errors as � 1 X � |Cs ∩ Cgt | < τu (23) 1 U= N gt |Cs |
where 1 is an indicator function that is equal to 1 if the input is true and 0 otherwise and where τu is a constant threshold. We count the fraction of oversegmentation errors as � 1 X � |Cs ∩ Cgt | O= < τo , 1 (24) N gt |Cgt | where τo is a constant threshold. In our experiments, we choose τu = 0.5 to allow for minor undersegmentation errors as well as errors in the ground-truth labeling. We use τo = 1, since even a minor oversegmentation error causes a new (false) object to be created. We do not evaluate oversegmentations or undersegmentations when two ground-truth bounding boxes overlap. In such cases, it is difficult to tell whether the segmentation result is correct without more accurate groundtruth segmentation annotations (i.e. point-wise labeling instead of bounding boxes). Examples of undersegmentation and oversegmentation errors are shown in Figure 2. Undersegmenta+on
Correct
Oversegmenta+on
Correct
Fig. 2. Examples of an undersegmentation error (top) and an oversegmentation error (bottom). Each color denotes a single segment, and the ground-truth annotations are shown with a purple box, where each box represents a single object instance. (Best viewed in color)
We then compute an overall error rate based on the total number of undersegmentation and oversegmentation errors, as E = U + λc O
(25)
where λc is a class-specific weighting parameter that penalizes oversegmentation errors relative to undersegmentation errors. For our experiments we simply choose λc = 1 for all classes, but λc can also be chosen for each application based on the effect of oversegmentation and undersegmetation errors for each class on the final performance. VIII. R ESULTS Baselines: We compare our segmentation method to a number of baseline methods. First, we compare to the Floodfill method of Teichman et al. [24], which is also used as a pre-processing step for our method. We also compare to the Euclidean Clustering (EC) method of Rusu [18], which was applied to segmentation of urban scenes in Ioannou et al. [10]. We evaluate the method of Rusu [18] using cluster tolerances of 0.1 m, 0.2 m, or 1 m (EC 0.1, EC 0.2, EC 1). Finally, we compare to the method of Wang et al. [26], which also incorporates semantic information into the segmentation. Because the code of Wang et al. [26] was not available,
% Oversegmentation Errors
35 30 25
Baseline − Flood−fill Baseline − EC 0.1 Baseline − EC 0.2 Baseline − EC 1 Baseline − Wang1 Baseline − Wang2 Baseline − Wang3 Ours
20 15 10 5 0 0
stand in crowds. Further, pedestrians and bicyclists may move close to parked cars, or they may move past cars at a crosswalk, causing the assumptions of this method to fail to hold. Ablative analysis: To understand the cause for the improvement in performance, we separately analyze the benefit of using only temporal information and only semantic information, shown in Table I. As can be seen, adding either temporal or semantic information alone results in small improvements in performance. However, the largest gains are achieved by combining spatial, semantic, and temporal information, thus showing that all three components are important for the accuracy of our system.
10 20 30 % Undersegmentation Errors
Fig. 3. Oversegmentation vs Undersegmentation errors for a variety of segmentation methods. Best-performing methods appear in the lower-left corner of the graph.
we re-implemented their method. We classify segments using the method of Teichman and Thrun [23]. The initial segmentation for this method is obtained using Flood-fill [24], and the post-processing step is obtained using Euclidean Clustering with a dynamic cluster tolerance chosen based on the sensor resolution. This setup was the best-scoring implementation of their method that we were able to achieve. We experiment with three different parameter settings for this method (Wang1, Wang2, Wang3). Baseline Comparison: Our method operates on the full point-cloud in real-time, and we improve the segmentation at all distances. However, our analysis focuses on segments within 15 m because these are the objects that our autonomous vehicle will most immediately encounter. The segmentation evaluation is shown in Figure 3, for segments within 15 m. Combining oversegmentation and undersegentation errors, our method has the lowest error rate of 10.2%, compared to the Flood-fill baseline [23] with 19.4%. Our method thus reduces the total number of oversegmentation and undersegmentation errors by 47%, thus demonstrating the benefit of combining spatial, temporal, and semantic information for 3D segmentation. Our method runs in real-time, taking an average of 33.7 ms per frame, or 29.7 Hz, not including the initial coarse segmentation of [24] which requires an additional 19.6 ms. The Euclidean Clustering baselines achieved error rates of 23%, 26%, or 40% (for different parameter settings). The method of Wang et al. [26] achieved error rates of 20.9%, 21.3% or 22.3% (for different parameter settings). Although this method incorporates semantic information, they make assumptions that do not hold in crowded environments. Their method assumes that, after removing the ground points and background objects, the remaining objects can be segmented using a spatial clustering approach. Their underlying assumption is that foreground objects tend to remain separated from each other in 3D space. Although this assumption may hold true for cars, it does not hold true for pedestrians, which often
Method Spatial only [24] Spatial + Temporal Spatial + Semantic Spatial + Semantic + Temporal
% Errors (< 15 m) 19.4 16.4 15.4 10.2
% Errors (all) 11.6 10.8 10.8 8.2
TABLE I S EGMENTATION ACCURACIES FOR VARIOUS VERSIONS OF OUR METHOD .
Performance Analysis: We evaluate the effect of classification on segmentation by separately evaluating our segmentation performance on objects that we classify correctly compared to objects that we classify incorrectly. For objects that we classify correctly, we reduce the segmentation errors by 48.4%, compared to 5.8% for objects that we classify incorrectly (for objects at all distances). Thus, improving the classification accuracy can lead to significant gains in our segmentation performance, when using our method which combines spatial, temporal, and semantic information. Effect on Tracking: Finally, we show the effect of segmentation accuracy on object tracking. In the KITTI tracking dataset, the ground-truth bounding boxes are also annotated with object IDs, so we are able to compute the number of ID switches of our system. Using our segmentation method, we get 25% fewer ID switches compared to the baseline [24] Thus, accurate segmentation is also important for accurate tracking. Because segmentation occurs at the beginning of the perception system, errors in segmentation can propagate throughout the rest of the system, and improving segmentation will improve other aspects of the system such as tracking, as we have shown. IX. C ONCLUSION To perform accurate 3D segmentation, it is not sufficient to only use the spatial distance between points, as there will be many ambiguous cases caused by occlusions or neighboring objects. Our method is able to incorporate spatial, semantic, and temporal cues in a coherent probabilistic framework for 3D segmentation. We are able to significantly reduce the number of segmentation errors while running in only 34 ms. Robotic systems should thus combine spatial, temporal, and semantic information to achieve accurate real-time segmentation and more reliable perception in dynamic environments.
R EFERENCES [1] Asma Azim and Olivier Aycard. Detection, classification and tracking of moving objects in a 3d environment. In Intelligent Vehicles Symposium (IV), 2012 IEEE, pages 802–807. IEEE, 2012. [2] Bertrand Douillard, James Underwood, Noah Kuntz, Vsevolod Vlaskine, Alastair Quadros, Peter Morton, and Alon Frenkel. On the segmentation of 3d lidar point clouds. In Robotics and Automation (ICRA), 2011 IEEE International Conference on, pages 2798–2805. IEEE, 2011. [3] Jannik Fritsch, Tobias Kuehnl, and Andreas Geiger. A new performance measure and evaluation benchmark for road detection algorithms. In International Conference on Intelligent Transportation Systems (ITSC), 2013. [4] Andreas Geiger, Philip Lenz, and Raquel Urtasun. Are we ready for autonomous driving? the kitti vision benchmark suite. In Conference on Computer Vision and Pattern Recognition (CVPR), 2012. [5] Andreas Geiger, Philip Lenz, Christoph Stiller, and Raquel Urtasun. Vision meets robotics: The kitti dataset. International Journal of Robotics Research (IJRR), 2013. [6] Saurabh Gupta, Ross Girshick, Pablo Arbel´aez, and Jitendra Malik. Learning rich features from rgb-d images for object detection and segmentation. In Computer Vision– ECCV 2014, pages 345–360. Springer, 2014. [7] David Held, Jesse Levinson, Sebastian Thrun, and Silvio Savarese. Combining 3d shape, color, and motion for robust anytime tracking. In Proceedings of Robotics: Science and Systems, Berkeley, USA, July 2014. [8] Evan Herbst, Xiaofeng Ren, and Dieter Fox. Rgbd flow: Dense 3-d motion estimation using color and depth. In Robotics and Automation (ICRA), 2013 IEEE International Conference on, pages 2276–2282. IEEE, 2013. [9] Steven Hickson, Stan Birchfield, Irfan Essa, and Helen Christensen. Efficient hierarchical graph-based segmentation of rgbd videos. In Computer Vision and Pattern Recognition (CVPR), 2014 IEEE Conference on, pages 344–351. IEEE, 2014. [10] Yani Ioannou, Babak Taati, Robin Harrap, and Michael Greenspan. Difference of normals as a multi-scale operator in unorganized point clouds. In 3D Imaging, Modeling, Processing, Visualization and Transmission (3DIMPVT), 2012 Second International Conference on, pages 501–508. IEEE, 2012. [11] Klaas Klasing, Dirk Wollherr, and Martin Buss. A clustering method for efficient segmentation of 3d laser data. In ICRA, pages 4043–4048, 2008. [12] Abhijit Kundu, Yin Li, Frank Dellaert, Fuxin Li, and James M Rehg. Joint semantic segmentation and 3d reconstruction from monocular video. In Computer Vision–ECCV 2014, pages 703–718. Springer, 2014. [13] Kevin Lai, Liefeng Bo, Xiaofeng Ren, and Dieter Fox. Detection-based object labeling in 3d scenes. In Robotics
[14]
[15]
[16]
[17]
[18]
[19]
[20]
[21]
[22]
[23]
[24]
[25] [26]
and Automation (ICRA), 2012 IEEE International Conference on, pages 1330–1337. IEEE, 2012. John Leonard, Jonathan How, Seth Teller, Mitch Berger, Stefan Campbell, Gaston Fiore, Luke Fletcher, Emilio Frazzoli, Albert Huang, Sertac Karaman, et al. A perception-driven autonomous urban vehicle. Journal of Field Robotics, 25(10):727–774, 2008. Michael Montemerlo, Jan Becker, Suhrid Bhat, Hendrik Dahlkamp, Dmitri Dolgov, Scott Ettinger, Dirk Haehnel, Tim Hilden, Gabe Hoffmann, Burkhard Huhnke, et al. Junior: The stanford entry in the urban challenge. Journal of field Robotics, 25(9):569–597, 2008. Frank Moosmann and Christoph Stiller. Joint selflocalization and tracking of generic objects in 3d range data. In Robotics and Automation (ICRA), 2013 IEEE International Conference on, pages 1146–1152. IEEE, 2013. Anna Petrovskaya and Sebastian Thrun. Model based vehicle detection and tracking for autonomous urban driving. Autonomous Robots, 26(2-3):123–139, 2009. Radu Bogdan Rusu. Semantic 3D Object Maps for Everyday Manipulation in Human Living Environments. PhD thesis, Computer Science department, Technische Universitaet Muenchen, Germany, October 2009. Radu Bogdan Rusu and Steve Cousins. 3D is here: Point Cloud Library (PCL). In IEEE International Conference on Robotics and Automation (ICRA), Shanghai, China, May 9-13 2011. Sabyasachi Sengupta, Eric Greveson, Ali Shahrokni, and Philip HS Torr. Urban 3d semantic modelling using stereo vision. In Robotics and Automation (ICRA), 2013 IEEE International Conference on, pages 580–585. IEEE, 2013. Luciano Spinello, Kai Oliver Arras, Rudolph Triebel, and Roland Siegwart. A layered approach to people detection in 3d range data. In AAAI, 2010. J¨org St¨uckler and Sven Behnke. Efficient dense rigidbody motion segmentation and estimation in rgb-d video. International Journal of Computer Vision, pages 1–13, 2015. Alex Teichman and Sebastian Thrun. Group induction. In Intelligent Robots and Systems (IROS), 2013 IEEE/RSJ International Conference on, pages 2757–2763. IEEE, 2013. Alex Teichman, Jesse Levinson, and Sebastian Thrun. Towards 3d object recognition via classification of arbitrary object tracks. In Robotics and Automation (ICRA), 2011 IEEE International Conference on, pages 4034– 4041. IEEE, 2011. Sebastian Thrun, Wolfram Burgard, and Dieter Fox. Probabilistic robotics. MIT press, 2005. Dominic Zeng Wang, Ingmar Posner, and Paul Newman. What could move? finding cars, pedestrians and bicyclists in 3d laser data. In Robotics and Automation (ICRA), 2012 IEEE International Conference on, pages 4038– 4044. IEEE, 2012.
[27] Nicolai Wojke and M Haselich. Moving vehicle detection and tracking in unstructured environments. In Robotics and Automation (ICRA), 2012 IEEE International Conference on, pages 3082–3087. IEEE, 2012. [28] Chenliang Xu, Caiming Xiong, and Jason J Corso. Streaming hierarchical video segmentation. In Computer Vision–ECCV 2012, pages 626–639. Springer, 2012. [29] Chenliang Xu, Spencer Whitt, and Jason J Corso. Flattening supervoxel hierarchies by the uniform entropy slice. In Computer Vision (ICCV), 2013 IEEE International Conference on, pages 2240–2247. IEEE, 2013.