A Probabilistic Framework for Recognizing Intention in Information Graphics∗ ∗Stephanie Elzer, ∗∗Sandra Carberry, ∗ ∗ ∗Ingrid Zukerman, ∗∗Daniel Chester, ∗ ∗ ∗∗Nancy Green, ∗∗Seniz Demir ∗Dept. of Computer Science, Millersville University, Millersville, PA 17551 ∗∗Dept. of Computer Science, University of Delaware, Newark, DE 19716 ∗ ∗ ∗School of Comp. Science and Software Engrg, Monash University, Clayton, Victoria 3800 Australia ∗ ∗ ∗∗Dept. of Mathematical Sciences, Univ. of North Carolina at Greensboro, Greensboro, NC 27402 Abstract This paper extends language understanding and plan inference to information graphics. We identify the kinds of communicative signals that appear in information graphics, describe how we utilize them in a Bayesian network that hypothesizes the graphic’s intended message, and discuss the performance of our implemented system. This work is part of a larger project aimed at making information graphics accessible to individuals with sight impairments.
1
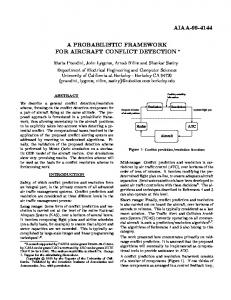
ule (IRM). The IRM is responsible for recognizing the intended message of the information graphic and sending it to the content planning module (CPM), which will augment the intended message with related interesting features of the graphic. The message organization module (MOM) will then organize the most salient propositions into a coherent summary, which will be rendered in natural language and conveyed to the user via speech synthesis. The followup question module (FQM) will allow the user to interactively seek additional information about the graphic.
Introduction
For individuals who have serious sight impairments, documents that contain information graphics (bar charts, line graphs, etc.) pose challenging problems. Although devices have been developed for conveying information graphics in alternative mediums such as musical tones or tactile images, these approaches have serious limitations. For example, they often require expensive equipment, as well as requiring the user to construct a “mental map” of the graphic, which is difficult for congenitally blind users who do not have the personal knowledge to assist them in the interpretation of the image [Kennel, 1996]. The underlying hypothesis of our work is that alternative access to what the graphic looks like is not enough — the user should be provided with the message and knowledge that one would gain from viewing the graphic in order to enable effective and efficient use of this information resource. We are developing an interactive natural language system which infers the intended message of an information graphic, provides a summary that includes the intended message along with notable features of the graphic, and then responds to follow-up questions from the user. Figure 1 shows the architecture of our system. The visual extraction module (VEM) analyzes the graphic and provides an XML representation of the graphic to the caption tagging module (CTM) which extracts information from the caption and passes the augmented XML representation to the intention recognition mod∗
Authors can be reached via email as follows:
[email protected], {carberry, chester, demir}@cis.udel.edu,
[email protected],
[email protected].
Figure 1: System Architecture This paper identifies the communicative signals that appear in information graphics and discusses how we exploit them in a Bayesian network that hypothesizes a graphic’s intended message. It concludes with several illustrative examples and an evaluation of our system’s performance, which provides strong evidence of the effectiveness of our methodology. To our knowledge, our work is the first to extend plan recognition to the domain of information graphics.
2
Approach
Language research has posited that a speaker or writer executes a speech act whose intended meaning he expects the listener to be able to deduce, and that the listener identifies the intended meaning by reasoning about the observed signals and the mutual beliefs of author and interpreter [Grice, 1969]. However, as [Clark, 1996] noted, language is more than just words. It is any “signal” (or lack of signal when one is expected), where a signal is a deliberate action that is intended
Local bankruptcy personal filings
ator consisting of: • Goal: the goal that the operator achieves • Data Requirements: requirements which the data must satisfy in order for the operator to be applicable in a graphic planning paradigm • Display Constraints: features that constrain how the information graphic is eventually constructed if this operator is part of the final plan • Body: lower-level subgoals that must be accomplished in order to achieve the overall goal of the operator
3000 2500 2000 1500 1000
1998
1999
2000
2001
Figure 2: Graphic from a 2001 Local Newspaper to convey a message. Although some information graphics are only intended to display data values,1 the overwhelming majority of information graphics from popular media sources appear to have some underlying goal or intended message, such as the graphic in Figure 2 whose communicative goal is ostensibly to convey the sharp increase in local bankruptcies in 2001 compared with the previously decreasing trend. Applying Clark’s view of language to information graphics, it is reasonable to presume that the author of an information graphic expects the viewer to deduce the message that he intended to convey by reasoning about the graphic itself, the salience of entities in the graphic, and mutual beliefs. Beginning with the seminal work of [Perrault and Allen, 1980], researchers have applied plan inference techniques to a variety of problems associated with understanding utterances, particularly within dialogue. Given domain knowledge in the form of operators that decompose goals into a sequence of subgoals, along with evidence in the form of an observed action (such as an utterance), a plan inference system can chain backwards on the plan operators to deduce one or more high-level goals that might have led the agent to perform the observed action as part of an overall plan for achieving his goal(s). The high-level communicative goals in the plan capture the utterance’s intended meaning. In their work on intelligent multimedia generation, the AutoBrief group proposed that speech act theory can be extended to the generation of graphical presentations [Kerpedjiev and Roth, 2000]. When designing an information graphic, the designer has one or more high-level communicative goals. He constructs a graphic that he believes will enable the viewer to perform certain perceptual and cognitive tasks which, along with other knowledge, will enable the viewer to recognize the graphic’s intended message [Kerpedjiev and Roth, 2000]. By perceptual tasks we mean tasks that can be performed by simply viewing the graphic, such as finding the top of a bar in a bar chart; by cognitive tasks we mean tasks that are done via mental computations, such as computing the difference between two numbers. In our research, we extend plan inference techniques to inferring intention from information graphics. Our plan operators capture knowledge about how the graphic designer’s goal of conveying a message can be achieved via the viewer performing certain perceptual and cognitive tasks, as well as knowledge about how perceptual and cognitive tasks decompose into sets of simpler tasks. Figure 3 displays a plan oper1
[Yu et al., 2002] developed a pattern recognition algorithm for summarizing interesting features of automatically generated graphics of time-series data from a gas turbine engine.
For plan recognition, the plan operators facilitate chaining backwards from perceptual tasks that can be performed on a given graphic, to hypothesize candidate goals and plans. The display constraints are used in reverse, that is, to eliminate operators from consideration (i.e., if the graphic does not satisfy the constraints on the display, then the operator could not have been part of a plan that produced the graphic). The data requirements are used to instantiate parameters in the operator (i.e., the data must have had certain characteristics for the operator to have been included in the designer’s plan, and these limit how the operator’s arguments can be instantiated). Following the work of [Charniak and Goldman, 1993] and others, we capture plan inference in a probabilistic framework. We use our plan operators, along with the evidence that we glean from the information graphic itself, to construct a Bayesian network which allows us to reason about the likelihood of various candidate plans.
3
Network Structure
Although we believe that our findings are extendible to other kinds of information graphics, our current work focuses on bar charts. Our analysis of simple bar charts2 has shown that the intended message can be classified into one of 12 highlevel categories; examples of such categories are: • GetRank: Viewer to believe that is ranked among the entities in the graphic • Change-trend: Viewer to believe that there is a trend from to and a significantly different trend from to • Relative-difference: Viewer to believe that the value of element is the value of element , where is greaterthan, less-than, or equal-to. The top-level node in our network captures the likelihood of all of the possible categories of high-level intentions underlying a graphic. The entry with the highest probability in this node represents the category most likely to represent the graphic designer’s primary intention or communicative goal for the graph. Each individual category of high-level goal is represented as a child of this top-level node. We refer to the process of replacing one or more of the parameters of a goal or perceptual task with specific elements or entities of the graphic as instantiating that goal or task. The network nodes 2
We are not yet considering composite or grouped bar charts.
Goal: RankFromBar(, , , , , ) Gloss: Viewer to believe from graphic that the element of dataset depicted as bar with the value for primary key has a value for that is among the values of associated with elements displayed on graphic Data Requirements: 1. is the primary key attribute for dataset 2. is a dependent attribute for dataset 3. The values of have a natural ordering along a quantitative scale 4. The value of for has rank among the elements of Display Constraints: 1. Graph is a bar chart 2. For each value of in dataset , the value of and associated value of is displayed via a bar on graph Body: 1. PerceiveRank: Viewer can perform the perceptual task of finding the relative to of bar in graph 2. GetLabel: Viewer can perform the perceptual task of finding the value for where corresponds with the bar on graph
Figure 3: Operator for finding the rank of a particular bar
Figure 5: Alternative Ways of Achieving the Same Goal Figure 4: Top levels of Belief Network
in the top two levels are not instantiated. Specific instantiations appear in the network as children of the nodes representing the high-level intentions. For example, the GetRank node is shown with several children in Figure 4, illustrating several of its possible instantiations — namely, finding the rank of the first, second, or third bar in the graphic. (For readability, only the instantiation of the bar parameter < bi > in each GetRank node is shown in Figure 4.) These are alternative instantiations and so inhibitory links [Huber et al., 1994] are used to capture their mutual exclusivity. The child node of GetRank with the highest probability represents the instantiation of that goal most likely to be part of the graphic designer’s intended plan. Therefore, if the entry for GetRank has the highest probability in the IntendedMessage root node, our system selects the instantiated child node of GetRank with the highest probability, and produces the instantiated version of GetRank as its hypothesis about the intended message of the graphic. If there are multiple ways for a goal to be achieved, these are captured as children of the instantiated goal node. For example, a viewer might come to believe that the United States ranks third in GDP per capita in one of two ways: 1) he might seek out the bar for the U.S. and perceive that it is the third highest bar in the graph, or 2) he might notice the bar representing the U.S. in the graphic (perhaps it is a different color), and perceive that that bar is the third highest in the graph and that it represents the GDP per capita for the U.S. These possibilities are captured respectively as RankFromLabel and RankFromBar in Figure 5.
The nodes in the top levels of the network, representing the high-level intentions and the alternative ways of achieving them (Figure 4), exist in every network and are added at the beginning of the network construction process. Nodes representing perceptual tasks (the lowest-level nodes in the network) are then added, and upward chaining via the plan operators adds higher level goals until a link is established to one of the top-level goal nodes shown in Figure 4. However, automatically adding to the network all of the possible instantiations of all possible perceptual tasks rapidly becomes infeasible due to the overwhelming size of the resultant network and practical constraints on memory. Thus, instead of constructing the network a priori to include every possible instantiation of each task, the network is built dynamically (using the API for Netica [Norsys, 2005]) when the system is presented with a new information graphic, and nodes are added to the network only as suggested by communicative signals in the graphic, as discussed in the next two sections.
4
Communicative Signals
In plan recognition systems involving dialogue, the communicative signals are naturally centered around the utterances, and the inference process uses signals such as the surface form of the utterance, the focus of attention in the dialogue, etc. Following AutoBrief [Kerpedjiev and Roth, 2000] [Green et al., 2004], we contend that when constructing a graphic, the designer made certain design decisions in order to make “important” tasks (the ones that the viewer is intended to perform in getting the graphic’s message) as easy or as salient as possible. The realization of these design decisions in the information graphic serve as communicative signals. The rest of this section identifies the kinds of com-
municative signals that appear in information graphics, and Section 5 discusses how these signals are used in our plan inference framework.
4.1 Effort as a Communicative Signal The design choices made by the graphic designer facilitate some perceptual tasks more than others. For example, if the viewer is intended to compare the height of two bars, placing the two bars beside each other in the graphic will facilitate the comparison task. Thus the relative effort required for a perceptual task serves as a communicative signal about what tasks the designer expects the viewer to perform.
the graphic, then it signals the salience of the graphic element associated with that label. Certain verbs and adjectives in captions also serve as communicative signals. In this case, the verbs and adjectives signal the salience of certain highlevel tasks. For example, the adjective highest in the caption “Highest in GDP” suggests that the viewer should find the maximum in the graphic, whereas the verb beats in the caption “U.S. Beats Japan” indicates that the viewer should note the relative difference in value between the U.S. and Japan. [Elzer et al., 2005] presents our work on exploiting captions in understanding information graphics.
5
Our working hypothesis is that if the graphic designer goes to the effort of employing attention-getting devices to make certain elements of the graphic particularly salient, then the salient elements serve as communicative signals — i.e., the designer probably intends for them to be part of the intended message of the graphic.
The communicative signals gleaned from an information graphic can be exploited for two purposes: 1) to select perceptual task nodes for insertion in the network, and 2) as evidence that will influence the hypothesis about the graphic designer’s intentions. As discussed in Section 3, the Bayesian network must be restricted to those perceptual tasks suggested by the graphic. We use two kinds of communicative signals for this purpose: perceptual effort and salient elements. We developed a set of rules, based on research by cognitive scientists such as [Lohse, 1993], for estimating the required perceptual effort for a given perceptual task in a given graphic (eyetracking experiments validating these rules are detailed in [Elzer et al., 2004]). This set of rules is used to identify the set of instantiated perceptual tasks in a graphic that are easiest relative to others, and nodes representing these tasks are added to the network. In some graphics, these are the only communicative signals available. However, if there are salient elements in the graphic (such as a highlighted bar or a bar whose label appears as a noun in the caption), this salience signals that the element may play a role in the plan for achieving the intended message of the graphic. Therefore, we instantiate each possible perceptual task with the salient elements, add them to the network, and chain upward as described in Section 3 until a link is established to the top-level goal node. As nodes are added via upward chaining, their subgoals (as captured in the plan operators) are also added, so that perceptual tasks required to achieve these subgoals are included in the network even if they were not among the easiest or salient tasks. A Bayesian network also needs to explicitly record evidence that should influence the credibility of different hypotheses. Perceptual task effort and salient elements provide evidence about the intended message. For each perceptual task node in the network, evidence nodes are added as children of the perceptual task node, as shown in Figure 7 – in our diagrams, nodes representing evidence extracted from the graphic are shown with dashed outlines. For example, the Effort evidence node in Figure 7 captures the relative effort required for the perceptual task that is its parent, the Highlighting node captures whether a parameter in the perceptual task is instantiated with a highlighted element in the graphic, and the NounInCaption node captures whether a parameter in the perceptual task is instantiated with a bar whose label matches a noun in the caption. Certain verbs and adjectives in the caption are also com-
GDP Per Capita, 2001 (in thousands)
4.2 Salience as a Communicative Signal
40 30 20 10 0
Luxembourg Norway
U.S.
Switzerland
Japan
Denmark
Britain
Figure 6: Information Graphic Example3 Highlighting (via a difference in color or shading) is one way of signalling salience. Suppose that the bar for the U.S. was the only red bar in the graph shown in Figure 6. This would suggest that this bar is particularly relevant to the intended message of the graphic. Annotating individual elements with their exact values also signals salience. This is not the case when all of the elements are displayed with their exact values, since this is a general design feature of the graphic and does not draw attention to a specific subset of elements. Other salient entities include any element that is significantly taller than all of the other elements in the graphic and the most recent date on a time-line, since the viewer will certainly notice the height of a bar that is taller than all of the others, and will naturally be interested in what has occurred most recently. Although no specific action is required on the part of the graphic designer to make these elements salient, we posit that it is mutually believed by both designer and viewer that such elements will be salient to the viewer. Captions by themselves are often too general [Corio and Lapalme, 1999] or ill-formed to rely solely on them to identify what the graphic is intended to convey. However, we have found that captions often contain useful communicative signals [Elzer et al., 2005]. First, nouns in captions can function the same as highlighting; if the noun matches a label in 3 This is based on a U.S. News & World Report graphic in our corpus.
Exploiting the Communicative Signals
PerceiveRank() Only annotated and others annotated only others annotated no bars annotated
for achieving the posited intention of each graphic; the goalsubgoal relationships, including the low-level perceptual and cognitive tasks, were entered into the spreadsheet. Spreadsheet formulas were then constructed to compute all of the required conditional probability tables. Examples of the needed probability tables include: 1) the conditional probability of a particular perceptual task being easy, medium, hard or impossible given that the perceptual task is (or is not) part of the plan, 2) the conditional probability, for each class of verb, that the verb class appears in the caption given that the communicative goal of the graphic does (or does not) fall into a particular category of intention, and 3) the conditional probability of a bar being annotated given that recognizing the intended message entails (or does not entail) performing a particular perceptual task involving that bar. Figure 9 shows this latter conditional probability table.
7 7.1
Figure 8: Top-Level Node with Verb and Adjective Evidence
6
Gathering the Probabilities
In a Bayesian network, conditional probability tables capture the probability of each of the values of a child node given the value of its parent(s). In contrast to many other probabilistic plan recognition models where it is difficult to empirically determine the probabilities, the probabilities for our belief network have been obtained through a corpus analysis. We automated the construction of a spreadsheet containing information from each graphic needed to compute the necessary probabilities. Each graphic’s XML representation was analyzed to determine for each possible instantiation of each perceptual task: • the relative effort (categorized as easy, medium, hard, or impossible) as estimated by our effort estimation rules discussed in Section 5 • which parameters refer to elements that were salient in the graphic and the kind of salience (highlighted bars, annotated bars, bars with labels that appear as nouns in the caption, etc.) In addition, the occurrence in the caption of a verb or adjective class that suggested a particular intention was entered into the spreadsheet. Two coders had previously identified the intention of each graphic in the corpus. We applied our plan operators to construct a plan (constrained by what appeared in the graphic)
NotInPlan 2.3 0.9 19.5 77.3
Figure 9: A Sample Conditional Probability Table
Figure 7: Perceptual Task Node with Evidence Nodes municative signals that provide evidence about the intended message of an information graphic. Using Wordnet, we developed classes of verbs and adjectives where members of each class perform in a similar way within the domain of information graphic captions. (In the case of adjectives derived from verbs, such as the adjective growing in the caption A Growing Biotech Market, the adjective is treated as a verb using its root form.) For example, the class for the verb rise includes verbs such as increase, grow, expand, climb, and soar. Verb class and adjective class evidence nodes record which verb and/or adjective class (if any) appears in the caption; they are inserted as children of the top-level node as shown in Figure 8, since this type of evidence suggests a particular category of high-level intention.
InPlan 24.99 0.01 0.01 74.99
System Performance Illustrative Examples
The following examples illustrate how different kinds of evidence impact our system’s hypothesis. The examples are based on the bar chart in Figure 6. The XML representation of each example was produced by the Visual Extraction Module (VEM), augmented by the Caption Tagging Module (CTM), and then processed by the Intention Recognition Module (IRM) (see Figure 1). Given the graphic as it appears in Figure 6, our system hypothesizes that the graphic is intended to convey the relative rank in GDP of different countries and assigns this intention a likelihood of 87%. Other possibilities also have some probability assigned to them. For example, the intention of conveying that Luxembourg has the highest GDP is assigned a probability of 12.4% because the bars are in sorted order according to height, thus making it relatively easy for the viewer to recognize the maximum, and because finding the entity in the graphic with the maximum value is a fairly common intention (occurring approximately 22.7% of the time in our corpus). However, there is no other evidence suggesting that the bar representing the maximum value is salient (such as that bar being highlighted, or “Luxembourg” being mentioned in the caption), so the system hypothesizes that the viewer is intended to notice the relative rank of all of the countries listed. Suppose, however, that the bar representing the U.S. was darker than the other bars. Now, the hypothesis that the intended message of the graphic is to convey that the rank of the U.S. is third is assigned a probability of 99.5%. The fact that the bar is highlighted provides strong evidence that it plays a role in the intended message of the graphic. Elements of the graphic could also be made salient in other ways, such as through annotations. Suppose that the bar representing the U.S. was still darker than the other bars, but that the bars
representing the U.S. and Japan (and only those bars) were annotated with their exact values. Here the evidence still suggests the salience of the U.S., but also suggests that Japan is salient. The fact that both bars are now salient will provide evidence against intentions involving only the U.S. and will favor hypotheses involving both bars. Thus it is not surprising that the system hypothesizes the intention of the graphic to be finding the relative difference (and the degree of that difference) between the GDP of the U.S. and Japan and assigns it a likelihood of 87.3%. Now consider a significant variation of the graphic design. Suppose, again, that the bar representing the U.S. was darker than the other bars. But now suppose that the bars were sorted by the alphabetical order of their labels, rather than by descending order of their height. The perceptual task of determining the rank of the U.S. is now so difficult to perform that the system assigns only a negligible probability to the task of getting the rank of the U.S.
7.2 Overall Evaluation and Future Work To evaluate our system, we used leave-one-out cross validation. We performed a series of experiments in which each graphic in a corpus of 110 graphics is selected once as the test graphic. The data pertaining to the test graphic was removed from calculation of the probabilities used in the conditional probability tables. The test graphic was then presented to our intention recognition module, and the Bayesian network was constructed with probability tables acquired from the remaining graphics. The system was judged to fail if either its toprated hypothesis did not match the intended message that was assigned to the graphic by the coders or the probability rating of the system’s top-rated hypothesis did not exceed 50%. Overall success was then computed by averaging together the results of the whole series of experiments. Our overall accuracy was 79.1%. As a baseline, our most commonly occurring intention (at 23.6%) was a rising trend. Our success rate provides strong evidence of the success of our methodology. Most of the errors in our current evaluation are caused by sparseness of the data; for example, if we only have a single graphic using a verb like “stabilize” to indicate a stable trend, the leave-one-out validation will not have any evidence linking the verb class to the intention, and we may get an incorrect result when evaluating the graphic. We strongly believe that as we expand our corpus, our success rate will improve. We currently limit ourselves to recognizing what appears to be the primary communicative intention of an information graphic; in the future we will also consider secondary intentions. We will also extend our work to other kinds of information graphics such as line graphs and pie charts, and to complex graphics, such as composite bar charts.
8
Conclusion
This paper has presented a probabilistic framework that is the first to extend plan inference to the problem of recognizing the communicative message of an information graphic. We have identified the communicative signals that appear in information graphics and exploited them as evidence in a Bayesian belief network. The evaluation of our implemented system’s performance demonstrates the effectiveness of our
methodology, which offers promise as a means of providing access via natural language to information graphics for individuals with sight impairments.
References [Charniak and Goldman, 1993] E. Charniak and R. Goldman. A Bayesian model of plan recognition. Artificial Intelligence, 64(1):53–79, Nov. 1993. [Clark, 1996] H. Clark. Using Language. Cambridge University Press, 1996. [Corio and Lapalme, 1999] M. Corio and G. Lapalme. Generation of texts for information graphics. Proc. European Workshop on Natural Language Generation, 49–58, 1999. [Elzer et al., 2004] S. Elzer, S. Carberry, N. Green, and J. Hoffman. Incorporating perceptual task effort into the recognition of intention in information graphics. In Proceedings of the 3rd Int’l Conference on Diagrams, LNAI 2980, pages 255–270, March 2004. [Elzer et al., 2005] S. Elzer, S. Carberry, D. Chester, S. Demir, N. Green, I. Zukerman, and K. Trnka. Exploring and exploiting the limited utility of captions in recognizing intention in information graphics. In Proceedings of ACL, June 2005, to appear. [Green et al., 2004] Nancy Green, Giuseppe Carenini, Stephan Kerpedjiev, Joe Mattis, Johanna Moore, and Steven Roth. Autobrief: an experimental system for the automatic generation of briefings in integrated text and information graphics. International Journal of Human-Computer Studies, 61(1):32–70, 2004. [Grice, 1969] H. P. Grice. Utterer’s meaning and intentions. Philosophical Review, p. 147–177, 1969. [Huber et al., 1994] M. Huber, E. Durfee, and M. Wellman. The automated mapping of plans for plan recognition. In Proc. of the Conference on Uncertainty in Artificial Intelligence, July 1994. [Kennel, 1996] A. Kennel. Audiograf: A diagram-reader for the blind. In Second Annual ACM Conference on Assistive Technologies, p. 51–56, 1996. [Kerpedjiev and Roth, 2000] S. Kerpedjiev and S. Roth. Mapping communicative goals into conceptual tasks to generate graphics in discourse. In Intelligent User Interfaces, p. 157–164, 2000. [Lohse, 1993] G. Lohse. A cognitive model for understanding graphical perception. Human-Computer Interaction, 8:353–388, 1993. [Norsys, 2005] Norsys Software Corp.: Netica. http://www.norsys.com/netica.html. [Perrault and Allen, 1980] R. Perrault and J. Allen. A planbased analysis of indirect speech acts. American Journal of Computational Linguistics, 6(3-4):167–182, 1980. [Yu et al., 2002] J. Yu, J. Hunter, E. Reiter, and S. Sripada. Recognising visual patterns to communicate gas turbine time-series data. In A. Macintosh, R. Ellis, and F. Coenen, editors, Proceedings of ES2002, p. 105–118, 2002.