A Robust Estimator for Location in Phase I Based on an EWMA Chart INEZ M. ZWETSLOOT, MARIT SCHOONHOVEN, and RONALD J. M. M. DOES University of Amsterdam, Plantage Muidergracht 12, 1018 TV Amsterdam, The Netherlands In practice, a control chart for process monitoring (Phase II) is based on parameters estimated from data collected on the process characteristic under study (Phase I). The Phase I data could contain unacceptable data, which in turn could a↵ect the monitoring. In this study, we consider various estimation methods that are potentially relevant within the parameter estimation process. The quality of the Phase I study is evaluated in terms of the precision of the resulting estimates as well as the e↵ectiveness of the exploratory data analysis, where ‘e↵ectiveness’ is measured by the proportion of observations that are correctly identified as unacceptable. Moreover, we study the impact of the Phase I estimation method on the performance of the EWMA control chart in Phase II. Key Words: Changepoint; Control Chart; Estimation; Monitoring; Outliers; Statistical Process Control.
control charts use the history of the data to detect a change in the process mean. He pointed out that the Shewhart control chart only uses the current observation and therefore has no memory while, in contrast, the CUSUM control chart uses all of the history, paying equal attention to all past observations and the current observation. This is an oversimplification because, in fact, the CUSUM chart uses a decision rule whereby some of the past observations can become irrelevant. The third control chart variant, the EWMA control chart, gives less weight to data as they get older. The weight given to the current observation relative to earlier observations can be chosen by selecting a smoothing parameter between 0 and 1: a value of 1 means that all of the weight is assigned to the current observation and no weight to previous observations, equivalent to the Shewhart control chart, while a value of almost 0 results in a control chart with a long memory. We shall use these specific properties of the EWMA control chart in this paper.
1. Introduction charts are designed to monitor a proC cess characteristic through time. The original control chart was developed by Shewhart (1926, ONTROL
1931). To increase the sensitivity of the Shewhart control chart, additional decision rules may be appropriate (Western Electric Company (1956)). The first memory-type control chart was introduced by Page (1954) and is known as the cumulative sum (CUSUM) control chart. Another commonly used memory-type control chart is the exponentially weighted moving average (EWMA) control chart developed by Roberts (1959). Both control charts are able to detect small sustained changes in the process mean. Hunter (1986) provided a useful analysis of the degree in which the Shewhart, CUSUM, and EWMA
Ms. Zwetsloot is a Consultant in Statistics at IBIS UvA and PhD student. Her email address is
[email protected].
It is generally accepted in the literature that a control chart is implemented in two phases: Phase I, to define the stable state of the process characteristic and to estimate its distributional parameters; and Phase II, to monitor the process (Vining (2009), Chakraborti et al. (2009)). In a survey of Phase I analysis, Jones-Farmer et al. (2014) review the major issues and developments in Phase I analysis. One of the issues is the possibility of unacceptable data in Phase I, because these observations could have an
Dr. Schoonhoven is a Senior Consultant in Statistics at IBIS UvA and Associate Professor at the University of Amsterdam. Her email address is
[email protected]. Dr. Does is Professor of Industrial Statistics at the University of Amsterdam, Managing Director of IBIS UvA, and Director of the Institute of Executive Programmes of the University of Amsterdam. He is a Fellow of ASQ. His email address is
[email protected].
Journal of Quality Technology
302
Vol. 46, No. 4, October 2014
A ROBUST ESTIMATOR FOR LOCATION IN PHASE I BASED ON AN EWMA CHART
impact on Phase II performance. The present article studies several location estimation methods. We assess their e↵ectiveness in Phase I and their impact on Phase II EWMA control chart performance given that Phase I could contain unacceptable data. Let Yit , with i = 1, 2, . . . , n and t = 1, 2, . . . , denote the Phase II data, assumed to be independently and identically N (µ, 2 ) distributed when the process is on target. In Phase II, we wish to monitor the mean of the process characteristic and detect changes from its target as soon as possible. Throughout this article, we assume that the target is equal to µ. The EWMA control chart uses a weighted average of current and past observations as a monitoring statistic. At sampling stage t, the EWMA statistic is defined as Zt = (1
)Zt
1
+ Y t,
ˆ (where µ ˆ with Y t the mean of sample t, Z0 = µ denotes an estimate of µ), and the smoothing constant satisfying 0 < 1. A smaller implies a heavier reliance on the past and therefore a quicker detection of small, sustained shifts (cf. Lucas and Saccucci (1990)). Under the assumption of independently, identically, and normally distributed Yit , the ˆ mean and standard deviation of Zt are equal to µ and ˆZt , the latter estimated by r ˆ ˆZt = p [1 (1 )2t ]. n 2 Then the upper control limit (UCL) and lower control limit (LCL) can be determined by dt=µ ˆ + LˆZt UCL
dt=µ and LCL ˆ
LˆZt ,
where L is a positive coefficient which, together with , determines the performance of the EWMA control chart when the process is stable. When Zt falls d t or below LCL d t , the control chart signals above UCL unstable performance.
Jones et al. (2001) studied the EWMA control chart with estimated parameters and Saleh et al. (2014) studied the Shewhart control chart with estimated parameters. Both showed that, in order to have on average the performance of a control chart with known parameters, many more samples are needed than the 100 samples of size 5 recommended for the Shewhart control chart (see Quesenberry (1993)). For example, for EWMA control charts with = 0.5, 200 samples of size 5 are required. When = 0.1, 400 samples of size 5 are needed to achieve a performance similar to that of a control chart with
Vol. 46, No. 4, October 2014
303
known parameters. As argued by Jones (2002), these sample sizes are often unavailable in practice. To take account of the additional uncertainty, they develop an alternative design procedure that provides corrected values for L. Jones (2002) applied this new method in an example, and uses k = 50 samples of size n = 5 to estimate µ and . In our paper, we study the estimation of the distributional parameters when limited Phase I data are available and these data may contain contaminations, which is often the case in practice. Jensen et al. (2006) noted that “it seems appropriate to use estimators that will be robust to outliers, step changes, and other data anomalies in Phase I.” Numerous robust parameter estimates have been discussed in the literature (see Rocke (1989), Tatum (1997), among others). Another possibility is the use of Phase I Shewhart charts (see Chakraborti et al. (2009), Schoonhoven et al. (2011a)). Nazir et al. (2013) studied robust point location estimators in the context of Phase II monitoring with a CUSUM control chart. These methods are generally very useful where one occasional sample or observation is not acceptable. However, some processes are subject to sustained shifts. We therefore include a method particularly suited to detect sustained shifts, namely the changepoint method (for an overview see Amiri and Allahyari (2012)), and a new estimation method that makes use of the EWMA chart in Phase I. The methods are evaluated in terms of their impact on Phase II EWMA control chart performance, as well as in terms of the e↵ectiveness of the Phase I study itself. The Phase I study should be used as an exploratory data analysis tool and it is therefore important that unacceptable observations are identified. The article is organized as follows. The estimation methods outlined above are presented in Section 2. Both the set-up and the findings of the Phase I study are presented in Section 3. Section 4 describes the results for the Phase II context and, in Section 5, we summarize our conclusions and recommendations.
2. Phase I Estimation Methods In this section, we describe various estimation methods that can be used within Phase I, the exploratory data analysis stage. We consider point estimators and—especially useful for the detection of sustained shifts—a changepoint method. We also present estimation methods used in classical statistical process control (SPC) in Phase I. Let Xit , with i = 1, 2, . . . , n and t = 1, 2, . . . , k,
www.asq.org
304
INEZ M. ZWETSLOOT, MARIT SCHOONHOVEN, AND RONALD J. M. M. DOES
represent the Phase I observations, and assume Xit to be independently and identically N (µ, 2 ) distributed with mean µ and standard deviation if the process is stable. Throughout our study, we set k = 50 and n = 5, 10. 2.1. Point Estimators We consider two point estimators with di↵erent characteristics: the grand sample average X, known as the most efficient estimator for the location under uncontaminated normality, and the median of the sample averages M (X), known for its robustness against data anomalies (see Janacek and Meikle (1997)). The grand sample average is defined by ! k k n 1X 1X 1X X= Xt = Xit , k t=1 k t=1 n i=1
and the median of the sample averages by M (X) = median(X 1 , . . . , X k ). 2.2. Changepoint Methods
The changepoint method compares the log likelihood of all observations, under the assumption that all observations are in control, with the log likelihood of the observations if a step change has occurred. Sullivan and Woodall (1996) proposed a changepoint method for exploratory data analysis and showed that this method outperforms the Shewhart chart in detecting sustained shifts. We include their changepoint method in our analysis. Consider the set S0 = (1, 2, . . . , k), which we can split into sets S1 = (1, 2, . . . , ⌧ ) and S2 = (⌧ + 1, ⌧ + 2, . . . , k), with 1 ⌧ k 1. Denoting the number of elements in set Sj by sj , we have s0 = k, s1 = ⌧ , and s2 = k ⌧ . The maximum-likelihood estimators of the mean and variance of the observations in samples t 2 Sj are given by µ ej =
and
ej2 =
n 1 XX Xit n ⇤ sj i=1 t2Sj
n 1 XX (Xit n ⇤ sj i=1 t2Sj
µ ej )2
for j = 0, 1, 2.
To test for the existence of a step change after sample ⌧ , we compute the likelihood-ratio statistic as LRT(⌧ ) = nk ln[b02 ] n⌧ ln[b12 ] n(k ⌧ ) ln[b22 ] (see Sullivan and Woodall (1996)). Sullivan and Woodall (1996) constructed a chart by plotting the LRT(⌧ ) statistic against ⌧ , with an
Journal of Quality Technology
out-of-control signal occurring if a value exceeds the UCL. However, if ⌧ is close to 1 or k 1, the expected value of LRT(⌧ ) is larger than for an intermediate ⌧ . We standardize LRT(⌧ ) by its expected value E(LRT(⌧ )). The standardized test statistic is denoted by LRT0 (⌧ ) and is compared with a constant upper control limit UCLCP . The expected values E(LRT(⌧ )) are determined through 100,000 simulations, as is also done in Sullivan and Woodall (1996), and are presented in the appendix. A sustained shift in the Phase I data set is detected if LRT0 (⌧ ) exceeds UCLCP . Every out-ofcontrol signal indicates a probable sustained shift in the process. When multiple signals are given, we set the estimated changepoint (ˆ ⌧ ) equal to the ⌧ for which LRT0 (⌧ ) is maximal. If there is no outof-control signal, we set ⌧ˆ = k. To determine UCLCP , we set the overall in-control false alarm probability equal to 0.01. Using 100,000 simulations, we find that UCLCP = 5.75 for k = 50 and for both n = 5 and n = 10. When the changepoint ⌧b is estimated, we can determine which samples are out of control. In practice, knowledge of the process would be used to determine whether the data before or after the estimated ⌧b are in control. In order to prevent the deletion of a large proportion of clean observations from the Phase I dataset (this problem could occur in our simulation if there is a false alarm at the beginning of the Phase I dataset), we use the following decision rule: ‘the majority of the samples represent the in-control process’. This implies that, if ⌧b k/2, we delete samples 1 up to ⌧b from Phase I. If ⌧b > k/2, we delete samples ⌧b+1 up to k from Phase I. The remaining samples are used to compute the grand sample mean, yielding an estimate of µ based on changepoint analysis, which we denote by CP . We believe this is an appropriate decision rule, as practitioners can investigate which sequence before or after the shift is acceptable. Moreover, it ensures a more suitable comparison with the other Phase I methods considered in our study. This changepoint method is designed to detect a single changepoint ⌧b and is at a disadvantage if multiple step changes occur in Phase I. Alternative changepoint methods can be designed based on recursive testing for step changes. 2.3. SPC-Based Estimation Methods Shewhart control charts are known for their detection of scattered outliers but not for their e↵ectiveness when Phase I contains sustained shifts. Other
Vol. 46, No. 4, October 2014
A ROBUST ESTIMATOR FOR LOCATION IN PHASE I BASED ON AN EWMA CHART
305
methods should then be selected, such as changepoint methods (see Sullivan and Woodall (1996)) and EWMA charts (see Hunter (1986)). In this section, we consider the use of the EWMA chart in Phase I.
present. Our study evaluates the impact of the most efficient estimator for the location, the grand sample average (X), and a robust estimator based on the median of the sample means (M (X)).
The proposed Phase I EWMA screening estimators consist of the following steps. First, initial estimates of the location and standard deviation, µ bI and bI , are obtained. The choice of these estimators is discussed below. Next, a Phase I EWMA chart is set up with EWMA statistic Zt = (1 I )Zt 1 + I X t and control limits r bI I 2t d d UCLt /LCLt = µ bI ± LI p [1 (1 I ) ], n 2 I
We use just one method to derive ˆI so that any di↵erences in performance are due to di↵erences in the estimation of µ. We use an estimator of that is known for its robustness, namely, a variant of the biweight A estimator proposed by Tatum (1997). This estimator weights residuals; residuals are computed as the di↵erence between the observations and the sample medians. Large residuals are given less weight than smaller residuals, which ensures that outliers have less impact on the estimate of . The estimation procedure is described by Tatum (1997) and is implemented as set out in Schoonhoven et al. (2011b), with normalizing constants 1.068 for n = 5 and 0.962 for n = 10.
bI . Note that the subscript ‘I’ denotes that with Z0 = µ the parameter is associated with Phase I charting. If d t or below LCL d t , the correspondZt falls above UCL ing sample is identified as unacceptable and deleted from Phase I. Then we can use an efficient estimator of µ, yielding an estimate that is efficient as well as robust to various patterns of outliers. The final location estimate is given by the mean of the remaining sample means, Sµ b
I
As far as the choice of I is concerned, we take a range of values in order to study the impact of this parameter. Small values for I enable detection of sustained shifts, while larger values of I enable detection of scattered outliers. To assess this tradeo↵, we set I equal to 0.2, 0.6, and 1. When I = 1, we obtain the Shewhart chart. To obtain values for LI , we set the false-alarm rate at 1%, thereby following Chakraborti et al. (2009).
k 1 X d t < Zt < UCL d t ). = ⇤ X t ⇥ I(LCL k t=1
Here, I(.) is the indicator function, k⇤ denotes the number of remaining samples, and S indicates that the estimator is based on Phase I charting.
Table 1 gives an overview of the Phase I estimators considered and the corresponding values of LI (obtained through 100,000 Monte Carlo simulations).
The choice of µ bI is an important one: an efficient estimator could improve the performance of the Phase I chart under stability but inflate the Phase I control limits when disturbances are present. On the other hand, a robust estimator could result in nonoptimal performance under stability, but in robust Phase I control limits when disturbances are
3. Phase I Study In this section, we evaluate the e↵ectiveness of Phase I studies that use the methods presented in Table 1. One of the requirements of Phase I is to de-
TABLE 1. Phase I Location Estimators
LI Estimator
Description
X M (X) CP
The grand sample average Median of the sample averages Changepoint estimator
SX 0.6 SM (X)0.2 SM (X)0.6 SM (X)1
Phase Phase Phase Phase
Vol. 46, No. 4, October 2014
I I I I
screening screening screening screening
estimator estimator estimator estimator
with with with with
µ bI µ bI µ bI µ bI
= X and I = 0.6 = M (X) and I = 0.2 = M (X) and I = 0.6 = M (X) and I = 1
n=5
n = 10
n.a. n.a. n.a.
n.a. n.a. n.a.
2.540 2.540 2.610 2.617
2.525 2.525 2.592 2.600
www.asq.org
306
INEZ M. ZWETSLOOT, MARIT SCHOONHOVEN, AND RONALD J. M. M. DOES
liver accurate parameter estimates. We assess the estimation precision of the proposed methods in terms of the mean squared error (MSE). In addition, the Phase I analysis is used as a tool for exploratory data analysis, allowing us to examine the data and learn from out-of-control observations. Section 3.1 describes the data scenarios considered in Phase I, and Sections 3.2 and 3.3 present the Phase I results in terms of the MSE and the percentage of identified out-of-control observations, respectively. 3.1. Data Scenarios Recall that the stable, in-control, Phase I data are assumed to be N (µ, 2 ) distributed. One of the requirements of Phase I is to deliver an accurate parameter estimate of µ, even if Phase I contains contaminated observations. In our paper, we assume that contaminated observations come from a shifted normal distribution N (µ + I , 2 ), with I a constant. The Shewhart control chart is particularly useful to detect single, relatively large disturbances in the data or scattered special causes. These disturbances are transient in that they a↵ect single samples. But, in some situations, disturbances might be sustained in that they last for at least a few consecutive samples beyond their first appearance. This is where EWMA charts play a role. In the study, we consider both scattered and sustained special causes. The scenarios are described below, where we set the parameters for the stable state at µ = 0 and = 1, without loss of generality. 1. A model for localized shifts in which all observations in a sample have a 90% probability of being drawn from the N (0, 1) distribution and a 10% probability of being drawn from the N ( I , 1) distribution. 2. A model for di↵use shifts in which each observation, irrespective of the sample to which it belongs, has a 90% probability of being drawn from the N (0, 1) distribution and a 10% probability of being drawn from the N ( I , 1) distribution. 3. A model for a single step shift in which the first 45 samples are drawn from the N (0, 1) distribution and the last 5 samples are drawn from the N ( I , 1) distribution. 4. A model for multiple step shifts in which, at each time point, the sample has a probability p of being the first of five consecutive samples drawn from the N ( I , 1) distribution. After any such step shift, each sample again has a probability p of being the start of another step shift.
Journal of Quality Technology
Phase I consists of 50 samples. If sample 48 shifts, then only 3 samples (48, 49, and 50) are drawn from the N ( I , 1) distribution, instead of five. To maintain the 10% expected contamination rate of models 1–3, we set p = 0.023. The performance of the proposed estimators is evaluated for scenarios where I = 0, 0.2, 0.4, . . . , 2. 3.2. Estimation Accuracy In order to determine the accuracy of the proposed location estimators, we determine the MSE for each estimation method under the scenarios proposed in the previous subsection. The MSE is calculated as R
1 X MSE = R r=1
✓
µ ˆr
µ
◆2
R
1 X r 2 = (b µ ) , R r=1
(1)
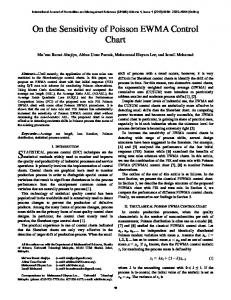
where µ ˆr is the value of an estimator in the rth simulation run and R is the total number of simulations in the Monte Carlo study. We set R = 200, 000 with a relative simulation error—the standard error of the estimated MSEs expressed as a percentage of the MSE—which never exceeds 0.5%. The MSE results are presented in Figures 1 through 4. The y-intercept shows the MSE of the estimation methods when the data are stable ( I = 0). The estimator X shows the lowest MSE, as expected. The other estimators show only slightly larger MSE levels, except for M (X), which is less efficient under stability. Next, we study the situation when contaminations are present in Phase I ( I > 0). We see that the traditional point estimator X is most sensitive to all data disturbances considered. The estimator M (X) as well as the screening estimators are rather robust in the scenarios where the mean of an entire sample has shifted, namely localized, single and multiple step shifts (see Figures 1, 3, and 4), but not when diffuse disturbances are present (see Figure 2). The reason is that these estimators trim the sample means rather than extreme observations within a sample. The estimator CP has the lowest MSE when there are single step shifts (Figure 3), but its performance in other situations is far worse than that of the alternative estimators. As regards the choice of I for the screening methods, we had expected that the Phase I Shewhart chart, SM (X)1 , would perform best for localized disturbances as the Shewhart chart is well known for its detection of single (extreme) disturbances. However,
Vol. 46, No. 4, October 2014
A ROBUST ESTIMATOR FOR LOCATION IN PHASE I BASED ON AN EWMA CHART
307
FIGURE 1. MSE of Location Estimators when Localized Shifts Are Present in Phase I for k = 50 Samples of Size n. (a) n = 5; (b) n = 10.
from Figure 1, we can see that the Phase I Shewhart chart is only slightly superior to the Phase I EWMA chart with I = 0.6 (SM (X)0.6 ). Moreover, SM (X)0.6 performs better when there are single or multiple step shifts. Note that an EWMA chart with a lower I , for example SM (X)0.2 , does not perform as well for short and large sample disturbances: a lower value of I is more suitable for smaller sustained shifts. Because the disturbances in applications can be scattered as well as sustained, we recommend in Phase I the use of an EWMA chart with
I = 0.6 or a similar intermediate value, rather than a Shewhart chart.
As for the choice of µ bI , i.e., whether we use SM (X)0.6 or SX 0.6 , it is worth noting that the method based on the robust estimator M (X) for the Phase I chart is as efficient under stable data ( I = 0) as the chart based on X. This becomes clear when we realize that both charts use the efficient estimator X to determine the mean after screening. We can conclude that it does not matter for efficiency of
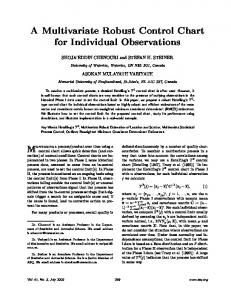
FIGURE 2. MSE of Location Estimators when Di↵use Shifts Are Present in Phase I for k = 50 Samples of Size n. (a) n = 5; (b) n = 10.
Vol. 46, No. 4, October 2014
www.asq.org
308
INEZ M. ZWETSLOOT, MARIT SCHOONHOVEN, AND RONALD J. M. M. DOES
FIGURE 3. MSE of Location Estimators when a Single Step Shift Is Present in Phase I for k = 50 Samples of Size n. (a) n = 5; (b) n = 10.
the final estimate whether a less efficient estimator is used to construct the Phase I chart. The use of a robust estimator like M (X) for the Phase I chart does pay o↵, however: when there are large multiple step shifts (Figure 4 for I > 0.8), we see that the performance of the Phase I chart based on X is not good. The higher the value of I , the higher will be the MSE. When a nonrobust estimator is used for the Phase I chart, disturbances might a↵ect the Phase I limits so that the wrong observations are filtered out of the data. As the type of disturbance in Phase I
is not known in advance, we recommend the use of a Phase I chart based on a robust estimator such as SM (X)0.6 rather than a Phase I chart based on an efficient estimator such as SX 0.6 . Finally, note that none of the proposed estimation methods perform well when there are di↵use disturbances, i.e., contaminated observations scattered over the entire Phase I data set. Because the estimators screen whole samples, they do not identify these individual scattered outliers and therefore use all ob-
FIGURE 4. MSE of Location Estimators when Di↵use Shifts Are Present in Phase I for k = 50 Samples of Size n. (a) n = 5; (b) n = 10.
Journal of Quality Technology
Vol. 46, No. 4, October 2014
A ROBUST ESTIMATOR FOR LOCATION IN PHASE I BASED ON AN EWMA CHART
309
TABLE 2. Maximum Relative Mean-Squared Error (RMSE) and, in Bold, the Estimator with the Lowest Maximum RMSE
Phase I estimators for µ Scenario
n
X
M (X)
CP
SX 0.6
SM (X)0.2
SM (X)0.6
SM (X)1
Localized
5 10
835.8 1908.5
116.7 141.3
935.6 2125.5
73.2 72.3
93.5 92.7
13.9 13.7
8.9 8.9
Di↵use
5 10
6.4 3.4
52.6 53.5
11.2 11.5
7.0 7.0
6.5 6.8
8.4 8.6
8.8 9.0
Single step
5 10
887.1 1787.7
139.9 139.7
13.9 15.3
44.2 69.7
61.1 60.5
35.6 36.1
81.5 79.3
Multiple step
5 10
1071.4 2153.6
173.5 188.8
1247.0 2458.4
136.6 289.8
58.6 59.8
8.4 8.7
50.9 49.9
2153.6
188.8
2458.4
289.8
93.5
36.1
81.5
All scenarios combined
servations to estimate the location. This means that the estimators are based on a mixture of in-control and out-of-control observations and will be approximately equal to 0.1 I , yielding a MSE level approximately equal to 0.1 I2 , as can be observed in Figure 2. We think that the proposed estimators can be augmented with a method that screens for individual outliers and see this as an issue for future research. To compare the performance of the proposed estimators across the various contamination schemes, we compute the relative mean squared error (RMSE) of the estimators. The RMSE of an estimator, for a specific type of data contamination and severity I , is defined as the percentage increase in the MSE of the estimator relative to the MSE of the estimator with the lowest MSE. For each data scenario and each estimator, we obtain the RSME of the estimator for all levels of I . We present the maximum RSME over I for each estimator in Table 2. The table shows that, in the presence of localized disturbances, the estimator SM (X)1 has the lowest maximum RMSE (i.e., has an MSE that overall is closest to the optimal MSE for all shift sizes). When there is a single step shift, the changepoint estimator has the lowest RMSE: its MSE is at most 15.3% larger than the optimal estimator for all I . If we consider all disturbance scenarios together (last row in Table 2), we find that the estimator SM (X)0.6 is always within 36.1% of the optimal estimators’ MSE, irrespective of the pattern of contaminations.
Vol. 46, No. 4, October 2014
3.3. Phase I Detection Probability In practice, the Phase I analysis is also used as a tool for exploratory data analysis. One would like to ‘learn from the data’. If such an analysis is to be e↵ective, it must identify unacceptable observations without triggering false alarms for acceptable observations. In this section, we measure the e↵ectiveness of the Phase I study in terms of the truealarm percentage (TAP) and the false-alarm percentage (FAP). Related measures are presented by Fraker et al. (2008), Chakraborti et al. (2009), and Fris´en (2009). The TAP and FAP are calculated as R
TAP = and
(#correct signals)r 1 X ⇥100% R r=1 (#unacceptable observations)r (2) R
(#false alarms)r 1 X ⇥ 100%, FAP = R r=1 (#acceptable observations)r (3) where r denotes the rth simulation run. Note that the analysis could only be carried out for the proposed estimation methods that have a screening procedure to identify unacceptable samples in Phase I. These are CP , S(X)0.6 , SM (X)0.2 , SM (X)0.6 , and SM (X)1 . The results are presented in Table 3. Some interesting findings on the TAP and FAP are the following:
www.asq.org
310
INEZ M. ZWETSLOOT, MARIT SCHOONHOVEN, AND RONALD J. M. M. DOES TABLE 3. True-Alarm Percentage (TAP) and False-Alarm Percentage (FAP)
TAP Scenario
n
µ ˆ
0.4
1
Localized
5
CP
1.4
SX 0.6 SM (X)0.2 SM (X)0.6 SM (X)1 10
Di↵use
5
10
Single step
5
1.6
2
0
0.4
1
4.1
11.2
17.0
1.1
1.3
3.3 2.3 3.4 3.8
23.0 15.7 26.2 29.8
61.1 46.7 71.1 77.7
82.2 67.4 90.9 94.8
1.0 1.0 1.0 1.0
CP
1.8
9.0
21.3
26.9
SX 0.6 SM (X)0.2 SM (X)0.6 SM (X)1
6.5 4.0 6.7 7.6
49.6 36.8 58.3 64.9
91.2 78.5 97.0 98.7
CP
1.1
1.2
SX 0.6 SM (X)0.2 SM (X)0.6 SM (X)1
1.1 1.0 1.1 1.1
CP SX 0.6 SM (X)0.2 SM (X)0.6 SM (X)1 CP SX 0.6 SM (X)0.2 SM (X)0.6 SM (X)1
10
Multiple step
5
I
FAP I
1.6
2
2.6
6.7
11.1
1.1 1.2 1.1 1.0
1.5 2.3 1.3 1.1
2.3 5.9 1.8 1.1
3.2 9.7 2.4 1.1
1.1
1.5
4.9
13.1
18.4
98.6 93.0 99.9 100.0
1.0 1.0 1.0 1.0
1.2 1.4 1.1 1.1
2.0 4.6 1.6 1.1
4.0 12.6 3.1 1.1
6.1 18.7 4.7 1.1
1.4
1.9
1.1
1.1
1.2
1.4
1.9
1.4 1.2 1.4 1.5
2.2 1.7 2.2 2.5
2.9 2.2 3.1 3.4
1.0 1.0 1.0 1.0
1.0 1.0 1.0 1.0
1.0 1.0 1.0 1.0
1.0 1.0 1.0 0.9
1.0 1.1 1.0 1.0
1.1
1.2
1.5
1.9
1.1
1.1
1.2
1.5
1.9
1.1 1.0 1.0 1.0
1.3 1.1 1.3 1.3
1.7 1.4 1.7 1.8
2.2 1.8 2.3 2.4
1.0 1.0 1.0 1.0
1.0 1.0 1.0 1.0
1.0 1.0 1.0 1.0
1.1 1.1 1.1 1.0
1.2 1.2 1.2 1.1
15.1
90.7
99.3
99.8
1.0
1.7
1.3
0.2
0.1
6.9 7.9 6.8 3.9
53.7 54.7 55.6 30.7
89.4 80.0 91.9 78.8
96.1 87.1 97.8 95.2
1.0 1.0 1.0 1.0
1.1 1.2 1.1 1.0
1.5 1.5 1.2 1.1
2.2 1.6 1.2 1.1
3.0 1.6 1.2 1.1
CP
36.1
98.7
99.9
100.0
1.0
2.1
0.3
0.0
0.0
SX 0.6 SM (X)0.2 SM (X)0.6 SM (X)1
15.5 18.3 15.5 7.9
83.5 75.3 86.2 66.1
98.3 90.6 99.3 98.9
99.8 96.1 100.0 100.0
1.0 1.0 1.0 1.0
1.2 1.3 1.1 1.0
2.0 1.6 1.2 1.1
3.7 1.6 1.2 1.1
5.5 1.6 1.2 1.1
CP
4.1
28.6
48.3
53.1
1.2
1.9
7.0
13.9
16.2
SX 0.6 SM (X)0.2 SM (X)0.6 SM (X)1
5.6 6.8 5.6 3.4
43.9 50.1 47.9 26.1
81.9 78.7 88.7 73.3
91.4 86.6 96.5 92.9
1.0 1.0 1.0 1.0
1.1 1.4 1.1 1.0
1.8 4.3 1.4 1.2
3.3 7.9 1.8 1.2
5.0 9.7 2.1 1.2
(continued on next page)
Journal of Quality Technology
Vol. 46, No. 4, October 2014
A ROBUST ESTIMATOR FOR LOCATION IN PHASE I BASED ON AN EWMA CHART
311
TABLE 3. Continued
TAP Scenario
n
µ ˆ
0.4
1
10
CP
8.8 12.2 15.6 12.5 6.6
SX 0.6 SM (X)0.2 SM (X)0.6 SM (X)1
I
1.6
2
0
0.4
1
43.8
54.5
55.7
1.1
2.7
74.2 73.1 81.3 59.8
94.6 90.1 98.6 97.8
97.9 95.3 99.8 99.8
1.0 1.0 1.0 1.0
1.2 1.9 1.2 1.1
• When there are localized disturbances, SM(X)1 shows the best performance because it has the highest TAP and lowest FAP values. Note that SM (X)0.6 , which is based on a robust initial estimator, detects more unacceptable observations than SX 0.6 . This is because the robust Phase I chart limits are not biased by any contaminations. • The proposed estimation methods detect very few di↵use disturbances. This is not surprising given that they lack an e↵ective way of identifying outliers within samples. The methods should be augmented by an individuals chart or similar procedure. This is an issue for future research. • When there is a single step shift, the CP method performs best, followed by the Phase I EWMA charts. The Shewhart chart performs poorly in this situation, which is to be expected as this chart is especially designed to detect individual, scattered disturbances. • When there are multiple step shifts, the CP method, which we use, runs into trouble as it is designed to detect a single shift. A solution for this could be the use of a CP method that recursively identifies multiply changepoints. The Phase I chart based on a nonrobust estimator, SX 0.6 , deletes too many in-control observations. The EWMA chart with I = 0.6 performs best.
4. Phase II Performance Phase I estimators are used to design Phase II control charts. In this section, we evaluate EWMA control charts in Phase II that are based on estimated parameters when the Phase I data may or may not be contaminated.
Vol. 46, No. 4, October 2014
FAP I
1.6
2
11.5
16.1
16.4
2.7 7.0 1.6 1.2
6.4 10.6 2.5 1.2
10.0 12.3 3.1 1.2
Recall that the Phase II observations, Yit with i = 1, 2, . . . , n and t = 1, 2, . . . , are independently and identically N (µ, 2 ) distributed if the process is in control. We model out-of-control Phase II data as N (µ + II , 2 ), where II is a constant and the index ‘II’ indicates Phase II data. 4.1. Design of the Phase II EWMA Control Chart The Phase II EWMA control chart consists of the EWMA statistic Zt = (1
II )Zt 1
b, and control limits with Z0 = µ r b d d p b ± LII UCLt /LCLt = µ n 2
+
II Y t ,
II
[1 II
(1
2t II ) ],
where µ b and b are the Phase I estimates of µ and . We consider seven EWMA Phase II control charts, each based on one of the location estimators (b µ) presented in Section 2. For a fair comparison of the proposed location estimation methods, the standard deviation for each control chart is determined by a robust estimator described in Tatum (1997) (see Section 2.3). Furthermore, II is set equal to 0.13, which Crowder (1989) recommended as an optimal smoothing constant to detect a shift size of II = 1. Note that II di↵ers from the I used in Phase I, as Phase I is used for exploratory data-analysis purposes. We take the values for LII from Jones (2002): LII = 2.89 for n = 5 and LII = 2.92 for n = 10. These values are determined such that the EWMA control chart has an average run length of approximately 370 when the process is in control.
www.asq.org
312
INEZ M. ZWETSLOOT, MARIT SCHOONHOVEN, AND RONALD J. M. M. DOES
4.2. Performance Measures and Simulation Procedure The Phase II performance of a control chart can be expressed in terms of the probability distribution of the run length (RL), which is a stochastic variable indicating the number of samples before Zt falls outside the control limits, i.e., a signal that the process may be out of control. A common measure of control chart performance is the expected value of the RL, i.e., the average run length (ARL). It is desirable to have a high ARL when the process is stable and a low ARL when the process mean has shifted to µ + II with II 6= 0. Jones et al. (2001) gave a very insightful account of the performance of the control chart with estimated limits. In this case, a distinction is made between the conditional and unconditional run length distribution. The conditional distribution is the distribution of RL given the Phase I parameter estimates µ b and b. In order to evaluate the overall behavior of the EWMA control charts, we consider the unconditional run length distribution, which averages over the variability of the parameter estimates µ b and b.
In order to evaluate the e↵ect on the Phase II EWMA control chart of contaminated Phase I data and the estimation methods, we estimate the average ARL of the unconditional run-length distribution by means of simulation. In order to obtain these values, we use the following simulation procedure: first, k = 50 samples of size n = 5, 10 are drawn from the same Phase I disturbance scenarios used to assess the b and b are calculated from MSE, with I = 1. Then µ the data and the control limits are computed. Observations from N ( II , 1) are drawn until the associated Zt falls outside the control limits. The corresponding run length equals t. The calculations are made for II = 0, 0.1, 0.2, 0.3, 0.4. The entire procedure is repeated for R = 200, 000 simulation runs. The ARL is computed by averaging over all 200, 000 RLs and the results are presented in Table 4. 4.3. Phase II Results
First, consider the situation where the Phase I data are stable (first part of Table 4). We see that, for acceptable data, Phase II control chart performance is similar across all estimators (i.e., they have similar in-control and out-of-control ARLs), except for the control chart based on the robust point estimator M (X), which falls short. This confirms that it is unadvisable to use a robust point estimator: if there
Journal of Quality Technology
are no special causes in Phase I, useful information is lost, resulting in a less powerful control chart. It is better to use a Phase I procedure that only trims Phase I observations that are considered unacceptable. When no data anomalies are found, the number of falsely deleted samples is limited. When there are localized disturbances, the best Phase II performance is achieved by the screening estimators (SX 0.6 , SM (X)0.2 , SM (X)0.6 , and SM (X)1 ), and the control chart based on the robust point estimator M (X). The EWMA control chart based on X is less e↵ective as this traditional estimator is influenced by outliers, which then also affect the resulting Phase II limits. The EWMA control chart based on CP does not work very well: this estimator deletes too many samples on the assumption that the disturbances will endure. Unfortunately, for n = 5, all EWMA control charts are ARL biased. Furthermore, none of the Phase II control charts performs well when there are di↵use disturbances because these charts are typically designed to detect sample shifts instead of individual outliers. In the presence of a single step shift, CP performs best followed by the Phase I EWMA charts, (SX 0.6 ,SM (X)0.2 , and SM (X)0.6 ). Note that the Phase I Shewhart chart (SM (X)1 ) is outperformed by the EWMA and CP methods because the Shewhart chart has no memory and does not make use of the time sequence of the observations. Finally, in the case of multiple step shifts, the CP method does not work well at all: the resulting control chart has a relatively low ARL for the acceptable situation and high ARL when the process is out of control, which is not desirable. This is as expected because the CP method is designed for single step shifts. In the multiple step shift scenario, the Phase I EWMA charts (SX 0.6 , SM (X)0.2 , and SM (X)0.6 ) perform best. To summarize, the type of disturbance and estimation method used in Phase I strongly determine the performance of the Phase II EWMA control chart. We recommend the Shewhart chart in Phase I for scattered observations, the changepoint method whenever single step changes are likely, and the EWMA chart with I set at around 0.6 when there are multiple step changes or when there is uncertainty about the type, the length, or the magnitude of the disturbance.
Vol. 46, No. 4, October 2014
A ROBUST ESTIMATOR FOR LOCATION IN PHASE I BASED ON AN EWMA CHART
313
TABLE 4. Average ARL for the EWMA Control Chart in Phase II Based on Alternative Location Estimators for k = 50 Samples of Size n = 5, 10
Average ARL of the unconditional run-length distribution Phase I Scenario
n
In control
5
10
Localized ( I = 1)
5
10
Di↵use ( I = 1)
5
µ b
In-control II = 0
Out-of-control Phase II Data II
= 0.1
II
= 0.2
II
= 0.3
II
= 0.4
X M (X) CP
374 333 370
210 214 210
61 73 63
22 25 23
12 12 12
SX 0.6 SM (X)0.2 SM (X)0.6 SM (X)1
370 369 367 365
212 210 211 212
62 62 63 63
23 23 23 23
12 12 12 12
X M (X) CP
371 333 367
129 143 132
26 30 27
11 11 11
6 6 6
SX 0.6 SM (X)0.2 SM (X)0.6 SM (X)1
367 366 362 363
131 132 132 132
27 26 26 27
11 11 11 11
6 6 6 6
X M (X) CP
215 273 217
338 294 325
213 153 207
72 52 75
25 20 27
SX 0.6 SM (X)0.2 SM (X)0.6 SM (X)1
260 252 271 279
319 324 311 308
169 177 158 152
55 58 51 48
21 21 19 19
X M (X) CP
152 270 167
313 244 286
149 66 139
33 17 40
12 8 13
SX 0.6 SM (X)0.2 SM (X)0.6 SM (X)1
264 251 294 308
252 263 220 211
71 76 54 49
18 19 15 14
8 8 7 7
X M (X) CP
287 297 288
517 458 510
296 296 297
82 97 84
26 30 28
SX 0.6 SM (X)0.2 SM (X)0.6 SM (X)1
291 289 292 293
506 509 507 505
296 295 294 294
83 83 84 82
27 27 27 27
(continued on next page)
Vol. 46, No. 4, October 2014
www.asq.org
314
INEZ M. ZWETSLOOT, MARIT SCHOONHOVEN, AND RONALD J. M. M. DOES TABLE 4. Continued
Average ARL of the unconditional run-length distribution Phase I Scenario
n 10
Single step ( I = 1)
5
10
Multiple steps ( I = 1)
5
10
µ b
In-control II = 0
Out-of-control Phase II Data II
= 0.1
II
= 0.2
II
= 0.3
II
= 0.4
X M (X) CP
173 198 177
511 454 504
178 196 180
31 37 32
12 12 12
SX 0.6 SM (X)0.2 SM (X)0.6 SM (X)1
180 177 178 180
504 502 501 501
180 181 180 180
32 32 32 32
12 12 12 12
X M (X) CP
210 278 349
371 302 209
210 148 69
61 48 25
22 18 13
SX 0.6 SM (X)0.2 SM (X)0.6 SM (X)1
312 306 317 282
298 302 284 321
119 125 112 145
37 39 35 44
16 16 15 18
X M (X) CP
130 276 361
370 249 132
130 60 26
26 16 11
11 8 6
SX 0.6 SM (X)0.2 SM (X)0.6 SM (X)1
326 316 338 313
200 215 175 211
39 44 35 44
13 14 12 14
7 7 7 7
X M (X) CP
220 257 247
266 264 230
193 156 143
97 67 77
39 28 43
SX 0.6 SM (X)0.2 SM (X)0.6 SM (X)1
287 295 297 268
264 262 257 269
137 129 127 154
57 52 51 66
24 22 22 27
X M (X) CP
180 254 242
222 222 159
145 82 80
62 25 48
21 10 32
SX 0.6 SM (X)0.2 SM (X)0.6 SM (X)1
299 305 324 293
197 196 175 201
60 56 44 62
21 18 15 20
9 9 7 9
Journal of Quality Technology
Vol. 46, No. 4, October 2014
A ROBUST ESTIMATOR FOR LOCATION IN PHASE I BASED ON AN EWMA CHART
5. Conclusion We have considered several Phase I estimation methods for situations where scattered as well as sustained shifts might be present. We have studied the e↵ectiveness of a Phase I exploratory data analysis stage in terms of the accuracy of the resulting estimates and the proportion of successfully identified unacceptable samples. Moreover, we have investigated the impact of data contaminations and the estimators used in Phase I on the performance of the Phase II EWMA control chart. Our study shows that data anomalies can have a huge impact on the quality of the Phase I analysis as well as on the power of the resulting Phase II EWMA control chart. There is considerable di↵erence in the performance of the Phase I estimation methods. We have the following recommendations: First, we recommend the use of a changepoint or SPC-based method instead of a single point estimator to arrive at a parameter estimate for the Phase II limits. Such methods make it possible to perform a Phase I data analysis and ‘learn from the data’ before any monitoring takes place. A learning stage will improve the quality of the Phase II monitoring. Second, we have seen that most methods work well in one specific situation: when there might be scattered contaminations, the Shewhart chart works best but, when there are sustained shifts, the use of an EWMA chart or changepoint method is more ap-
315
propriate. These methods take into account the time sequence in the samples. When multiple step changes are likely or the type of disturbance is unknown, we recommend the Phase I EWMA chart. The smoothing constant of the EWMA chart, I , should ideally be set at around 0.6. A low value overemphasizes the detection of small shifts while a high value approaches the performance of the Phase I Shewhart chart. The methods based on EWMA charts not only work well in the multiple step scenario but also in the other contamination scenarios. These estimators provide near-best estimates of the location in the presence of any pattern of Phase I contaminations. Finally, we recommend the use of a two-step procedure, namely a robust estimator to estimate the location and construct the Phase I control chart, and an efficient estimator for post-screening estimation. The use of a robust estimator for the Phase I chart ensures that Phase I limits are not too sensitive to any disturbances, limiting the incorrect deletion of clean data, while the use of an efficient estimator subsequent to screening ensures that final estimates are efficient under stability as well.
Acknowledgments The authors are very grateful to the Editor, a member of the Editorial Review Board, and two Referees for their detailed comments and suggestions. It has improved the final paper substantially.
Appendix TABLE 5. E(LRT(⌧ )), the Normalizing Constants for LRT
n
n
n
n
⌧
5
10
⌧
5
10
⌧
5
10
⌧
5
10
1 2 3 4 5 6 7 8 9 10 11 12 13
2.21 2.14 2.10 2.08 2.07 2.06 2.05 2.04 2.04 2.03 2.03 2.03
2.11 2.06 2.05 2.04 2.04 2.04 2.03 2.03 2.02 2.02 2.02 2.02
14 15 16 17 18 19 20 21 22 23 24 25 26
2.03 2.03 2.03 2.03 2.03 2.03 2.03 2.03 2.02 2.02 2.02 2.02 2.02
2.02 2.02 2.02 2.02 2.02 2.02 2.02 2.02 2.02 2.02 2.02 2.02 2.02
27 28 29 30 31 32 33 34 35 36 37 38 39
2.02 2.03 2.03 2.03 2.03 2.03 2.03 2.03 2.03 2.03 2.03 2.03 2.03
2.02 2.02 2.02 2.02 2.02 2.02 2.02 2.02 2.02 2.02 2.02 2.02 2.02
40 41 42 43 44 45 46 47 48 49 50
2.04 2.04 2.05 2.06 2.07 2.08 2.10 2.14 2.21
2.02 2.03 2.03 2.04 2.04 2.04 2.05 2.06 2.10
Vol. 46, No. 4, October 2014
www.asq.org
316
INEZ M. ZWETSLOOT, MARIT SCHOONHOVEN, AND RONALD J. M. M. DOES
References
Weighted Moving Average Control Schemes: Properties and Enhancements”. Technometrics 32(1), pp. 1–12. Nazir, H. Z.; Riaz, M.; Does, R. J. M. M.; and Abbas, N. (2013). “Robust CUSUM Control Charting”. Quality Engineering 25(3), pp. 311–224. Page, E. S. (1954). “Continuous Inspection Schemes”. Biometrika 41(1-2), pp. 100–115. Quesenberry, C. P. (1993). “The E↵ect of Sample Size on Estimated Limits for X and X Control Charts”. Journal of Quality Technology 25(4), pp. 237–247. Roberts, S. W. (1959). “Control Chart Tests Based on Geometric Moving Averages”. Technometrics 1(3) pp. 239–250. Rocke, D. M. (1989). “Robust Control Charts”. Technometrics 31(2), pp. 173–184. Saleh, N. A.; Mahmoud, A. M.; Keefe, M. J.; and Woodall, W. H. (2014). “The Difficulty in Designing Shewhart X and X Control Charts with Estimated Parameters”. Journal of Quality Technology, to appear. Schoonhoven, M.; Nazir, H. Z.; Riaz, M.; and Does, R. J. M. M. (2011a). “Robust Location Estimators for the X Control Chart”. Journal of Quality Technology 43(4), pp. 363–379. Schoonhoven, M.; Riaz, M.; and Does, R. J. M. M. (2011b). “Design and Analysis of Control Charts for Standard Deviation with Estimated Parameters”. Journal of Quality Technology 43(4), pp. 307–333. Shewhart, W. A. (1926). “Quality Control Charts”. Bell System Technical Journal, 5(4), pp. 593–603. Shewhart, W. A. (1931). Economic Control of Quality of Manufactured Product. New York, NY: Van Nostrand Company. Sullivan, J. H. and Woodall, W. H. (1996). “A Control Chart for Preliminary Analysis of Individual Observations”. Journal of Quality Technology 28(3), pp. 265–278. Tatum, L. G. (1997). “Robust Estimation of the Process Standard Deviation for Control Charts”. Technometrics 39(2), pp. 127–141. Vining, G. (2009). “Technical Advice: Phase I and Phase II Control Charts”. Quality Engineering 21(4), pp. 478–479. Western Electric Company. (1956). Statistical Quality Control Handbook. Easton, PA: Western Electric Co.
Amiri, A. and Allahyari, A. (2012). “Change Point Estimation Methods for Control Chart Postsignal Diagnostics: A Literature Overview”. Quality and Reliability Engineering International 28(7), pp. 673–685. Chakraborti, S.; Human, S. W.; and Graham, M. A. (2009). “Phase I Statistical Process Control Charts: An Overview and Some Results”. Quality Engineering 21(1), pp. 52–62. Crowder, S. V. (1989). “Design of Exponentially Weighted Moving Average Schemes”. Journal of Quality Technology 21(3), pp. 155–155. Fraker, S. E.; Woodall, W. H.; and Mousavi, S. (2008). “Performance Metrics for Surveillance Schemes”. Quality Engineering 20(4), pp. 451–464. ´n, M. (2009). “Optimal Sequential Surveillance for Frise Finance, Public Health, and Other Areas (with Discussion)”. Sequential Analysis: Design Methods and Applications 28(3), pp. 310–337. Hunter, J. S. (1986). “The Exponentially Weighted Moving Average”. Journal of Quality Technology 18(4), pp. 203–210. Janacek, G. J. and Meikle, S. E. (1997). “Control Charts Based on Medians”. The Statistician 46(1), pp. 19–31. Jensen, W. A.; Jones-Farmer, L. A.; Champ, C. W.; and Woodall, W. H. (2006). “E↵ects of Parameter Estimation on Control Chart Properties: a Literature Review”. Journal of Quality Technology 38(4), pp. 349–364. Jones, L. A. (2002). “The Statistical Design of EWMA Control Charts with Estimated Parameters”. Journal of Quality Technology 34(3), pp. 277–288. Jones, L. A.; Champ, C. W.; and Rigdon, S. E. (2001). “The Performance of Exponentially Weighted Moving Average Charts with Estimated Parameters”. Technometrics 43(2), pp. 156–167. Jones-Farmer, L. A.; Woodall, W. H.; Steiner, S. H.; and Champ, C. W. (2014). “An Overview of Phase I Analysis for Process Improvement and Monitoring”. Journal of Quality Technology 46(3), pp. 265–280. Lucas, J. M. and Saccucci, M. S. (1990). “Exponentially
s
Journal of Quality Technology
Vol. 46, No. 4, October 2014