To address these problems, a new self-adaptive dynamic tolling algorithm is ...... traveled increased by 98%, while road mileage increased by less than 7% ...
Final Technical Report TNW2009-09 Research Project Agreement No: 60-6021
A Self-Adaptive Toll Rate Algorithm for High Occupancy Toll (HOT) Lane Operations by Yinhai Wang Associate Professor
Guohui Zhang Research Associate
Department of Civil and Environmental Engineering University of Washington Seattle, Washington 98195-2700 A Report prepared for: Transportation Northwest (TransNow) University of Washington 129 More Hall, Box 352700 Seattle, Washington 98195-2700 and Washington State Department of Transportation (WSDOT) 310 Maple Park Avenue SE PO Box 47300 Olympia, WA 98504-7300 and in cooperation with U.S. Department of Transportation Federal Highway Administration December 2009
Page 1
A Self-Adaptive Toll Rate Algorithm for High Occupancy Toll (HOT) Lane Operations
1. REPORT NO.
2. GOVERNMENT ACCESSION NO.
3. RECIPIENT’S CATALOG NO.
TNW2009-09 4. TITLE AND SUBTITLE
5. REPORT DATE
A Self-Adaptive Toll Rate Algorithm for High Occupancy Toll (HOT) Lane Operations
December 2009
7. AUTHOR(S)
8. PERFORMING ORGANIZATION REPORT NO.
Yinhai Wang and Guohui Zhang
6. PERFORMING ORGANIZATION CODE
TNW2009-09
9. PERFORMING ORGANIZATION NAME AND ADDRESS
10. WORK UNIT NO.
Transportation Northwest Regional Center X (TransNow) Box 352700, 123 More Hall University of Washington Seattle, WA 98195-2700
11. CONTRACT GRANT NO.
12. SPONSORING AGENCY NAME AND ADDRESS
13. TYPE OF REPORT AND PERIOD COVERED
DTRT07-G-0010 Final Report
United States Department of Transportation Office of the Secretary of Transportation 1200 New Jersey Ave, SE Washington, D.C. 20590
14. SPONSORING AGENCY CODE
15. SUPPLEMENTARY NOTES
This study was conducted in cooperation with the University of Washington and the US Department of Transportation 16. ABSTRACT
Dramatically increasing travel demands and insufficient traffic facility supplies have resulted in severe traffic congestion. High Occupancy Toll (HOT) lane operations have been proposed as one of the most applicable and cost-effective countermeasures against freeway congestion. By allowing Single Occupancy Vehicles (SOVs) to use High Occupancy Vehicle (HOV) lanes with a toll, excess capacities of HOV lanes can be utilized. Through balancing pricing and vehicle occupancy constraints, an HOT lane system can optimize traffic allocations between HOT and General Purpose (GP) lanes and hence enhance the overall infrastructure efficiency if a proper tolling strategy is employed. Although there exist several tolling strategies, two major problems with these tolling strategies may significantly degrade the HOT lane system performance. First, the under-sensitive tolling algorithm is incapable of handling the hysteresis properties of traffic systems and may cause severe response delays. Secondly, unfavorable flow fluctuation on both HOT and GP lanes may result from over-sensitive tolling strategies and generate agitating traffic operations. To address these problems, a new self-adaptive dynamic tolling algorithm is developed in this study to optimize HOT lane operations. To reduce the computational complexity, a second-order control scheme is exploited in this algorithm. Based on traffic speed conditions and toll changing patterns, the optimum flow ratio for HOT lane utilization is calculated using feedback control theory. Then the appropriate toll rate is estimated backward using the discrete route choice model. To examine the effectiveness of the proposed tolling algorithm, simulation experiments were conducted. A microscopic traffic simulation software tool, VISSIM, is utilized. The proposed algorithm is implemented and integrated with the VISSIM package through an external module specifically developed for this study. Data from the Washington State Route (SR) 167 HOT lane system is used to build and calibrate the simulation model. The simulation experiment results show that the proposed tolling algorithm is capable of responding to traffic changes promptly and effectively. It performed reasonably well in optimizing overall traffic operations of the HOT lane system under various traffic conditions. This algorithm is logically straightforward and not difficult to implement. 17. KEY WORDS
18. DISTRIBUTION STATEMENT
Congestion pricing, High Occupancy Toll (HOT), dynamic tolling, feedback-based control 19. SECURITY CLASSIF. (OF THIS REPORT)
None
20. SECURITY CLASSIF. (OF THIS PAGE)
None
21. NO. OF PAGES
22. PRICE
A Self-Adaptive Toll Rate Algorithm for High Occupancy Toll (HOT) Lane Operations
Page 2
DISCLAIMER The contents of this report reflect the views of the authors, who are responsible for the facts and accuracy of the data presented herein. This document is disseminated through the Transportation Northwest (TransNow) Regional Center under the sponsorship of the U.S. Department of Transportation UTC Grant Program and through the Washington State Department of Transportation. The U.S. Government assumes no liability for the contents or use thereof. Sponsorship for the local match portion of this research project was provided by the Washington State Department of Transportation. The contents do not necessarily reflect the views or policies of the U.S. Department of Transportation or Washington State Department of Transportation. This report does not constitute a standard, specification, or regulation.
A Self-Adaptive Toll Rate Algorithm for High Occupancy Toll (HOT) Lane Operations
Page 3
TABLE OF CONTENTS DISCLAIMER ................................................................................................................................ 2 TABLE OF CONTENTS................................................................................................................ 3 LIST OF FIGURES ........................................................................................................................ 5 LIST OF TABLES .......................................................................................................................... 8 EXECUTIVE SUMMARY ............................................................................................................ 9 CHAPTER 1 INTRODUCTION .................................................................................................. 11 1.1 Research Background ......................................................................................................... 11 1.2 Problem Statement .............................................................................................................. 13 1.3 Research Objective ............................................................................................................. 15 1.4 Report Organization ............................................................................................................ 15 CHAPTER 2 STATE OF THE ART ............................................................................................ 17 CHAPTER 3 RESEARCH METHODOLOGY ........................................................................... 20 3.1 Algorithm Scheme .............................................................................................................. 20 3.2 Modeling HOT Lane Utilization......................................................................................... 21 3.3 Feedback Control Mechanism ............................................................................................ 23 3.4 Toll Rate Estimation ........................................................................................................... 25 3.5 Tolling Algorithm Development Summary ........................................................................ 27 CHAPTER 4 SIMULATION MODEL DEVELOPMENT AND EXPERIMENTAL DESIGN. 29 4.1 VISSIM traffic simulator .................................................................................................... 29 4.2 External tolling control module development .................................................................... 31 4.3 Simulation model configuration and calibration ................................................................ 35 4.3.1 SR-167 HOT lane systems ........................................................................................... 36
A Self-Adaptive Toll Rate Algorithm for High Occupancy Toll (HOT) Lane Operations
Page 4
4.3.2 Modeling scope and data source .................................................................................. 36 4.3.3 Simulation of HOV lane operations ............................................................................. 40 4.3.4 Simulation model calibration ....................................................................................... 42 4.3.5 Simulation of HOT lane operations ............................................................................. 54 4.4 Simulation Experimental Design ........................................................................................ 56 4.5 Simulation Model Development Summary ........................................................................ 58 CHAPTER 5 SIMULATION TESTS AND ANALYSES ........................................................... 59 5.1 Simulation tests under current traffic demands .................................................................. 59 5.2 Simulation tests under various traffic demands .................................................................. 66 5.3 Tolling impacts on HOV travelers ...................................................................................... 71 5.4 Simulation test result summary........................................................................................... 74 CHAPTER 6 CONCLUSIONS AND RECOMMENDATIONS ................................................. 75 6.1 Conclusions ......................................................................................................................... 75 6.2 Recommendations ............................................................................................................... 76 ACKNOWLEDGMENTS ............................................................................................................ 78 REFERENCES ............................................................................................................................. 79
A Self-Adaptive Toll Rate Algorithm for High Occupancy Toll (HOT) Lane Operations
Page 5
LIST OF FIGURES Figure 1-1 Comparisons of speed response on HOT lanes for different tolling algorithms ......... 14 Figure 3-1 A schematic flow chart of the typical HOT lane operation ........................................ 21 Figure 4-1 System architecture of the HOT lane simulation model ............................................. 33 Figure 4-2 A geographic map for the arterial of SR-167 .............................................................. 38 Figure 4-3 A sketching overview of HOT lane simulation network ............................................ 39 Figure 4-4 Schematic flow chart of the calibration procedure ..................................................... 43 Figure 4-5 Diagrammatic locations of checkpoints on SR-167 and I-405 interchange bridge .... 45 Figure 4-6 Traffic volume comparisons between reference data and simulation outputs at the location of SR-167 & 15th St. NW ..............................................................................46 Figure 4-7 Traffic speed comparisons between reference data and simulation outputs at the location of SR-167 & & 15th St. NW ..........................................................................46 Figure 4-8 Traffic volume comparisons between reference data and simulation outputs at the location of SR-167 & 277th St.....................................................................................47 Figure 4-9 Traffic speed comparisons between reference data and simulation outputs at the location of SR-167 & 277th St.....................................................................................47 Figure 4-10 Traffic volume comparisons between reference data and simulation outputs at the location of SR-167 & SR 516/Kent-Des Moines Rd. ..................................................48 Figure 4-11 Traffic speed comparisons between reference data and simulation outputs at the location of SR-167 & SR 516/Kent-Des Moines Rd. ..................................................48
A Self-Adaptive Toll Rate Algorithm for High Occupancy Toll (HOT) Lane Operations
Page 6
Figure 4-12 Traffic volume comparisons between reference data and simulation outputs at the location of SR-167 & S. 212th St. ...............................................................................49 Figure 4-13 Traffic speed comparisons between reference data and simulation outputs at the location of SR-167 & S. 212th St. ...............................................................................49 Figure 4-14 Traffic volume comparisons between reference data and simulation outputs at the location of SR-167 & SW 43rd St. ..............................................................................50 Figure 4-15 Traffic speed comparisons between reference data and simulation outputs at the location of SR-167 & SW 43rd St. ..............................................................................50 Figure 4-16 Traffic volume comparisons between reference data and simulation outputs at the location of milepost at 1.5 miles SB I-405 ..................................................................51 Figure 4-17 Traffic speed comparisons between reference data and simulation outputs at the location of milepost at 1.5 miles SB I-405 ..................................................................51 Figure 4-18 Traffic volume comparisons between reference data and simulation outputs at the location of milepost at 2.5 miles NB I-405 ..................................................................52 Figure 4-19 Traffic speed comparisons between reference data and simulation outputs at the location of milepost at 2.5 miles NB I-405 ..................................................................52 Figure 4-20: Two bottlenecks resulted from the enhanced capacities of upstream HOT lane sections ........................................................................................................................ 57 Figure 4-21: A diagrammatic sketch of the proposed improvements with the existing infrastructure ............................................................................................................... 57
A Self-Adaptive Toll Rate Algorithm for High Occupancy Toll (HOT) Lane Operations
Page 7
Figure 5-1 Traffic speed comparisons between the GP and HOV lanes for Lane Segment 1 under HOV lane operations with the current demand............................................................69 Figure 5-2 Traffic speed comparisons between the GP and HOT lanes for Lane Segment 1 under HOT lane operations with the current demand ............................................................69 Figure 5-3 Traffic speed comparisons between the GP and HOV lanes for Lane Segment 1 under HOV lane operations with 140% of the current demand .............................................70 Figure 5-4 Traffic speed comparisons between the GP and HOT lanes for Lane Segment 1 under HOT lane operations with 140% of the current demand .............................................70 Figure 5-5 Toll rate changing pattern for Lane Segment 1 under HOT lane operations with 140% of the current demand ................................................................................................711
A Self-Adaptive Toll Rate Algorithm for High Occupancy Toll (HOT) Lane Operations
Page 8
LIST OF TABLES Table 4-1 Descriptive Statistics for Both Simulation Outputs and Their Corresponding Annual Average Values ........................................................................................................... 53 Table 5-1 Integrated Simulation Results for Operation Scenario 1 from 12 Simulation Runs .... 62 Table 5-2 Integrated Simulation Results for Operation Scenarios 2 and 3 from 12 Simulation Runs ............................................................................................................................ 63 Table 5-3 Integrated Simulation Results under Existing Traffic Demands from Seven Simulation Runs ............................................................................................................................ 65 Table 5-4 Integrated Simulation Results for HOT Lane Segment 2 under Various Traffic Demands from Seven Simulation Runs ...................................................................... 66 Table 5-5 Integrated Simulation Results for HOV Operation Evaluation from 10 Simulation Runs ............................................................................................................................ 73
A Self-Adaptive Toll Rate Algorithm for High Occupancy Toll (HOT) Lane Operations
Page 9
EXECUTIVE SUMMARY Over the past decades, dramatically increasing travel demands and insufficient traffic facility supplies have resulted in severe traffic congestion problems, which cost billions of dollars every year due to lost time, wasted energy, excess air pollution, and lost productivity. Because constructing new transportation infrastructure becomes more difficult in metropolitan areas, it is of utmost importance to manage the existing transportation facilities more efficiently with advanced traffic control and management technologies in addition to travel demand control. High Occupancy Toll (HOT) lane operations have been proposed as one of the most applicable and cost-effective countermeasures against freeway congestion. By allowing Single Occupancy Vehicles (SOVs) to use High Occupancy Vehicle (HOV) lanes with a toll, excess capacities of HOV lanes can be utilized. Consequently, through balancing pricing and vehicle occupancy constraints, HOT lane operations can optimize traffic allocations between HOT and General Purpose (GP) lanes and hence enhance the overall infrastructure efficiency. Tolling is a key component that distinguishes HOT from HOV operations. An appropriate tolling mechanism is crucial for the success of HOT lane operations because traffic allocation between HOT and GP lanes ties directly to toll rate. Although there exist several tolling strategies, they are likely under-sensitive or over-sensitive due to the lack of feedback mechanism. On the one hand, an under-sensitive tolling algorithm is incapable of handling the hysteresis properties of traffic systems and may cause severe response delays. On the other hand, unfavorable flow fluctuations on both HOT and GP lanes may be caused by an over-sensitive tolling strategies and result in agitating traffic operations. To address these problems, a new self-adaptive dynamic tolling algorithm is developed in this study to optimize HOT lane operations. To reduce the computational complexity, a second-order control scheme is used in this algorithm. Based on traffic speed conditions and toll changing patterns, the optimum flow ratio for HOT lane utilization is calculated using feedback
Page 10
A Self-Adaptive Toll Rate Algorithm for High Occupancy Toll (HOT) Lane Operations
control theory. Then the appropriate toll rate is estimated backward using the discrete route choice model. By dynamically adjusting toll rate based on traffic conditions, traffic allocations between GP and HOT lanes can be controlled and the overall system efficiency can be maximized. To examine the effectiveness of the proposed tolling algorithm, simulation experiments were conducted. A microscopic traffic simulation software tool, VISSIM, is utilized.
The proposed algorithm is
implemented and integrated with the VISSIM package through an external module specifically developed for this study. The Component Object Model (COM) is used to overcome functional constraints with the VISSIM built-in modules. This HOT lane module also provides additional flexibility that can be used by researchers and/or practitioners to satisfy any specific demands. Data from the Washington State Route (SR) 167 HOT lane system is used to build and calibrate the simulation model. Five HOT lane sections on the northbound SR-167 are included in the simulation model. Various experimental test scenarios are designed to identify potential problems with existing traffic infrastructure and evaluate the overall system performance under different traffic demands. The simulation experiment results show that the proposed tolling algorithm is capable of responding to traffic changes promptly and effectively. It can avoid being under-sensitive or oversensitive due to its feedback-based self-adaptive nature. This algorithm is proven effective in dynamically optimizing overall traffic operations of the HOT lane system under various traffic conditions and has a great potential to be used to improve HOT lane performance. In addition to this self-adaptive dynamic tolling algorithm, the simulation platform used in this study may be used as a cost-effective evaluation tool for HOT lane operations. Due to the differences in geometric design, lane configuration, and driver composition, each HOT lane system may have its unique feature to be considered in the tolling mechanism. Therefore, the proposed algorithm needs to be tested using data from other HOT lane systems before being finalized for field implementations.
A Self-Adaptive Toll Rate Algorithm for High Occupancy Toll (HOT) Lane Operations
Page 11
CHAPTER 1 INTRODUCTION 1.1 Research Background Over the past decades, dramatically increasing travel demands and insufficient traffic facility supplies have resulted in severe traffic congestion. From 1980 to 2007, yearly vehicle miles traveled increased by 98%, while road mileage increased by less than 7% nationally (Bureau of Transportation Statistics 2009). The enlarging gap between travel demand and infrastructure supply has increased the level of congestion nationwide. Traffic congestion costs billions of dollars every year due to lost time, wasted energy, excess air pollution, and lost productivity. The 2009 Urban Mobility Report indicates the annual average delay per person in the 439 urban areas surveyed was 36 hours in 2007, a 162% increase compared to that in 1982. Congestion costs an average of $757 per traveler in the surveyed urban areas in 2007 (Schrank and Lomax 2009). The greater Seattle area has been consistently ranked as one of the most congested areas in the U.S. Traffic congestion resulted in a total of 73.64 million hours of travel delays and 50.54 million gallons of excess fuel consumption in Seattle in 2007, which corresponded to a congestion cost of 1.59 billion dollars, the 15th highest in the U.S. (Shrunk and Lomax 2009).
Adding more roadways has been a traditional solution to solving traffic congestion problems. Due to the high construction cost, long project cycle, and complicated procedure for new construction, however, the increase of roadway supply has lagged far behind the increase of demand over the past several decades. A commonly accepted solution to address the gap between roadway supply and travel demand is to manage the existing infrastructure more efficiently with advanced traffic control and management technologies, specially for locations where expanding highway capacity becomes very difficult or impossible. High-Occupancy
A Self-Adaptive Toll Rate Algorithm for High Occupancy Toll (HOT) Lane Operations
Page 12
Vehicle (HOV) lane has been a solution for several decades. The concept was originally proposed as dedicated bus lanes. Gradually, HOV lane allowed vanpools and carpools. The initial goal of HOV lane was to motivate people to shift from Single Occupancy Vehicles (SOV) to carpools or buses in order to reduce SOV trips and traffic congestion. It has been widely recognized that HOV lanes can carry more people than General Purpose (GP) lanes during peak hours. Kim (2002) conducted a study using micro-simulation models and found HOV lanes improved HOV user travel time significantly.
On the other hand, research on the usage of HOV lane conducted by Dahlgren (1998) indicated that under some circumstances, HOV lanes are less effective in reducing traffic delay. Kwon and Varaiya (2005) found that HOV lanes increased congestion in the Bay area by underutilizing the HOV lane capacity by about 20% or 400 vph. Many HOV facilities are underutilized when other GP lanes are congested. A partial explanation may be that about 43% of carpoolers are members of the same household and exploitation of HOV lanes is restricted to some extent (Fielding and Klein 1993). Under such a condition, converting HOV lanes to High Occupancy Toll (HOT) lanes creates a win-win solution to reduce traffic delays and enhance total traffic throughputs. SOVs are allowed to pay a toll for using HOV lanes to better utilize the excess capacities of HOV lanes. Currently, there are about 1285.3 miles of HOV lanes in the US (Chu, Nesamani, and Hamed, 2007). Successful operations of HOT lanes by fully exploiting their excess capacities can potentially generate huge time savings and significantly mitigate traffic congestion. Therefore, the HOT lane concept has been increasingly recognized and accepted as a potential measure to improve traffic mobility.
A Self-Adaptive Toll Rate Algorithm for High Occupancy Toll (HOT) Lane Operations
Page 13
1.2 Problem Statement
HOT lane operation has been accepted as one of the most effective countermeasures against freeway congestion. Under a HOT lane system, SOVs are allowed to access HOV lanes by paying a toll when excess capacities of HOV lanes are available. By balancing pricing and vehicle occupancy constraints, HOT lane systems can optimize traffic allocation between HOT and GP lanes and enhance the overall infrastructure efficiency. HOT lane operation is still in its early stage and few existing studies focused on developing tolling strategies. Inferior tolling strategies for HOT lanes can severely degrade system performance by lengthening vehicle delay, increasing accident risk, and introducing disruptions to traffic progression.
Due to theoretical deficiency in modeling toll schemes, most existing tolling strategies are not clearly set for optimal HOT lane operations. Two major problems associated with these inferior tolling strategies degrade HOT lane system performance. First, an under-sensitive tolling algorithm is incapable of handling the hysteresis properties of traffic systems and may cause severe response delays. Second, operation-agitating flow fluctuations on HOT and GP lanes may result from an over-sensitive tolling algorithm. To visualize the weakness of these tolling algorithms, an illustrative example is shown in Figure 1-1. This example shows three tolling strategies employed to improve HOT lane traffic speed from 35 MPH to 45 MPH. Response processes associated with these tolling strategies are illustrated. The underdamped tolling strategy may generate unfavorable flow fluctuation because of over-sensitive reaction, although it can quickly respond to traffic condition changes. The under-sensitive tolling strategy may control traffic stably, but at the cost of severe response delays due to overdamped characteristics.
Page 14
A Self-Adaptive Toll Rate Algorithm for High Occupancy Toll (HOT) Lane Operations
In such tolling systems, hysteresis properties of traffic systems cannot be sufficiently handled and will severely degrade overall system performance.
Step Response Illustratative Example
51 49
Amplitude
47 Speed (MPH) 45 43 41 Tolling Algorithm with Over-Sensitive Response Tolling Algorithm with Under-Sensitive Response Tolling Algorithm with Critically Damped Response
39 37 35 0
3
6
9
12 15 Time (sec) Time (Minute)
18
21
24
27
Figure 1-1 Comparisons of speed response on HOT lanes for different tolling algorithms
This study thus proposes a new self-adaptive tolling algorithm to dynamically optimize HOT lane operations based on feedback control theory. The operational goal is to enable the tolling algorithm to adaptively accommodate traffic variations in a fast and stable way as illustrated by the critically damped curve in Figure 1-1. Note that in this study, the HOT lane operation optimization is characterized by two operational criteria: 1) preserving high-quality travel conditions on HOT lanes; and 2) maximizing the total throughputs. Through dynamic toll adjustment, traffic allocation can be regulated to fully utilize the extra capacity of an HOT lane without degrading its operational conditions.
A Self-Adaptive Toll Rate Algorithm for High Occupancy Toll (HOT) Lane Operations
Page 15
1.3 Research Objective The objectives of this study include: To explore the feasibility of applying control theories for optimal HOT operations; To develop a self-adaptive tolling algorithm based on the feedback control theory for real-time toll rate calculations using real-time traffic sensor measurements, such as lane occupancy, speed, and flow rate; and To develop an independent simulation module to enable the VISSIM package to simulate the HOT lane system and analyze simulation results for performance evaluation. 1.4 Report Organization The remainder of this report structured as follows. Chapter 2 reviews previous work related to HOT system operations and pricing strategies. Chapter 3 presents the optimal feedback-based tolling algorithm development. A second-order control scheme is exploited to reduce the computational complexity. The optimal toll rate is backward estimated based on feedback control. Details of VISSIM-based simulation model development and experiment design are discussed in Chapter 4. To realize HOT lane operation simulation, one external control module is developed and integrated with the VISSIM package. Also simulation model calibration efforts are described and emphasized in this chapter to enhance models’ credibility. Representative test scenarios are established and various Measures of Effectiveness (MOEs) are selected to quantify system performance. Then, simulation experiments are conducted in Chapter 5 to verify the effectiveness and practicality of the proposed tolling algorithms. Test results are analyzed and
A Self-Adaptive Toll Rate Algorithm for High Occupancy Toll (HOT) Lane Operations
Page 16
discussed. Finally, Chapter 6 provides conclusions of this research effort and recommendations for future research.
A Self-Adaptive Toll Rate Algorithm for High Occupancy Toll (HOT) Lane Operations
Page 17
CHAPTER 2 STATE OF THE ART The first HOT lane project was implemented on SR 91 in Orange County, California in 1995. After that, HOT lane systems have been implemented in California (I-15), Texas (I-10 and US290), Minnesota (I-394), Utah (I-15), Colorado (I-25), and Washington (SR-167). Other states, such as Virginia, are currently in the process of implementing HOT lanes (Tilahun and Levinson, 2008). Two representative HOT lane systems, including the I-394 MnPass lane system and the SR-167 HOT lane system, are presented as following:
1) The I-394 MnPass lane system has been in operation in Minnesota since 2005. Before implementing the MnPass lane system, the original HOV lane system consists of two different sections: one is the three-mile long, barrier-separated reversible section located to the west of downtown Minneapolis. The other is an eight-mile section of concurrent flow HOV lanes located to the west of the first section (Turnbull, 2008). The total length is about 11 miles. To implement the I-394 MnPass lanes, several actions were taken, including restriping the concurrent flow HOV lanes to change from unlimited to limited access, installing the electronic toll collection and enforcement systems, and so on. A simple pricing mechanism was employed based on the performance indictor, traffic density. The tolls are adjusted to accommodate traffic condition changes ensuring that the HOT lane flows in the range of about 50-55 MPH. The tolling update interval is specified as three minutes. The toll rate is set in the range of 25 cents to $8 based on the HOT lane traffic conditions (Zmud et al, 2007).
2) The SR-167 HOT lane system has been open to the public since May 2008. This freeway corridor connects south King and north Pierce counties to the Seattle/Bellevue metropolitan area.
A Self-Adaptive Toll Rate Algorithm for High Occupancy Toll (HOT) Lane Operations
Page 18
It contains one HOT lane and two GP lanes in each direction. The HOT lane and GP lanes are not separated by physical barriers. Instead, a double-white line is employed to separate them. Crossing this double-white line is illegal. This HOT lane system contains nine miles of southbound and 12 miles of northbound HOT lanes. Vehicles are allowed to enter and exit the HOT lanes at access points. There are three several access points on the southbound HOT lane and five for the northbound HOT lane (WSDOT, 2007). The operation of this HOT lane system is based on a flexible pricing technology and the toll will be automatically adjusted to optimize the HOT lane volume and maintain its speed of 45 MPH or faster. The toll varies from $0.50 to $9.00 based on the level of services on HOT and GP lanes (WSDOT, 2007). This SR-167 HOT lane system has archived various sorts of data for performance measurement and cost-benefit analysis. These data are excellent resources for this project.
Although many studies have been conducted to evaluate the system performance of these projects (Appiah and Burris 2005, Halvorson et al. 2006, Yin and Lou 2007, Zmud et al. 2007, and Mowday 2006), few focused on the development of optimized tolling strategies. In practice, rough and empirical dynamic tolling strategies have been employed for HOT lane operations. For example, for the I-15 HOT lanes in San Diego, the basic price varies from $0.50 to $4.00 according to the time of day. The tolls may be manually adjusted in response to real-time traffic conditions. The maximum value of $8.00 is employed for heavily congested situations (Yin and Lou 2007). Although these tolling approaches approximately realize traffic response-based toll adjustment, due to insufficient theoretical basis, it is hard to quantitatively achieve the goal of optimal system performance.
A Self-Adaptive Toll Rate Algorithm for High Occupancy Toll (HOT) Lane Operations
Page 19
Review of previous literature did not find a systematic approach that is ready to apply for dynamically determining toll for HOT lane operations. Chu, Nesamani, and Benouar (2007) proposed a priority-based operation framework for HOV lane usages based on vehicle occupancy, type, and toll rate. But no further investigations were conducted on dynamic tolling strategies. Yin and Lou (2007) proposed two approaches for dynamic toll determination. The first one employs the control logic of the ramp metering control algorithm, ALINEA (Papageorgiou et al, 1997), for dynamically changing toll rates. This control logic is expressed as follows:
r (t 1) r (t ) K (o(t ) o * )
(2-1)
where, r(t) and r(t+1) are the toll rates at interval t and t+1, respectively; o(t) is the measured occupancy; K is the regulator parameter; o* is the desired occupancy of the HOT lane.
The other approach utilizes the discrete choice model, the Logit model, for tolling determination. Their major research efforts focused on parameter estimation and model calibration using real-time traffic counts collected from both HOT and GP lanes. Although there are certain similarities among ramp metering control, discrete choice models, and HOT lane tolling strategies, the unique characteristics of HOT lane operations cannot be sufficiently accommodated by simply transplanting other control or modeling methods. Hence, a more efficient tolling algorithm aims at optimizing the overall performance of a HOT lane facility is needed.
A Self-Adaptive Toll Rate Algorithm for High Occupancy Toll (HOT) Lane Operations
Page 20
CHAPTER 3 RESEARCH METHODOLOGY 3.1 Algorithm Scheme
Practical experience on HOT lane operations and in-depth investigations of existing tolling approaches provide valuable insights into intrinsic problems in tolling optimization. From a macroscopic perspective, the toll can function as an adjustment lever to direct the traffic inflow to the HOT lane. As shown in Figure 3-1, based on the traffic conditions on HOT and GP lanes, the tolling algorithm is executed and the toll is determined for the next interval. Then motorists make decisions on whether to use the HOT lane according to the toll and traffic situations in the network. Finally, the desired number of vehicles access the HOT lane and optimum system operation can be achieved.
However, due to the complicated nonlinear relationship between the toll rate and the traffic flow entering the HOT lane, a simple tolling algorithm may not offer the flexibility required to control traffic assignment. Although complex tolling algorithms are capable of adjusting traffic allocation competently, they are not easily implemented to meet practical needs. To address these problems, we propose an effective yet easy-to-implement tolling algorithm in this study. A second-order control scheme is exploited in this algorithm. First, using feedback control logic the ideal traffic flow ratio for optimal HOT lane utilization is calculated. Then, the optimal toll rate is estimated backward using the Logit model, one of the most widely recognized route choice models. By decomposing the calculation complexity, this new algorithm can satisfy the implementation and effectiveness requirements of the HOT lane system.
Page 21
A Self-Adaptive Toll Rate Algorithm for High Occupancy Toll (HOT) Lane Operations
Traffic Conditions on HOT and GP lanes
Dynamic Tolling Algorithm
Route Choice Decision Toll Rate Determination
Desired Traffic Inflow to HOT lanes
Optimum HOT Lane Operation
Figure 3-1 A schematic flow chart of the typical HOT lane operation 3.2 Modeling HOT Lane Utilization
In reality, motorists will make decisions on whether to pay for accessing the HOT lane based on the toll rate and traffic conditions on the HOT and GP lanes. Such a decision-making process can be formulated by the commonly used Logit model.
To quantify the attractiveness of different lanes, the total cost, TCi, for choosing lane type i is computed as
TCi * TTi TRi
(3-1)
where, TTi is the average travel time and TRi is the toll rate for lane type i; is the coefficient (value of time) to convert TTi into cash value. For the type of GP lane, the toll rate TRGP=0. The travel distance is excluded in this equation due to its static attributes. Then, utility function U for each lane choice is calculated as
A Self-Adaptive Toll Rate Algorithm for High Occupancy Toll (HOT) Lane Operations
U HOT U GP
1 1 TC HOT * TTHOT TRHOT
1 1 TCGP * TTGP
Page 22
(3-2)
where, UHOT is the utility function of the HOT lane and UGP is the utility function of the GP lane. Then the traffic assignment is modeled by the Logit model. The SOV flow, FHOT , entering the HOT lane can be obtained as
FHOT Ftotal * PHOT Ftotal *
exp(U HOT ) Ftotal * f (TR HOT , TTHOT , TTGP ) (3-3) exp(U HOT ) exp(U GP )
where, Ftotal is the total approaching SOV flow; PHOT is the probability of choosing the HOT lane for each individual vehicle; also, from a macroscopic perspective, PHOT denotes the flow ratio of the HOT lane volume to the total volume, termed as the flow ratio of HOT lane utilization. f( ) is an abstract function that associates the independent variables, TRHOT, TTHOT, and TTGP with dependent variable PHOT. Due to the one-to-one transformation between TRHOT and PHOT, the toll rate can be calculated inversely as follows,
TRHOT f 1 ( FHOT / Ftotal , TTHOT , TTGP ) f 1 ( PHOT , TTHOT , TTGP )
(3-4)
where, f--1( ) indicates the corresponding inverse function. In this equation, the variables, TTHOT, TTGP, and Ftotal are measurable from the traffic detectors typically deployed for an HOT lane system. Therefore, if FHOT is determined, the optimal toll rate TRHOT can be backward computed.
A Self-Adaptive Toll Rate Algorithm for High Occupancy Toll (HOT) Lane Operations
Page 23
In reality, the approaching traffic flow Ftotal can be approximately regarded to be consistent between two consecutive update intervals. So the calculation of FHOT can be simplified by computing PHOT. In the following sections, a feedback-based piecewise control algorithm is exploited to calculate PHOT, and then, after the related coefficients are calibrated, the toll rate can be estimated.
3.3 Feedback Control Mechanism
Feedback control is one simple yet effective control approach that has been widely applied in engineering and mathematic fields, such as automobile speed control, satellites, robots, and industrial processes (Lewis 1992). Enlightened by feedback control mechanisms applied in other fields, a feedback-based piecewise linear function is developed and utilized to calculate PHOT, the optimum flow ratio for HOT lane utilization.
In many HOT lane projects the HOT lane speed is employed as one of critical MOEs to indicate the system operation status. For instance, in the Washington SR 167 HOT lane pilot project, the HOT lane speed is required to be higher than 45 MPH (WSDOT 2007). Therefore, in this study, the speeds of HOT and GP lanes are employed as feedback variables and the operation criterion is to maintain the HOT lane speed higher than 45 MPH to ensure the HOVs’ travel reliability. The control principle of the algorithm is to divide the HOT lane operation status into three manipulation zones based on HOT lane speed, and then to develop the specific control strategy for each zone to achieve the optimal performance for the entire system. Let SHOT and SGP denote the average speeds of HOT and GP lanes, respectively. Three manipulation zones are partitioned according to their robustness: the first zone is SHOT > 50 MPH, which indicates
Page 24
A Self-Adaptive Toll Rate Algorithm for High Occupancy Toll (HOT) Lane Operations
sufficient HOT lane capacities are available, and the toll needs to be decreased if there is a need to carry more traffic; the second zone is 50 ≥SHOT > 45 MPH, which shows the traffic density on the HOT lane is close to its critical level, and the toll should be maintained at the same level; the third zone is SHOT ≤ 45 MPH, indicating the overflowing traffic has degraded the HOT lane performance and the toll must be increased to reduce the HOT lane volume.
Different feedback control mechanisms are adopted for these three zones. These control mechanisms can be formulated as:
b1 k1 (SHOT (t) SGP (t)) PHOT (t 1) PHOT (t) PHOT (t) PHOT (t) sign*[b2 k2 (SHOT (t) SGP (t))] k (S (t) 45) 3 HOT
SHOT (t) 50 50 SHOT (t) 45
(3-5)
SHOT (t) 45
where, PHOT(t+1) and PHOT(t) are the flow ratios for HOT lane usage at time interval t and t+1, respectively; PHOT (t ) is the feedback increment; b1, b2, k1, k2, and k3 are the parameters indicating control intensities of feedback quantities; SHOT (t) and SGP (t) are the average traffic speeds on HOT and GP lanes at time interval t, respectively; sign is a variable describing the changing pattern of PHOT , and is defined as:
1 sign 0 1
PHOT (t 1) PHOT (t ) PHOT (t 1) PHOT (t ) PHOT (t 1) PHOT (t )
(3-6)
A Self-Adaptive Toll Rate Algorithm for High Occupancy Toll (HOT) Lane Operations
Page 25
In Equation (3-5), when SHOT > 50 MPH, the speed difference between the HOT and GP lanes is employed as the feedback variable. The feedback increment, PHOT (t ) , is represented by a linear function, b1 k1 ( S HOT (t ) S GP (t )) . Such a feedback layout can effectively reflect traffic conditions on HOT and GP lanes and provide sufficient flexibilities to ameliorate feedback mechanism. When 50 ≥ SHOT > 45 MPH, besides an analogous feedback function, the indication variable, sign, is used to reflect the changing tendency of PHOT(t). Consequently, the feedback increment, PHOT (t ) , presents an alternative scheme to preserve HOT lane operation stability. When SHOT ≤ 45 MPH, PHOT(t) decreases directly by adding a negative item, k 3 ( S HOT (t ) 45) .
According to this feedback-based piecewise control algorithm, the optimum traffic flow ratio for HOT lane utilization can be calculated iteratively for each time interval. Then the appropriate toll rate can be backward estimated. The details of parameter calibration and toll estimation are presented in the next section.
3.4 Toll Rate Estimation
Real-time traffic speed can be measured by the detection system in both the HOT and GP lanes. Then the travel times are calculable for both types of lanes. Based on Equations (3-5) and (3-4), toll rate can be estimated after the related parameters are determined.
In Equation (3-5), five parameters, b1, b2, k1, k2, and k3, need to be determined. These parameters denote the weighting factors of feedback quantities and have to be calibrated separately according to different control strategies. For instance, when the HOT lane speed is
A Self-Adaptive Toll Rate Algorithm for High Occupancy Toll (HOT) Lane Operations
Page 26
higher than 50 MPH, then redundant capacity on the HOT lane is available. To optimize the overall traffic operation, traffic allocation needs to be adjusted rapidly. Based on the range of traffic speed and the efforts of trial and error, the parameters b1 and k1 are set as b1=0.075 and k1 = 0.005. Similarly, the other parameters can be calculated as b2=0.024, k2=0.0012, and k3 =0.03. The reasonableness of these values can be demonstrated by the following example:
S HOT S HOT S HOT S HOT
53;
SGP 48;
then
PHOT 0.075 0.005* (53 48) 10%
53;
SGP 28;
then
PHOT 0.075 0.005* (53 28) 20%
48;
SGP 35;
then
PHOT 0.024 0.0012* (48 35) 3.9%
then
PHOT 0.03* (40 45) 15%
40;
(3-7)
Assume S HOT 53 MPH and the traffic on the HOT lane operates in a robust status. Then the feedback increment, ∆PHOT, is updated at a larger changing pace, such as 10% to 20% depending on the GP lane speed; when S HOT 48 MPH, traffic speed of the HOT lane is close to the critical speed, 45 MPH, and thus should be maintained at a consistent level, and the flow ratio for HOT lane utilization changes slightly. For example, when S GP 35 MPH, ∆PHOT is only 3.9% (increase or decrease is associated with the variable, sign, in Equation (3-6)); when S HOT 40 MPH, the HOT lane speed is lower than the critical speed, so the flow ratio for HOT lane utilization needs to decrease sharply without considering the GP lane speed. Note that these values are not unique solutions for these parameters. Different sets of values may achieve analogous control results. Following the control principle proposed in this study, parameter calibration can be strengthened to meet the specific requirements of other applications.
Page 27
A Self-Adaptive Toll Rate Algorithm for High Occupancy Toll (HOT) Lane Operations
After PHOT is calculated for the next interval using Equation (3-5), the toll rate TRHOT can be estimated by the inverse function in Equation (3-4). Further calculation is conducted to embody this process. The toll rate TRHOT can be obtained as:
TR HOT f 1 ( PHOT , TTHOT , TTGP )
1 1 PHOT 1 ) ln( TTGP PHOT
TTHOT
(3-8)
where, the coefficient needs to be determined. In our study, the capital-to-travel time ratio of $11.70 per hour is applied to compute , e.g. = 11.70 dollar / hour = 0.325 cent / second. This ratio value was obtained from the traffic survey in the greater Seattle area. Actually, this coefficient indicates motorists’ willingness to pay for using HOT lanes and is closely associated with many particular factors, such as local economic conditions, traffic patterns, geographic characteristics, population distribution, and so on. Some studies were conducted to quantify the impact of these factors on HOT lane usage (Zmud and Peterson 2007, Li 2007, and Zmud et al. 2007). Findings show these factors are location-specific variables, and no uniform settings are applicable for manifold practical applications. More detailed discussions are beyond this study’s scope. When this tolling algorithm is used in other applications, the coefficient should be recalibrated to adapt to different situations. Based on Equations (3-5) and (3-8), it is straightforward to estimate the toll rate for next interval.
3.5 Tolling Algorithm Development Summary
Evolved from a HOV lane system, a HOT lane system is increasingly recognized and accepted as a viable measure to mitigate freeway congestion and improve travel time reliability. Optimized
A Self-Adaptive Toll Rate Algorithm for High Occupancy Toll (HOT) Lane Operations
Page 28
HOT lane management can yield significant economic returns and social benefits. However, it is difficult to quantitatively accomplish optimal HOT lane exploitation due to theoretical deficiency in their tolling schemes, although rough traffic-response-based tolling algorithms are applied to HOT lane operations based on practical experience. In this project, therefore, a new self-adaptive tolling algorithm will be developed to dynamically optimize HOT lane operations. A secondorder control scheme is exploited in this algorithm. Based on traffic speed conditions and toll changing patterns, the optimum flow ratio for HOT lane utilization is calculated based on feedback control theory. The proper toll rate, then, is backward estimated using the Logit model. By decomposing the calculation complexity, this optimal tolling algorithm can satisfy the practicality and effectiveness required by the HOT lane system operations in practice.
The effectiveness of the proposed tolling algorithms has been proven by the traffic simulation experiments using the model calibrated using the traffic sensor data collected from Seattle area freeways. Details of simulation model development and experimental tests are described in following chapters. The in-depth research and investigation conducted in this study can significantly improve our understanding of the control schemes for HOT lane system operations and provide a solid platform for optimizing HOT lane facility utilization.
A Self-Adaptive Toll Rate Algorithm for High Occupancy Toll (HOT) Lane Operations
Page 29
CHAPTER 4 SIMULATION MODEL DEVELOPMENT AND EXPERIMENTAL DESIGN To verify the effectiveness and applicability of the proposed algorithms for HOT lane system operations, simulation-based experiments are conducted. Due to its cost-effective and risk-free features, VISSIM is widely employed by transportation researchers for exploring optimal traffic control strategies, identifying potential problems, and evaluating various alternatives. In this study, a VISSIM-based simulation model is developed to simulate HOT lane system operations. Before presenting model configuration and external module development, the operating principle of VISSIM and its underlying driver behavior model are introduced. Then the details of simulation model configuration and calibration are described for freeway networks. To fully examine the effectiveness of the proposed tolling algorithm, various representative experimental test scenarios are designed. Finally a brief summary is provided to summarize this effort on simulation model development and experimental design.
4.1 VISSIM traffic simulator
VISSIM is a microscopic, time step and behavior-based simulation tool developed to model urban traffic and public transit operations. This software can simulate and analyze traffic operations under various scenarios. It is also very useful for evaluating various alternatives using the MOEs in transportation engineering and planning. In VISSIM, the traffic movement model is based on the work of R. Wiedemann (1974 and 1991), which combines a perceptual model of the driver with a vehicle model. The behavioral model for the driver involves a classification of reactions in response to the perceived relative speed and distance with respect to the preceding vehicle. Four driving modes are defined: free driving, approaching, following, and braking. In
A Self-Adaptive Toll Rate Algorithm for High Occupancy Toll (HOT) Lane Operations
Page 30
each mode a driver behaves differently, reacting either to its following distance, or trying to match a prescribed target speed. Details of each mode are described as follows:
Free driving: In this model, there are no impacts from the preceding vehicle on the following vehicle. Drivers seek to travel at a desired speed. Due to the randomness of simulation operations, the observed individual vehicle speed may oscillate around this desired value. Approaching: In this mode, the following driver adapts to the preceding vehicle’s lower speed. When the distance between two consecutive vehicles reaches the desired safety distance, the approaching vehicle applies a deceleration or acceleration so that the relative speed can maintain zero. Following: In this mode, the relative distance between two adjacent vehicles maintain a safety distance, and their relative speed fluctuates around zero. The following vehicle follows the preceding vehicle without continuously accelerating or decelerating Braking: In this model, the relative distance between vehicles falls below a safety distance, which can result from an abrupt deceleration of the preceding vehicle, or lane changing of another vehicle. A continuous deceleration is required. Also, drivers can decide to change lanes. This decision can be forced by a routing requirement, for example, when approaching an intersection, or made by the driver to access a faster-moving lane. In addition, traffic signals can be simulated, and are controlled in VISSIM by the Signal State Generator (SSG), which is a separate module from the traffic simulation module. Through the virtual signal controller, the user can access loop detector measurements and use
A Self-Adaptive Toll Rate Algorithm for High Occupancy Toll (HOT) Lane Operations
Page 31
such information to perform control strategies. Based on VISSIM, many modeling studies have been conducted. Gomes, May, and Horowitz (2004) developed and calibrated a VISSIM model for a congested freeway. Moen et al. (2000), Bloomberg and Dale (2000), and Tian et al. (2002) investigated the performance of VISSIM by comparing it to CORSIM, a popular traffic simulator developed by Federal Highway Administration (FHWA), and to which VISSIM compared favorably. More details can be found in (PTV 2007).
4.2 External tolling control module development
Although VISSIM is widely used for modeling freeway traffic operations based on its competent capabilities of simulating common transportation operations, because of functional constraints with its built-in modules, VISSIM cannot provide sufficient flexibility to enable the dynamic tolling strategies. Dynamic tolling strategies are required for most HOT lane systems in practical applications. For example, for the I-15 HOT lane system in San Diego, the basic price varies from $0.50 to $4.00 according to the time of day. The tolls may be adjusted in response to realtime traffic conditions. For the I-394 MnPass Express lane in Minnesota, a similar pricing mechanism is implemented. The tolls are adjusted upward or downward to ensure the HOT lane flow rates at about 50-55 MPH. Therefore, simulation models must be able to handle dynamic toll changes to fully investigate HOT lane system operations and examine alternative tolling strategies.
However, VISSIM cannot accept dynamically changeable tolls with its built-in modules. In VISSIM, a static toll rate can be set up as the financial cost for each roadway segment, but it is not dynamically changeable to reflect changing traffic conditions under the flexible tolling
A Self-Adaptive Toll Rate Algorithm for High Occupancy Toll (HOT) Lane Operations
Page 32
strategies required by HOT lane operations. Review of previous literature does not find any VISSIM-based simulation research for HOT lane operations. In the latest version, one extra module has been developed to support HOT lane operations in VISSIM. However, only limited control criteria, such as time savings and revenues, can be specified by users, considering the particular requirements of customized tolling algorithms, such as traffic information acquisition and toll determination, the standard VISSIM HOT lane module may not provide adequate flexibility to satisfy the unique demands for a specific researcher and practitioner. Therefore, an independent functional module of VISSIM enabling HOT lane simulations is desired.
In this project, an external HOT lane operation controller module was developed. This module uses standard VISSIM Component Object Model (COM) interfaces for general applications and supports complex tolling algorithms for dynamic toll rate determination on the basis of real-time traffic measurements. Also it can be easily incorporated in VISSIM simulation models to test HOT lane operations under various traffic scenarios and tolling strategies. Besides its standard built-in modules, VISSIM offers COM interfaces for executing COM commands from external programs (PTV 2007). Such customer-based COM applications provide extensive simulation capacities needed for satisfying various requirements from users. After the VISSIM COM server is registered in the computer operation system, communications between the external program and the VISSIM model are set up. The COM objects, such as individual vehicles, and roadway segments, can be utilized and controlled by external programs. Through a COM interface, an external program can access the VISSIM simulation model to retrieve traffic data and logic decisions. In this study, Microsoft Visual Basic is used as the computer language to implement the HOT lane operation module. The communications between this external
A Self-Adaptive Toll Rate Algorithm for High Occupancy Toll (HOT) Lane Operations
Page 33
module and the built-in modules of VISSIM are shown in Figure 4-1, the overall system architecture of the HOT lane simulation.
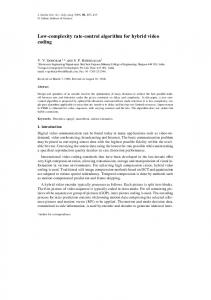
Figure 4-1 System architecture of the HOT lane simulation model
After the VISSIM simulation model is correctly configured, including accurate geographic characteristics of the HOT lane system, proper traffic demand matrices, and traffic compositions, etc., the model is executed in the single-step mode (default frequency: 1 step per second). When the traffic is allocated into the network by the dynamic assignment module, the flow rates, lane occupancies, and speeds are measured by loop detectors on both HOT and GP lanes. At each single step, these traffic detection data are exported and transferred to the external HOT lane module via the VISSIM COM server. To synchronize with toll updating intervals, these data are aggregated in a 5-minute interval in this study. Based on these measurements from
A Self-Adaptive Toll Rate Algorithm for High Occupancy Toll (HOT) Lane Operations
Page 34
the simulation model, the utilization of HOT and GP lanes are assessed. Then, the dynamic tolling algorithm is performed and the optimal toll rate is determined.
In reality, individual motorists will make decisions on whether to pay for accessing the HOT lane based on the real-time toll rate and traffic conditions on the HOT lane and GP lanes. In our simulation experiments, we employ a Logit model to imitate this decision-making process. To quantify the attractiveness of different lanes, the total cost (TC) for choosing lane type i is computed following Equation (3-1). Then, the utility function U for each lane choice is calculated using Equation (3-2). The desired proportion of vehicles that should enter the HOT lane can be estimated by Equations (3-3) and (3-4).
Via the COM interface, the roadway segment of a merging area can be instantiated, and each vehicle on this segment can be controlled by the external module. Then, a sequence of random numbers, { Nj }, uniformly distributed in the range of 0 to 1, is generated and used to simulate the probabilistic route decisions for each individual vehicle. The logic of decision for choosing the HOT lane is conducted as follows:
N j PHOT True N j PHOT False
(4-1)
where j denotes the jth vehicle; the decision True indicates when Nj is less than or equal to PHOT, vehicle j will choose the HOT lane, and vice versa. After assigning an individual vehicle to a
A Self-Adaptive Toll Rate Algorithm for High Occupancy Toll (HOT) Lane Operations
Page 35
HOT lane or a GP lane, this route decision is imported to the VISSIM model to replace its original route decision. Consequently, dynamic HOT lane utilization is realized.
By following the procedure above, the external HOT lane tolling controller module can be developed to implement the proposed tolling algorithm. Then the simulation model can be used to evaluate the performance of the HOT lane system after proper configuration and calibration. Details of the simulation model configuration and calibration are described in following sections.
4.3 Simulation model configuration and calibration
The simulation model is specifically developed for performance evaluation of the proposed tolling algorithm for HOT lane system operations. Freeway simulation model configuration and calibration requires significant efforts due to its complexity. The simulation test site chosen for this study is Washington SR 167. The simulation model is configured based on the SR-167 HOT lane system’s roadway geometric features, traffic demands, and operational patterns. Simulation model calibration is critical for ensuring realistic representations of simulated scenarios and achieving reliable simulation results. In this project, the simulation model is calibrated based on the observed ground-truth data. A standardized simulation calibration approach for freeway traffic operations is employed.
A Self-Adaptive Toll Rate Algorithm for High Occupancy Toll (HOT) Lane Operations
Page 36
4.3.1 SR-167 HOT lane systems SR-167 is a primary highway routes through south King County, the Seattle/Bellevue metropolitan area, and north Piece County. It is also an important alternative route to Interstate 5 for moving both people and goods in the Puget Sound Region. Currently, a four-year pilot project converts nine miles of HOV lanes to HOT lanes on SR-167 from Southwest 15th Street in Auburn to Interstate 405 in Renton (WSDOT 2007). There is one HOT lane and two GP lanes on each direction of the corridor. The HOT lanes opened in May 2008. The SR-167 HOT lanes provide toll-free, express trips for transit and carpools. SOVs are allowed to use HOT lanes if they pay the toll and their usage does not compromise speed and travel time reliabilities for HOVs. Tolls are collected electronically by the over-roadway detectors and vehicle-mounted sensors. This pilot project will use flexible pricing technology to maintain the optimum number of vehicles in the HOT lane. The toll price will automatically adjust up or down to optimize the HOT lane volume and maintain its speed at 45 MPH (72 KM/H) or faster.
4.3.2 Modeling scope and data source Simulation models must be built on the exact roadway geometry to realistically simulate traffic operations. In this SR-167 HOT lane system, the simulation model is configured to exactly represent the roadway geometric features, including the location of on-ramps and off-ramps, horizontal and vertical curves, weaving sections, the number of lanes and so on. Several major network editors, such as Link and Connector, are utilized to appropriately construct the traffic network in VISSIM. Three morning-peak hours, from 6:00 am to 9:00 am, are chosen as the simulation time period. This study concentrates on the HOT lane operations on Northbound SR167. The arterial map of SR-167 is illustrated in Figure 4-2, and a sketch map for the overall
A Self-Adaptive Toll Rate Algorithm for High Occupancy Toll (HOT) Lane Operations
Page 37
simulation network is shown in Figure 4-3. Following the design from the Urban Corridors Office at WSDOT, five HOT segments are implemented in the VISSIM model from SR-167 & 15th St. SW in Auburn to SR-167 & I-405 Interchange Bridge in Renton. The locations of the HOT lane segments are marked in Figure 4-3. Also two overall travel sections are indicated and will be used for performance measures later. Special care is taken to employ the HOV lanes along SR-167 and I-405 Bridge in the network. In this project, traffic composition is represented by the numbers of vehicles from the three categories: SOVs, HOVs, and trucks. Traffic composition for SR-167 is inputted to the simulation model in the format of three OriginDestination (OD) Matrices.
A Self-Adaptive Toll Rate Algorithm for High Occupancy Toll (HOT) Lane Operations
Figure 4-2 A geographic map for the arterial of SR-167
Page 38
A Self-Adaptive Toll Rate Algorithm for High Occupancy Toll (HOT) Lane Operations
Figure 4-3 A sketching overview of HOT lane simulation network
Page 39
A Self-Adaptive Toll Rate Algorithm for High Occupancy Toll (HOT) Lane Operations
Page 40
Before the simulation model is used for simulating the HOT lane operations, it is important to calibrate the simulation model so that it can reproduce the existing traffic conditions. For calibration purposes, ground-truth traffic data are needed. In this study, such reference data are collected from two major sources:
1) Traffic Management Center Summary Report: SR-167 Ramp and Roadway 2006 Traffic Volumes. This report provides major information about hourly volumes on the SR-167 arterial and on each ramp. These data are important for calibrating traffic demand inputs. 2) SR-167 and I-405 Annual Average Traffic Volumes and Speeds in 2005. This data source offers a favorable dataset of traffic volumes and speeds with a high resolution. Aggregated 5minute traffic counts and speeds are measured each half mile along SR-167. These data play significant roles in calibrating driving behavior parameters and network settings.
4.3.3 Simulation of HOV lane operations
Currently, one HOV lane and two GP lanes are in use along northbound SR-167 from Auburn to Renton in Washington State. The simulation model is originally configured to represent current HOV lane operations as the basic test scenario. In VISSIM, two alternatives of traffic assignment are executable: static assignment and dynamic assignment. In this study, dynamic traffic assignment is utilized to strengthen the practicality and validity of the simulation model.
A Self-Adaptive Toll Rate Algorithm for High Occupancy Toll (HOT) Lane Operations
Page 41
1) Dynamic Traffic Assignment
With its built-in dynamic assignment module, VISSIM can dynamically assign and equilibrate traffic in the network based on the demand of trips from origins to destinations. In VISSIM, a set of possible routes between two zones is established, and then travel costs (e.g., travel time and distance) for each route are calculated. Based on the assessment of optional routes, a discrete choice model is exploited to allocate traffic demands on all possible routes to model the route choice behavior of drivers. Such assignment processes are iterated dynamically until traffic assignment reaches the equilibrium status. This module greatly enhances the operational capabilities of simulation models.
With the dynamic traffic assignment module incorporated, the simulation model is capable of simulating present traffic operations appropriately. The entire network needs to be redefined by the components of nodes and edges along each route for dynamic assignment. An abstract network is recognized by the dynamic assignment module. In VISSIM the traffic equilibrium status is called convergence. The criteria for convergence can be specified by users. In this study, strict convergence conditions were set to ensure the balanced traffic assignment: the difference in travel times and volumes on each route should be less than 3% from one iteration to its next. Traffic dynamic assignment is closely associated with the configuration of the simulation model. After adjusting any parameters in the calibration process, traffic assignment needs to be updated until a new equilibrium status is achieved.
A Self-Adaptive Toll Rate Algorithm for High Occupancy Toll (HOT) Lane Operations
Page 42
2) HOV lane Implementation
One important feature of the network settings is the employment of HOV lanes. VISSIM provides the function to close a particular lane of a roadway segment to a certain type of vehicle. As introduced above, the traffic consists of vehicles from three categories in this study: SOVs, HOVs, and trucks. HOV-only restrictions are enforced by opening the specific lane to HOVs and closing it to SOVs and trucks. This HOV lane configuration is used to create the corresponding HOV lanes on the SR-167 arterial as well as the HOV bypass lanes on the on-ramps.
4.3.4 Simulation model calibration Calibration efforts are required to accomplish reasonable correspondence between observed field data and simulation outputs. During the model calibration process, related parameters are adjusted to make the outputs reasonably represent field conditions. The simulation model was calibrated for SR-167 HOV lane operations. The schematic flow chart of the proposed calibration procedure is illustrated in Figure 4-4. Based on the base-year traffic planning survey data, SOV, HOV, and truck OD matrices are established and inputted to the simulation model. Through multiple iterations of traffic assignment, these traffic demands are allocated to the whole network and the assignment equilibrium is achieved. To check the fidelity of this simulation model, virtual loop sensors are placed in the simulation model according to their real positions on ramps and arterial roadways. Traffic counts and speeds are collected from these virtual loop detectors and compared to the reference data. If they are significantly different, then trip attraction and production in the OD matrices are rebalanced so that the difference can be reduced. These steps are iterated until the volume difference is reasonably small (less than 10%).
A Self-Adaptive Toll Rate Algorithm for High Occupancy Toll (HOT) Lane Operations
Page 43
Figure 4-4 Schematic flow chart of the calibration procedure
Annual average daily traffic volumes and speeds are utilized to calibrate the driving behavior parameters. In VISSIM, traffic flow is modeled as a discrete and stochastic process, in which each driver-vehicle-unit is treated as a single entity. The freeway car following logic uses the Wiedemann 99 Model (PTV 2007, Wiedemann 1991) and involves ten parameters, including
A Self-Adaptive Toll Rate Algorithm for High Occupancy Toll (HOT) Lane Operations
Page 44
standstill distance, headway time, etc. In this study, three major parameters: standstill distance, headway time, and minimum lane changing headway, are adjusted according to the observed field headway data. Also, other parameters, such as the look-back distance, are modified separately for weaving areas. A detailed driving behavior calibration procedure for freeway operations can be found in Gomes’s research (2004). After tuning up these parameters, the simulation model is iteratively executed until traffic assignment is equilibrated in the network. Based on the comparisons between the simulation results and the corresponding reference data, such calibration processes are repeated. Once the difference is small enough, the model is considered reasonably calibrated and is ready for HOT lane simulations.
To verify the overall reliability of the calibrated simulation model, five important locations on the northbound SR-167 corridor and two locations on the I-450 interchange bridge are chosen as checkpoints as illustrated in Figure 4-5. Simulated traffic volumes and speeds are compared with ground-truth data at these checkpoints. Figures 4-6 through 4-19 provide visual comparisons of traffic volumes and speeds at these locations.
A Self-Adaptive Toll Rate Algorithm for High Occupancy Toll (HOT) Lane Operations
Page 45
Figure 4-5 Diagrammatic locations of checkpoints on SR-167 and I-405 interchange bridge
A Self-Adaptive Toll Rate Algorithm for High Occupancy Toll (HOT) Lane Operations
Page 46
Traffic Volume (Veh/Hour)
Traffic Volume Comparisons Between Reference Data and Simulaiton Outputs at SR-167 & 15th St. NW 4000 3500 3000 2500 2000 1500
Reference Traffic Volume Simulation Traffic Volume
1000 500 0 6:05 6:15 6:25 6:35 6:45 6:55 7:05 7:15 7:25 7:35 7:45 7:55 8:05 8:15 8:25 8:35 8:45 8:55 Time (AM)
Figure 4-6: Traffic volume comparisons between reference data and simulation outputs at the location of SR-167 & 15th St. NW
Traffic Speed Comparisons Between Reference Data and Simulaiton Outputs at SR-167 & 15th St. NW Traffic Speed (Mile/Hour)
70 60 50 40 30 20
Simulation Traffic Speed Reference Traffic Speed
10 0 6:05 6:15 6:25 6:35 6:45 6:55 7:05 7:15 7:25 7:35 7:45 7:55 8:05 8:15 8:25 8:35 8:45 8:55 Time (AM)
Figure 4-7: Traffic speed comparisons between reference data and simulation outputs at the location of SR-167 & & 15th St. NW
A Self-Adaptive Toll Rate Algorithm for High Occupancy Toll (HOT) Lane Operations
Page 47
Traffic Volume (Veh/Hour)
Traffic Volume Comparisons Between Reference Data and Simulaiton Outputs at SR-167 & S 277th St. 4000 3500 3000 2500 2000 1500
Reference Traffic Volume Simulation Traffic Volume
1000 500 0 6:05 6:15 6:25 6:35 6:45 6:55 7:05 7:15 7:25 7:35 7:45 7:55 8:05 8:15 8:25 8:35 8:45 8:55 Time (AM)
Figure 4-8: Traffic volume comparisons between reference data and simulation outputs at the location of SR-167 & 277th St.
Figure 4-9: Traffic speed comparisons between reference data and simulation outputs at the location of SR-167 & 277th St.
A Self-Adaptive Toll Rate Algorithm for High Occupancy Toll (HOT) Lane Operations
Page 48
Traffic Volume (Veh/Hour)
Traffic Volume Comparisons Between Reference Data and Simulaiton Outputs at SR-167 & SR 516/Kent-Des Moines Rd 4000 3500 3000 2500 2000 1500
Reference Traffic Volume Simulation Traffic Volume
1000 500 0 6:05 6:15 6:25 6:35 6:45 6:55 7:05 7:15 7:25 7:35 7:45 7:55 8:05 8:15 8:25 8:35 8:45 8:55 Time (AM)
Figure 4-10: Traffic volume comparisons between reference data and simulation outputs at the location of SR-167 & SR 516/Kent-Des Moines Rd.
Traffic Speed Comparisons Between Reference Data and Simulaiton Outputs at SR-167 & SR 516/Kent-Des Moines Rd Traffic Speed (Mile/Hour)
70 60 50 40 30 20
Simulation Traffic Speed Reference Traffic Speed
10 0 6:05 6:15 6:25 6:35 6:45 6:55 7:05 7:15 7:25 7:35 7:45 7:55 8:05 8:15 8:25 8:35 8:45 8:55 Time (AM)
Figure 4-11: Traffic speed comparisons between reference data and simulation outputs at the location of SR-167 & SR 516/Kent-Des Moines Rd.
A Self-Adaptive Toll Rate Algorithm for High Occupancy Toll (HOT) Lane Operations
Page 49
Traffic Volume (Veh/Hour)
Traffic Volume Comparisons Between Reference Data and Simulaiton Outputs at SR-167 & S. 212th St. 4000 3500 3000 2500 2000 1500
Reference Traffic Volume Simulation Traffic Volume
1000 500 0 6:05 6:15 6:25 6:35 6:45 6:55 7:05 7:15 7:25 7:35 7:45 7:55 8:05 8:15 8:25 8:35 8:45 8:55 Time (AM)
Figure 4-12: Traffic volume comparisons between reference data and simulation outputs at the location of SR-167 & S. 212th St.
Figure 4-13: Traffic speed comparisons between reference data and simulation outputs at the location of SR-167 & S. 212th St.
A Self-Adaptive Toll Rate Algorithm for High Occupancy Toll (HOT) Lane Operations
Page 50
Traffic Volume (Veh/Hour)
Traffic Volume Comparisons Between Reference Data and Simulaiton Outputs at SR-167 & SW 43rd St. 4000 3500 3000 2500 2000 1500
Reference Traffic Volume Simulation Traffic Volume
1000 500 0 6:05 6:15 6:25 6:35 6:45 6:55 7:05 7:15 7:25 7:35 7:45 7:55 8:05 8:15 8:25 8:35 8:45 8:55 Time (AM)
Figure 4-14: Traffic volume comparisons between reference data and simulation outputs at the location of SR-167 & SW 43rd St.
Traffic Speed Comparisons Between Reference Data and Simulaiton Outputs at SR-167 & SW 43rd St. Traffic Speed (Mile/Hour)
70 60 50 40 30 20 10
Simulation Traffic Speed Reference Traffic Speed
0 6:05 6:15 6:25 6:35 6:45 6:55 7:05 7:15 7:25 7:35 7:45 7:55 8:05 8:15 8:25 8:35 8:45 8:55 Time (AM)
Figure 4-15: Traffic speed comparisons between reference data and simulation outputs at the location of SR-167 & SW 43rd St.
A Self-Adaptive Toll Rate Algorithm for High Occupancy Toll (HOT) Lane Operations
Page 51
Figure 4-16: Traffic volume comparisons between reference data and simulation outputs at the location of milepost at 1.5 miles SB I-405
Figure 4-17: Traffic speed comparisons between reference data and simulation outputs at the location of milepost at 1.5 miles SB I-405
A Self-Adaptive Toll Rate Algorithm for High Occupancy Toll (HOT) Lane Operations
Page 52
Traffic Volume Comparisons Between Reference Data and Simulaiton Outputs at the location of Milepost 2.5 NB I-405 4000
Traffic Volume (Veh/Hour)
3500 3000 Reference Traffic Volume Simulation Traffic Volume
2500 2000 1500 1000 500 0
6:05 6:15 6:25 6:35 6:45 6:55 7:05 7:15 7:25 7:35 7:45 7:55 8:05 8:15 8:25 8:35 8:45 8:55 Time (AM)
Figure 4-18: Traffic volume comparisons between reference data and simulation outputs at the location of milepost at 2.5 miles NB I-405
Traffic Speed (Mile/Hour)
70
Traffic Speed Comparisons Between Reference Data and Simulaiton Outputs at the location of Milepost 2.5 NB I-405
60 50 40 30 Simulation Traffic Speed Reference Traffic Speed
20 10
0 6:05 6:15 6:25 6:35 6:45 6:55 7:05 7:15 7:25 7:35 7:45 7:55 8:05 8:15 8:25 8:35 8:45 8:55 Time (AM)
Figure 4-19: Traffic speed comparisons between reference data and simulation outputs at the location of milepost at 2.5 miles NB I-405
We can see that traffic volumes and speeds produced by the simulation model slightly fluctuate around the corresponding ground-truth annual average values. Considering the
Page 53
A Self-Adaptive Toll Rate Algorithm for High Occupancy Toll (HOT) Lane Operations
randomness of simulation outputs, such minor discrepancies are acceptable. Note that within the three-hour simulation period from 6:00 am to 9:00 am, traffic takes some time to gradually flow into the network and become stable. Also, vehicles generated near the end of the simulation period may not be able to complete their journey. Therefore, to avoid possible biased results, our analysis concentrates on one representative hour from 7:30 am to 8:30 am to screen out unfavorable disturbances. Table 4-1 shows descriptive statistics for both simulation outputs and their corresponding observed annual average values. Although simulation outputs have a bigger variation than the annual average ground-truth values, their mean values are reasonably close for both volumes and speeds. Based on both volume and speed comparisons at several vital locations, the overall simulation outputs are reasonably consistent with the reference data. Therefore, the author concludes that the model is well calibrated and can produce reliable analyses and results.
Table 4-1 Descriptive Statistics for Both Simulation Outputs and Their Corresponding Annual Average Values Time: 7:30am-8:30am 15th St. NW S. 277th St. SR-167 SR 516/KentDes Moines Rd. S. 212th St. SW 43rd ST. I-405
Simulation Outputs Volumea Speedb c Mean Std Mean Std 3266 196.6 42.3 8.4
Annual Average Traffic Data Volume Speed Mean Std Mean Std 3224 61.9 39.8 3.3
3303
177.7 39.7
2.8 3200
50.6
39.8
2.1
3381
127.1 47.4
3.6 3379
108.7
45.4
0.4
3155 2964
144.8 43.3 102.7 45.8
7.3 3128 9.9 2985
75.9 70.1
43.1
1.0
SB Milepost 1.5 3342
179.9 42.0
0.9 3571
32.8
42.5 1.5 38.8 0.5
NB Milepost 2.5
232.8 56.4
3.1 1535
35.8
56.7
a
1700
Vehicle Per Hour, b Mile Per Hour, c Standard Deviation
0.7
A Self-Adaptive Toll Rate Algorithm for High Occupancy Toll (HOT) Lane Operations
Page 54
4.3.5 Simulation of HOT lane operations The dynamic tolling algorithm proposed in Chapter 3 is implemented in the external HOT lane model controller module. Virtual loop detectors are employed in the simulation model. Real-time traffic movement data can be read by this external HOT lane module via the COM interfaces. Based on the toll rate and traffic conditions on the HOT and GP lanes, a lane choice decision is made for each individual vehicle being monitored in the merging area. During this process the coefficient of Equation 3-1 needs to be determined. In this study, the value of time of $11.7 per hour is applied. This ratio value is obtained from the traffic survey in the greater Seattle area. The traffic network is abstracted by the node-edge components in VISSIM. In coding the external HOT lane module, each optional route is expressed by an ordered sequence of nodes consistent with the model configuration. After a new route decision is transmitted to each individual vehicle, its original route will be replaced so that appropriate HOT lane operations can be simulated under the dynamic tolling strategy. In this simulation model, five HOT lane sections are established. Our tests on this module indicate that the HOT lane module is able to handle all five HOT lane segments simultaneously.
Although VISSIM 4.30 is widely utilized for freeway modeling due to its ability to simulate various common transportation operations, it cannot sufficiently handle the HOT lane operation issues using its built-in modules. In this study, an independent functional module is developed to realize HOT lane simulation through the VISSIM COM interfaces. Microsoft Visual Basic is used as the external program to develop the HOT lane module in which the proposed tolling algorithm is implemented. A simulation model is established to emulate the HOT lane operation for the Washington SR 167 HOT lane pilot project.
A Self-Adaptive Toll Rate Algorithm for High Occupancy Toll (HOT) Lane Operations
Page 55
Five HOT lane sections on northbound SR-167 from SW 15th Street in Auburn to Interstate 405 in Renton, WA, are configured in the simulation model by following the exact geographic features in reality, including the location of on-ramps and off-ramps, freeway curvature and length, weaving sections, the number of lanes, and so on. A sketch map for the overall simulation network is shown in Figure 4-3. These five HOT lane sections were selected because they represent diversified HOT lane features. For example, two off-ramps and three onramps are distributed along HOT Lane Segment 1, and its length is about 2.8 miles; HOT Lane Segment 2 is about 1.3 miles with one off-ramp and one on-ramp. The morning-peak hours of 6:00 to 9:00 am is chosen as the simulation time period. Three kinds of vehicles are adopted to represent a general traffic composition: SOVs, HOVs, and trucks. Dynamic traffic assignment is utilized to strengthen the practicality and validity of the simulation model. Based on the observed ground-truth data, including traffic volume and speed, the simulation model is well calibrated to properly reproduce the existing traffic conditions.
To acquire accurate speed data needed by the tolling algorithm, each HOT lane section has virtual loop detectors deployed evenly along the HOT and GP lanes in the simulation model. Based on these real-time speed data, the space-mean speed is calculated for the travel time estimation and toll determination. Based on network characteristics of this HOT lane system and the efforts of trial and error, the toll update interval is specified as 5 minutes to balance the control stabilization and timeliness. Additionally, to minimize the randomness of simulation results and enhance the credibility of the simulation models, a total of 7 simulation runs were conducted, each with a different random seed arbitrarily selected. The integrated results from these simulation runs are considered statistically reliable and unbiased.
A Self-Adaptive Toll Rate Algorithm for High Occupancy Toll (HOT) Lane Operations
Page 56
4.4 Simulation Experimental Design
Using the external HOT lane module, simulation tests are conducted to quantify the HOT lane system performance and identify the potential problems with the SR-167 HOT lane project. Two basic test scenarios are used: current HOV lane operations and the proposed HOT lane operations. Based on our simulation results, two bottlenecks are identified under the proposed HOT lane operations, one at the northbound SR-167 exit ramp to northbound I-405, and the other at the northbound SR-167 exit ramp to southbound I-405. Both bottlenecks are marked in red squares in Figure 4-20. Due to the enhanced traffic capacities of upstream roadway sections, severe congestion is predicted to form up at the two SR-167 exit ramps to I-405.
To address these issues, two improvement plans have been developed by WSDOT. The first plan is to reconfigure the merging segments to allow vehicles in the NB I-405 Connection Distributor (CD) lane to merge into the I-405 mainline early. This can mitigate the congestion at the first bottleneck by eliminating the section where vehicles from both directions of SR-167 jointly merge into the I-405 mainline. A diagrammatic sketch of this improvement is illustrated by the right red square in Figure 4-21. Analogously, the second plan is to add a lane to each direction on I-405 just west of the SR 167 & I-405 interchange. The added lane on SB I-405 will directly receive traffic moving from SR 167 NB to I-405 SB as shown in the red rectangle on the left side. This will eliminate the merging in the SB CD lane and reduce the merging movements downstream compared to the existing condition. To fully examine the feasibility of the two improvement plans and quantitatively analyze the overall system performance, these two improvement plans are tested and evaluated.
A Self-Adaptive Toll Rate Algorithm for High Occupancy Toll (HOT) Lane Operations
Page 57
Figure 4-20 Two bottlenecks resulted from the enhanced capacities of upstream HOT lane sections
Figure 4-21 A diagrammatic sketch of the proposed improvements with the existing infrastructure
Additionally, to fully investigate the robustness and applicability of the proposed tolling algorithm, simulation tests were conducted under various traffic demands for HOV and HOT lane operations. Based on the calibrated simulation model, the current peak-hour traffic demand from 6:00 to 9:00 am serves as the benchmark data set, and then traffic volumes change in 10% increments from 80% to 140% of benchmark. Such wide-ranging test conditions provide a reliable platform to demonstrate the effectiveness of the tolling algorithm and quantify HOT lane system performance. In brief, test scenarios are listed as follows:
A Self-Adaptive Toll Rate Algorithm for High Occupancy Toll (HOT) Lane Operations
Page 58
Scenario 1: HOV lane and HOT lane operations under the current traffic demand; Scenario 2: HOT lane operations plus reconfiguring the NB 167-NB to I-405 exit ramp
under the current traffic demand; Scenario 3: HOT lane operations with one lane added to each direction of I-405 just west of
the SR 167 & I-405 interchange under the current traffic demand; and Scenario 4: HOV lane and HOT lane operations under various traffic demands.
4.5 Simulation Model Development Summary
VISSIM-based simulation models were developed to examine the effectiveness of the proposed tolling algorithms. A COM-based tolling controller module is developed for dynamically optimizing HOT lane operations. Simulation models are configured and calibrated using groundtruth data collected from the study site. Verification results indicate that simulation models can reasonably represent the traffic operations in reality and are ready for further simulation experiments and analysis. Also, representative experimental test scenarios are designed. The test results and analyses are provided in the next chapter.
A Self-Adaptive Toll Rate Algorithm for High Occupancy Toll (HOT) Lane Operations
Page 59
CHAPTER 5 SIMULATION TESTS AND ANALYSES Simulation experiments are conducted to examine the performance of the proposed tolling algorithm for HOT lane system operations. Experiment results and analyses are detailed in this chapter.
5.1 Simulation tests under current traffic demands
First, simulation experiments are conducted for Scenarios 1 through 3 under the current traffic demand. In VISSIM, traffic generation is manipulated by a random seed number. By employing different random seeds, simulation results change correspondingly, but within a certain range. To minimize the randomness of simulation results and enhance simulation models’ credibility, multiple simulation runs are necessary. In this study, for Scenarios 1, 2, and 3, a total of 12 simulation iterations are conducted, each with a different random seed arbitrarily selected. The integrated results from these simulation runs are considered statistically reliable and unbiased. To suitably measure the system performance, traffic volumes and speeds are collected at multiple travel sections, including each HOT lane segment, merging areas, and the two overall travel sections (travel sections 1 and 2) covering the entire HOT lane corridors and I-405 interchanges as shown in Figure 4-3.
Simulation results are partially summarized in Table 5-1, including travel time, throughputs, and space-mean speeds by predefined segments. Selection of HOT Lane Section 2 is determined by the fact that it represents a typical HOT lane segment. In Table 5-1, we can see that under HOV lane operations, the average speed of the GP lanes is 39 MPH (63 KM/H), and that of the HOV lane is 60 MPH (96 KM/H), or the posted speed limit. The average speed for
A Self-Adaptive Toll Rate Algorithm for High Occupancy Toll (HOT) Lane Operations
Page 60
both GP and HOV lanes is about 42 MPH (68 KM/H). Under the HOT lane scenario, the number of vehicles choosing the HOT lane increases from 558 to 910, and consequently the average speed of the GP lanes increases to 50 MPH (80 KM/H). However, the speed of the HOT lane stands at the same level, about 59 MPH (95 KM/H), and the overall average speed of both HOV and GP lanes increases to 52 MPH (84 KM/H). Such results demonstrate that substantial benefits can be achieved through HOT lane operations. Analogous analysis can be conducted for the onramp and off-ramp traffic. Note the speed of the merging segment drops from 55 MPH (89 KM/H) to 47 MPH (76 KM/H) due to the increased weaving movements. Considering the short length of the merging area, however, such negative influence is not enough to offset the significant benefits accomplished from HOT lane sections. In general, under HOT lane operations, the excess capacities of the HOV lane are effectively utilized. Meanwhile, there are no obvious negative impacts on the HOVs because the desired travel speed and reliability are preserved.
Due to the increased throughput of upstream HOT lane sections, the two bottlenecks become more acute at two exit ramps from SR-167 to the NB and SB I-405 Bridge as shown in Figure 4-20. When more vehicles pass through the upstream HOT lane sections and overflow into the exit ramps, the current discharging capacities are exceeded. Compared to the HOV operation, the queued traffic would accumulate faster and extend to HOT Lane Section 5. Tables 5-1 and 5-2 show the degraded performance of HOT Lane Section 5. Compared to HOV lane operations, traffic speeds and total throughputs decrease significantly under HOT lane operations. The overall average speed of both HOV and GP lanes reduces from 54 MPH (87 KM/H) to 32 MPH (51 KM/H), and the total throughput decreases from 2618 to 2588 vehicles.
A Self-Adaptive Toll Rate Algorithm for High Occupancy Toll (HOT) Lane Operations
Page 61
Because of the severe congestion at the two bottlenecks, the net benefit gained from the upstream HOT lane operations is almost canceled. The total travel time for Overall Travel Section 1 increases slightly from 1384.8 to 1405.3 seconds, correspondingly, average speed drops to some extent from 34 MPH (55 KM/H) to 33 MPH (53 KM/H). Analogous analyses can be conducted for Overall Travel Section 2. These simulation results indicated that the proposed HOT lane operations can considerably improve traffic efficiencies (increased speed and throughput) upstream, but such gains would be significantly compromised by limited discharging capacities at the current terminus exit if the planned improvements are not implemented.
Indeed, our simulation results indicate that Scenarios 2 and 3, both with the improved exit ramps, significantly improve overall corridor performance. Test results of these two prospective scenarios confirm the applicability and necessity of the two improvement plans. In Scenario 2, after the terminus exit of the HOT lane is modified, traffic is diverged before it merges into the I405 corridor and congestion is mitigated remarkably. The travel time of Overall Travel Section 1 is 1083.6 seconds, a decrease of 312 seconds when compared to Scenario 1. However, because NB SR-167 to SB I-405 ramp improvements are not included in this scenario, traffic on Overall Travel Section 2 is still in the severely congested condition. The average speed is about 30 MPH (48 KM/H). This problem is relieved in Scenario 3 with an additional lane added to each direction of I-405 just west of the interchange. The average speed of Overall Travel Section 2 increases from 30 MPH (48 KM/H) to 53 MPH (85 KM/H), and the total throughput increases from 228 to 248 vehicles. Note that this improvement also helps to improve the traffic on Overall Travel Section 1. Its travel time reduces further from 1083 to 910 seconds and the average speed increases to 52 MPH (84 KM/H).
Page 62
A Self-Adaptive Toll Rate Algorithm for High Occupancy Toll (HOT) Lane Operations
Table 5-1 Integrated Simulation Results for Operation Scenario 1 from 12 Simulation Runs Time : 7:30-8:30 AM
Merging Area 2 HOT GP+HOV/HOT Segment 2: GP Lane Length HOV/HOT Lane =1.30 Mile On-Ramp Off-Ramp Merging Area 5 HOT GP+HOV/HOT Segment 5: GP Lane Length HOV/HOT Lane =1.38 Mile On-Ramps Off-Ramps NBSectionTo405Bridge NBRampToNB405Bridge NBRampToSB405Bridge OVERALL GP+HOV/HOT 167NBGP Lane Only 405NB: Length = HOV Lane Only 13.04 Mile OVERALL GP+HOV/HOT 167NBGP Lane Only 405SB: Length = 13.52 Mile HOV/HOT Lane Only a
Scenario 1: HOV Operation
Scenario 1: HOT Operation
TTa
TPb
SPc
TT
TP
SP
39.7 112.0 119.1 77.9 43.8 41.7 35.2 92.4 94.9 83.1 17.1 52.2 109.2 212.3 419.8 1384.8
3568 3190 2634 558 552 283 3495 2618 2053 567 839 816 3429 960 718 214
55 42 39 60 42 50 56 54 52 60 47 45 37 15 12 34
49.2 89.3 93.5 78.6 40.3 39.0 43.4 155.1 184.9 108.8 68.5 55.7 284.3 217.9 544.3 1405.3
3559 3226 2318 910 554 280 3540 2588 1569 1022 784 833 3176 908 651 208
46 52 50 59 46 53 48 32 27 46 18 44 14 17 10 33
1432.7
33
1448.8
32
1132.9
41
1332.6
35
31
1630.2
1606.1
30
1673.6
29
1306.4
37
1557.5
31
1558.3
119
117
30
Travel Time (Sec.), b Throughputs, c Speed (MPH)
Additionally, two reference travel times are calculated and provided for Overall Travel Section 1 and 2, respectively. For instance, if a user chooses to pay to travel across Section 1 using the entire HOT lanes, the total travel time is expected to be 879 seconds, less than the travel time of 927 seconds that he/she would spend in using GP lanes without paying. These data collected from different simulation scenarios are helpful to update the proper toll rates as feedback information before HOT lane operations are executed in reality.
Page 63
A Self-Adaptive Toll Rate Algorithm for High Occupancy Toll (HOT) Lane Operations
Table 5-2 Integrated Simulation Results for Operation Scenarios 2 and 3 from 12 Simulation Runs Time : 7:30-8:30 AM
Merging Area 2 HOT GP+HOV/HOT Segment GP Lane 2: Length HOV/HOT Lane =1.30 Mile On-Ramp Off-Ramp Merging Area 5 GP+HOV/HOT HOT Segment GP Lane 5: Length HOV/HOT Lane =1.38 Mile On-Ramps Off-Ramps NBSectionTo405Bridge NBRampToNB405Bridge NBRampToSB405Bridge OVERAL GP+HOV/HOT L 167NBGP Lane Only 405NB: Length = HOV Lane Only 13.04 Mile OVERAL GP+HOV/HOT L 167NBGP Lane Only 405SB: Length = 13.52 Mile HOV/HOT Lane Only a
Scenario 2: HOT Operation with NB Exit Ramp Improvement TTa
TPb
SPc
Scenario 3: HOT Operation with NB and SB Exit Ramp Improvements TT TP SP
45.4 88.7 92.5 78.9 39.7 39.1 41.9 113.9 126.2 95.9 41.8 50.1 204.8 72.9 638.7 1083.6
3568 3242 2332 912 554 281 3568 2659 1576 1085 806 842 3276 961 652 228
48 53 51 59 47 53 48 44 39 52 38 47 22 45 8 43
46.7 89.2 93.4 78.9 39.7 39.1 41.3 88.2 91.0 84.0 14.6 49.4 65.0 77.6 91.3 910.5
1110.0
42
927.0
51
1039.2
45
879.7
53
30
924.1
1656.2
29
940.6
52
1585.4
31
893.3
54
1629.8
118
3596 3277 2325 954 554 283 3589 2703 1594 1111 840 845 3549 1025 836 248
177
47 52 50 59 47 53 49 56 55 59 54 48 56 43 55 52
53
Travel Time (Sec.), b Throughputs, c Speed (MPH)
Then, simulation experiments are conducted under current traffic conditions. The integrated simulation results are summarized in Table 5-3, including travel time, throughputs, and space-mean speeds for the entire HOT lane system. To facilitate the comparison of system performance under HOV lane operations and HOT lane operations, an improvement ratio is defined. For traffic speed analysis, the improvement ratio, IRspeed, can be computed as follows
A Self-Adaptive Toll Rate Algorithm for High Occupancy Toll (HOT) Lane Operations
IRspeed
SPHOT SPHOV SPHOV
Page 64
(5-1)
Where, SPHOT denotes the average traffic speed under HOT lane operations; SPHOV denotes the average traffic speed achieved under HOV lane operations. Similarly, an analogous variable is defined for analyzing traffic throughputs. Table 5-3 shows these variables quantifying the improvement for throughputs and speeds under the “improvement” column. As we can see, for example, Lane Segment 2, under HOV lane operations, the average speed of the GP lanes is 41.2 MPH, and that of HOV lane is 60.0 MPH. The average speed for both GP and HOV lanes is about 43.6 MPH. Under HOT lane operations, the number of vehicles choosing the HOT lane increase from 1574 to 2430 within 3 hours, and, consequently, the average speed of the GP lanes increases to 53.5 MPH. However, the HOT lane speed stands at the same level, about 59.2 MPH, and the overall average speed of both HOT and GP lanes increases to 55.0 MPH from 43.6 MPH, an improvement of 26.2%. The total throughputs maintain the same level, although there is a slight increase from 9153 to 9226. Although there is congestion under HOV lane operation, the existing traffic system is capable of handling all through vehicles within present traffic demands. Hence, switching HOV to HOT operations does not have significant enhancement in terms of traffic throughputs. Similar analysis can be conducted for on-ramp and off-ramp traffic for HOT lane Segment 2.
For other HOT lane segments, similar results can be obtained from Table 5-3. The overall traffic efficiency is improved remarkably under HOT lane operations. Note that for HOT Lane Segment 5, traffic operates reasonably well under the present HOV lane system. The average
A Self-Adaptive Toll Rate Algorithm for High Occupancy Toll (HOT) Lane Operations
Page 65
speed for both GP and HOV lanes is about 53.9 MPH. Therefore, no considerable improvements are expected under HOT lane operations.
Table 5-3 Integrated Simulation Results under Existing Traffic Demands from Seven Simulation Runs
Simulation Time Period: 6:00-9:00 Am Merging Area 1 GP+HOV/HOT GP Lane HOT Segment 1: HOV/HOT Lane Length = On-Ramps 2.8Mile Off-Ramps Merging Area 2 GP+HOV/HOT GP Lane HOT Segment 2: HOV/HOT Lane Length = On-Ramps 1.3Mile Off-Ramps Merging Area 3 GP+HOV/HOT GP Lane HOT Segment 3: HOV/HOT Lane Length = On-Ramps 1.2Mile Off-Ramps Merging Area 4 GP+HOV/HOT GP Lane HOT Segment 4: HOV/HOT Lane Length = On-Ramps 2.4Mile Off-Ramps Merging Area 5 GP+HOV/HOT GP Lane HOT Segment 5: HOV/HOT Lane Length = On-Ramps 1.4Mile Off-Ramps a
HOV Operation HOT Operation Improvement b c TT TP SP TT TP SP TP SP 57.9 7747 34.2 64.3 7732 30.8 -0.2% -9.9% 230.0 5588 43.6 176.1 5586 56.9 0.0% 30.6% 242.0 4677 41.4 180.8 2573 55.4 -45.0% 33.8% 168.4 912 59.5 172.1 3013 58.3 230.5% -2.1% 71.7 5401 24.5 32.7 5445 52.2 0.8% 113.0% 22.5 2712 34.2 20.7 2684 36.9 -1.0% 7.9% 44.6 10142 48.7 44.6 10210 48.7 0.7% 0.0% 107.3 9153 43.6 85.0 9226 55.0 0.8% 26.2% 113.3 7579 41.2 87.3 6796 53.5 -10.3% 29.8% 77.9 1574 60.0 78.9 2430 59.2 54.4% -1.2% 42.8 1588 43.6 38.7 1592 48.0 0.2% 10.0% 43.6 893 48.6 39.0 899 53.1 0.7% 9.3% 40.5 10695 44.0 44.0 10789 40.5 0.9% -8.0% 86.0 8511 49.9 74.7 8614 57.4 1.2% 15.1% 88.5 7272 48.5 75.5 7151 56.9 -1.7% 17.2% 71.3 1239 60.2 71.0 1463 60.0 18.1% -0.3% 35.1 1573 52.5 30.8 1575 57.2 0.1% 9.0% 39.8 2092 47.6 38.1 2109 49.3 0.8% 3.7% 37.5 10033 47.1 33.5 10155 52.7 1.2% 11.9% 225.4 7288 37.7 149.8 7435 56.8 2.0% 50.5% 239.7 6207 35.5 152.1 4852 55.9 -21.8% 57.6% 143.5 1081 59.3 145.2 2583 58.6 138.9% -1.2% 40.4 3310 44.7 33.3 3352 53.6 1.3% 19.9% 34.2 2715 38.2 25.5 2760 49.9 1.7% 30.6% 35.2 9905 56.2 41.4 10062 47.8 1.6% -15.0% 92.1 7445 53.9 86.4 7581 57.4 1.8% 6.6% 94.7 5783 52.4 88.0 4583 56.4 -20.8% 7.6% 83.0 1663 59.8 83.9 2998 59.1 80.3% -1.1% 16.0 2475 50.1 14.3 2476 55.8 0.0% 11.4% 53.3 2366 44.5 48.6 2410 48.8 1.9% 9.6% a
Travel Time (Second), b Throughputs, c Speed (Mile Per Hour)
A Self-Adaptive Toll Rate Algorithm for High Occupancy Toll (HOT) Lane Operations
Page 66
5.2 Simulation tests under various traffic demands
Further simulation tests were conducted on broadly changing traffic demands. Based on the present traffic condition, six additional test scenarios are proposed with the demands distributing from 80% to 140% of the current demand. Simulation results for HOT Lane Segment 2 are shown in Table 5-3. This segment is representative for a typical HOT lane operation. As can been seen from Table 5-4, under HOV lane operations the maximum throughputs that can be efficiently handled by the existing infrastructure is about 9153 vehicles with the current demand. When the demand increases, overall traffic conditions deteriorate, and traffic speeds and throughputs decrease notably. However, under HOT lane operations, due to the enhanced traffic capacities, the maximum throughputs increase to 9489 vehicles, corresponding to 110% of the current demand. The improvement of traffic throughputs and speed accomplished by HOT lane operations is progressively noticeable with the increasing demand. The maximum improvements are 11.8% and 61.5% for traffic throughputs and speed, respectively, corresponding to 130% of the current demand. Note that immunizing from the negative impacts of the increased demands, the HOT lane speed is preserved in the desired range. The minimum speed is about 47.1 MPH, slightly higher than the HOT lane speed criterion of 45 MPH. These analytical results clearly indicate enhanced system performance of the HOT lane system and further clarify that the proposed tolling algorithm is capable of optimizing the overall traffic operation and ensuring travel reliability on the HOT lane under various traffic conditions.
Page 67
A Self-Adaptive Toll Rate Algorithm for High Occupancy Toll (HOT) Lane Operations
Table 5-4 Integrated Simulation Results for HOT Lane Segment 2 under Various Traffic Demands from Seven Simulation Runs HOV Operation TTa TPb SPc
HOT Operation TT TP
Improvement TP SP
Simulation Time Period: 6:00-9:00 Am GP+ HOV/HOT GP Lane HOV/HOT On-Ramps 80% Off-Ramps GP+HOV/HOT GP Lane HOV/HOT On-Ramps 90% Off-Ramps GP+HOV/HOT GP Lane HOV/HOT On-Ramps 100% Off-Ramps GP+HOV/HOT GP Lane HOV/HOT On-Ramps 110% Off-Ramps GP+HOV/HOT GP Lane HOV/HOT On-Ramps 120% Off-Ramps GP+HOV/HOT GP Lane HOV/HOT On-Ramps 130% Off-Ramps GP+HOV/HOT GP Lane
80.7 81.4 77.8 35.7 38.5 83.2 84.4 77.9 37.6 38.9 107.3 113.3 77.9 42.8 43.6 134.6 145.7 78.1 47.5 53.4 183.1 202.2 78.4 55.0 75.3 211.5 234.8 78.9 75.4 90.3 255.2 284.3
7976 6384 1592 1321 776 8576 6985 1591 1443 833 9153 7579 1574 1588 893 9117 7621 1496 1691 889 8764 7410 1354 1819 897 8330 7087 1243 1949 893 7859 6747
57.9 57.4 60.0 51.9 53.9 56.1 55.3 60.0 49.3 53.3 43.6 41.2 60.0 43.6 48.7 34.7 32.1 59.8 39.1 39.1 25.5 23.1 59.6 33.8 27.6 22.1 19.9 59.2 24.9 23.0 18.3 16.4
80.5 81.2 77.7 35.5 38.4 81.7 82.8 78.0 36.7 38.8 85.0 87.3 78.9 38.7 39.0 93.4 98.7 81.8 41.8 39.3 117.6 127.8 88.5 46.8 46.6 131.0 146.0 96.3 57.1 52.3 157.6 176.8
7945 6287 1659 1321 774 8560 6568 1992 1444 832 9226 6796 2430 1592 899 9489 6547 2942 1700 913 9279 6643 2636 1812 924 9311 6350 2961 1947 942 8277 6093
58.1 57.6 60.1 52.1 53.9 57.2 56.4 59.9 50.5 53.5 55.0 53.5 59.2 48.0 53.2 50.0 47.3 57.1 44.3 52.8 39.7 36.5 52.8 40.4 45.4 35.7 32.0 48.5 34.4 41.2 29.6 26.4
-0.4% -1.5% 4.2% 0.1% -0.3% -0.2% -6.0% 25.2% 0.0% -0.1% 0.8% -10.3% 54.4% 0.2% 0.7% 4.1% -14.1% 96.7% 0.5% 2.6% 5.9% -10.4% 94.7% -0.4% 3.0% 11.8% -10.4% 138.2% -0.1% 5.6% 5.3% -9.7%
0.2% 0.2% 0.1% 0.5% 0.0% 1.9% 1.9% -0.2% 2.5% 0.3% 26.2% 29.8% -1.2% 10.0% 9.2% 44.0% 47.7% -4.5% 13.3% 35.0% 55.8% 58.2% -11.4% 19.5% 64.9% 61.5% 60.8% -18.0% 38.5% 79.2% 62.0% 60.8%
HOV/HOT On-Ramps 140% Off-Ramps
79.1 103.0 112.2
1112 2073 846
59.1 18.2 18.5
99.2 59.2 60.8
2184 1910 857
47.1 31.5 35.5
96.3% -7.8% 1.3%
-20.3% 73.3% 92.1%
a
SP
Travel Time (Second), b Throughputs, c Speed (Mile Per Hour)
A Self-Adaptive Toll Rate Algorithm for High Occupancy Toll (HOT) Lane Operations
Page 68
Visual comparisons on speed between the HOV/HOT and GP lanes under different operation scenarios confirm the analytical results achieved above. For instance, Figure 5-1 shows the comparison curves of traffic speed aggregated in 5-minute intervals for the HOV and GP lanes of Lane Segment 1 under HOV lane operations with the current traffic demand. Figure 5-2 shows the corresponding speed curves under HOT lane operations. The changing patterns of the GP lane speed in both figures indicate that by employing the tolling algorithm proposed in this study, the excess capacities of the HOT lane are effectively utilized and the GP lane speed is considerably improved; meanwhile, there are no obvious negative impacts on the HOV travel time because the desired travel speed and reliability are preserved on the HOT lane. Because the HOT and GP lane speeds are relatively consistent, and the toll is stable around $0.10 to $0.20 for SOVs to use this HOT lane.
Similar comparisons were conducted with the increasing demands. Figures 5-3 and 5-4 illustrate the speed comparison curves for the HOV/HOT lane and the GP lane with 140% of the current demand. We can see that under HOV lane operations, although the HOV lane speed maintains at the ideal level, traffic congestion generated by the dramatic increase of traffic demand severely corrupts the GP lane speed. This problem can be partially solved under HOT lane operations. Some SOVs are discharged through the HOT lane and the GP lane speed is improved to some extent. Figure 5-4 shows the HOT lane speed was suitably adjusted to adapt to the changing traffic conditions and optimize the overall traffic operations. Figure 5-5 demonstrates the changing pattern of the corresponding toll rate. Operated by the proposed tolling algorithm, the toll rate is self-adaptive to traffic conditions on GP and HOT lanes. For example, a maximum toll rate of about $3.90 per mile is immediately applied when the HOT
A Self-Adaptive Toll Rate Algorithm for High Occupancy Toll (HOT) Lane Operations
Page 69
lane speed drops to 30 MPH, then the HOT lane condition rapidly improves, and the toll rate is back to the normal value, e.g., $0.50 per mile. Such matching patterns between the toll rate and HOT lane speed indicate the appropriate sensitivity and robustness of the proposed tolling algorithm.
Traffic Speed Comparisons Between the GP Lane and the HOV Lane Under HOV Lane Operations 70 60
MPH
50 40 30 20
HOV Lane Speed
GP Lane Speed
10 0 6:05 6:15 6:25 6:35 6:45 6:55 7:05 7:15 7:25 7:35 7:45 7:55 8:05 8:15 8:25 8:35 8:45 8:55 Time (AM)
Figure 5-1 Traffic speed comparisons between the GP and HOV lanes for Lane Segment 1 under HOV lane operations with the current demand Traffic Speed Comparisons Between the GP Lane and the HOT Lane Under HOT Lane Operations 70 60 50 MPH
40 30 20
HOT Lane Speed
GP Lane Speed
10 0 6:05 6:15 6:25 6:35 6:45 6:55 7:05 7:15 7:25 7:35 7:45 7:55 8:05 8:15 8:25 8:35 8:45 8:55 Time (AM)
Figure 5-2 Traffic speed comparisons between the GP and HOT lanes for Lane Segment 1 under HOT lane operations with the current demand
A Self-Adaptive Toll Rate Algorithm for High Occupancy Toll (HOT) Lane Operations
Page 70
Traffic Speed Comparisons Between the GP Lane and the HOV Lane Under HOV Lane Operations 70 60
MPH
50 40 30 20 10
HOV Lane Speed
GP Lane Speed
0 6:05 6:15 6:25 6:35 6:45 6:55 7:05 7:15 7:25 7:35 7:45 7:55 8:05 8:15 8:25 8:35 8:45 8:55 Time (AM)
Figure 5-3 Traffic speed comparisons between the GP and HOV lanes for Lane Segment 1 under HOV lane operations with 140% of the current demand Traffic Speed Comparisons Between the GP Lane and the HOT Lane Under HOT Lane Operations 70 60 50 MPH
40 30 20
HOT Lane Speed
GP Lane Speed
10 0 6:05 6:15 6:25 6:35 6:45 6:55 7:05 7:15 7:25 7:35 7:45 7:55 8:05 8:15 8:25 8:35 8:45 8:55 Time (AM)
Figure 5-4 Traffic speed comparisons between the GP and HOT lanes for Lane Segment 1 under HOT lane operations with 140% of the current demand
A Self-Adaptive Toll Rate Algorithm for High Occupancy Toll (HOT) Lane Operations
Page 71
Toll Rate Changing Pattern Under HOT Lane Operations 4 3.5
Dollar
3 2.5 2 1.5 1
Toll Rate
0.5 0 6:05 6:15 6:25 6:35 6:45 6:55 7:05 7:15 7:25 7:35 7:45 7:55 8:05 8:15 8:25 8:35 8:45 8:55 Time (AM)
Figure 5-5 Toll rate changing pattern for Lane Segment 1 under HOT lane operations with 140% of the current demand
5.3 Tolling impacts on HOV travelers
Simulation experiments are conducted to investigate HOT lane system impacts on regular HOV travelers. The operation performance of HOVs is quantified under two test scenarios: previous HOV lane operations, and corresponding HOT lane operations with the current traffic demand. A total of 10 simulation runs are conducted, each with a different random seed arbitrarily selected. The integrated results from these simulation runs are collected by multiple travel sections summarized in Table 5-5, including travel time, throughputs, and space-mean speeds for HOVs. As we can see, HOV operations degrade significantly along the merging areas in the HOT lane system. For example, weaving movements decrease the average speed of HOVs from 53.1 MPH to 47.8 MPH in Merging Area 2 when HOV lanes are converted to HOT lanes, which correspond to an negative improvement of -9.98%. And total HOV throughputs maintain at the same levels. Similar results can be obtained for other merging areas. These data show that due to weaving movements majorly generated by tolled SOVs accessing in and out of HOT lanes, remarkable negative impacts are observed for HOV operations. The average HOV speeds noticeably drop
A Self-Adaptive Toll Rate Algorithm for High Occupancy Toll (HOT) Lane Operations
Page 72
from 5.50% (Merging Area 1) to 27.85% (Merging Area 3), although the throughputs fluctuate slightly. Additionally, note that the average speed of HOVs in Merging Area 1 is about 32.1 MPH which is considerably lower than that of other merging areas. This is because two offramps are very close to Merging Area 1, and the unfavorable weaving movements remarkably influence the smooth movements of vehicles. For the operation performance of HOVs on the HOV/HOT lanes, marginal deteriorations are observed. For instance, in Segment 3, the average speed of HOVs is about 60.2 MPH under HOV lane operations, and it slightly decreases to 58.2 MPH in the HOT lane system. Although more vehicles are carried by the HOT lane compared to the HOV lane, no severe interactions between vehicles, such as standstill and slowdown for changing lane, are introduced on the HOT lane. For the entire HOT lane system, the decrease in speed ranges from 1.46% (Segment 1) to 4.75% (Segment 2). Considering the randomness of simulation runs, such difference is not statistically significant.
For on-ramp and off-ramp trips, HOV operations are closely associated with specific geometric characteristics, traffic demand levels, traffic compositions, and driver behavior patterns. The separation between HOT and GP lanes deployed in HOT lane systems compromises the flexibility of HOVs for lane changing, however, due to the improvements in service conditions on GP lanes, the losses in travel time and trip reliability for HOVs could be compensated to some extent. Two representative examples are illustrated as follows. For HOT lane Segment 2, one on-ramp and one off-ramp are distributed along this 1.3-mile segment. The average speed of on-ramp HOVs is 50.3 MPH under HOV lane operations, which is appreciably higher than the speed of 45.6 MPH under HOT lane operations.
Page 73
A Self-Adaptive Toll Rate Algorithm for High Occupancy Toll (HOT) Lane Operations
Table 5-5 Integrated Simulation Results for HOV Operation Evaluation from 10 Simulation Runs Simulation Time Period: 6:00-9:00 Am Merging Area 1 HOT Segment 1: Length = 2.8 Mile
a
TT
TP
SP
TP
SP
37.3
1236
30.3
-2.55%
-5.50%
HOV/HOT
179.3
920
58.1
182.3
927
57.1
0.71%
-1.64%
On-Ramps
189.3
788
28.8
146.2
770
37.3
-2.40%
29.48%
Off-Ramps
176.6
357
36.9
140.1
363
46.6
1.68%
26.09%
100.2
1751
53.1
111.4
1777
47.8
1.51%
-9.98%
HOV/HOT
84.5
1476
55.2
88.7
1454
52.6
-1.51%
-4.75%
On-Ramps
39.3
107
50.3
43.3
109
45.6
1.87%
-9.35%
Off-Ramps
46.1
278
53.1
47.9
283
51.1
1.73%
-3.81%
50.0
1577
57.1
69.4
1569
41.2
-0.55%
-27.85%
HOV/HOT
71.0
1172
60.2
73.5
1131
58.2
-3.50%
-3.29%
On-Ramps
35.1
410
56.5
34.7
417
57.1
1.81%
1.12%
Off-Ramps
37.4
390
53.3
41.2
426
48.3
9.15%
-9.33%
37.2
1578
59.4
43.9
1542
50.3
-2.31%
-15.22%
HOV/HOT
144.1
1067
58.9
147.3
1074
57.6
0.65%
-2.20%
On-Ramps
74.2
794
55.2
78.6
797
52.1
0.35%
-5.55%
Off-Ramps
74.5
466
52.1
72.1
442
53.9
-5.09%
3.40%
46.9
1842
59.2
58.1
1861
47.8
1.02%
-19.26%
HOV/HOT
83.8
1671
59.1
86.3
1653
57.4
-1.04%
-2.92%
On-Ramps
14.8
543
58.8
16.2
543
54.0
-0.06%
-8.09%
Off-Ramps
62
176
47.3
60.2
183
48.5
4.27%
2.43%
Merging Area 5 HOT Segment 5: Length = 1.4 Mile
SP
Improvement
32.1
Merging Area 4 HOT Segment 4: Length = 2.4 Mile
TP
HOT Lane System c
1268
Merging Area 3 HOT Segment 3: Length = 1.2 Mile
TT
b
35.2
Merging Area 2 HOT Segment 2: Length = 1.3 Mile
HOV Lane System a
b
c
Travel Time (Second), Throughputs, Speed (Mile Per Hour)
Similar results can be obtained for off-ramp HOVs. This can be explained by the fact that due to limited access points for ingress and egress movements, HOVs may have to travel longer distance on GP lanes before entering the HOT lane or exiting the freeway under inferior travel conditions. However, as an opposite example, HOVs on Segment 1 demonstrate different characteristics. Segment 1 is 2.8-mile long with two off-ramps and three on-ramps. Simulation results indicate that considerable improvements on the average speeds of HOVs are achieved for on-ramps and off-ramps under HOT lane operations as shown in Table 5-5. Under HOV lane
A Self-Adaptive Toll Rate Algorithm for High Occupancy Toll (HOT) Lane Operations
Page 74
operations, a large number of weaving movements along the corridor significantly deteriorate traffic conditions on GP lanes. When the HOT lane system is implemented, some SOVs are reallocated to the HOT lane, and the GP lane travel condition can be improved. This improvement definitely facilitates traffic operations which more than offset the time loss caused by extra travel of HOVs on GP lanes.
5.4 Simulation test result summary
Simulation experiments were conducted to examine the performance of the proposed tolling algorithm. A wide range of test scenarios were designed and configured to represent real traffic operations for HOT lane system operations. Simulation experimental results were analyzed. The simulation results show that the proposed tolling algorithm performed reasonably well under various demand scenarios. The overall traffic efficiency is enhanced significantly by optimizing traffic operations on HOT and GP lanes systematically. Meanwhile, travel speed and reliability of HOVs are favorably preserved to satisfy the operation requirements.
A Self-Adaptive Toll Rate Algorithm for High Occupancy Toll (HOT) Lane Operations
Page 75
CHAPTER 6 CONCLUSIONS AND RECOMMENDATIONS
6.1 Conclusions
Over the past years, traffic congestion has become a frustrating problem, especially in metropolitan areas where traffic demand has been steadily increasing and transportation infrastructure has been unable to expand at the same pace. Traffic congestion costs millions of dollars of wasted fuel and millions of hours of delay as well as secondary accidents. It has been widely accepted that one of the most cost-effective solutions to traffic congestion is to manage existing traffic facilities in a more efficient manner with advanced traffic control and management technologies. HOT lane system is one of the vital traffic control technologies for freeway congestion mitigation. The HOT lane concept has been increasingly recognized and accepted as a viable measure to mitigate freeway congestion and improve travel time reliability. Optimized HOT lane management can yield significant economic returns and social benefits. However, it is difficult to quantitatively accomplish optimal HOT lane exploitation due to theoretical deficiency in these tolling schemes, although rough traffic-response-based tolling algorithms are applied to HOT lane operations based on practical experience. Therefore, developing an applicable and optimum tolling algorithm to enhance HOT lane system performance is of utmost significance.
To sufficiently handle the major problems generated by inferior tolling strategies, a new self-adaptive tolling algorithm has been developed to dynamically optimize HOT lane operations. A second-order control scheme is exploited in this algorithm. Based on the traffic speed conditions and toll changing patterns, the optimum flow ratio for HOT lane utilization is
A Self-Adaptive Toll Rate Algorithm for High Occupancy Toll (HOT) Lane Operations
Page 76
calculated using feedback control theory. The feedback increment is quantified by a piecewise optimal function of traffic speed measured from the GP and HOT lanes. Then the proper toll rate is backward estimated using the Logit model. By decomposing the calculation complexity, this tolling algorithm can satisfy the practicality and effectiveness required by the HOT lane system in reality. VISSIM-based simulation tests were conducted to examine the proposed tolling algorithm performance. An external HOT lane module was developed using Microsoft Visual Basic to implement the algorithm. All the five HOT lane sections on northbound SR 167 corridor in Washington State were simulated. The simulation results demonstrated that this tolling algorithm performs reasonably well under various traffic demands. Through optimal toll adjustment, SOVs are regulated to fully exploit the excess capacity of the HOT lane without degrading operation conditions for HOVs. Overall traffic efficiencies are improved significantly. The proposed tolling algorithm is of theoretical and practical importance for transportation researchers and engineers to optimize HOT lane system performance and enhance traffic mobility on congested freeway networks
6.2 Recommendations
The proposed tolling algorithm illustrated its promising performance for dynamically setting toll rates for HOT lane operations. However, further improvements are desired for extensive applications through fusing lane occupancy and flow rate into the feedback quantity to strengthen the robustness of the algorithm. Additionally, more research on Logit model calibration, including validation of the cash value-to travel time conversion ratio, is helpful to enhance the applicability of the proposed tolling algorithm before field implementations. Also,
A Self-Adaptive Toll Rate Algorithm for High Occupancy Toll (HOT) Lane Operations
Page 77
the proposed algorithm is better tested with data from other HOT lane projects to enhance its transferability and effectiveness.
A Self-Adaptive Toll Rate Algorithm for High Occupancy Toll (HOT) Lane Operations
Page 78
ACKNOWLEDGMENTS The authors are grateful for the financial support to this project from Transportation Northwest (TransNow), the USDOT University Transportation Center for Federal Region 10, and the Washington State Department of Transportation (WSDOT). The authors would like to acknowledge Mr. Shuming Yan, Mr. Craig Helmann, Mr. Scott, Clyde, Mr. Delwar, Murshed and Mr. Goudarzi, Manouchehr in the Urban Planning Office at Washington State DOT for support of this research. Special thanks to Mr. Jonathhan Corey for his assistance in analyzing test results and completing this project. The Permissions are granted to use some figures, tables, and sections of text from the paper “Simulation-Based Investigation on High-Occupancy Toll Lane Operations for Washington State Route 167” and the paper “A Feedback-Based Dynamic Tolling Algorithm for High-Occupancy Toll Lane Operations” by the ASCE Journal of Transportation Engineering and by the Transportation Research Board, respectively.
A Self-Adaptive Toll Rate Algorithm for High Occupancy Toll (HOT) Lane Operations
Page 79
REFERENCES Appiah J., and M. W. Burris, (2005) QuickRide User Response to Different HOT Lane Operating Scenarios. In the 84th annual meeting of the Transportation Research Board, CDROM. Transportation Research Board, National Research Council, January 9-13, Washington, D.C., 2005.
Bloomberg, L. and Dale, J. 2000. Comparison of VISSIM and CORSIM Traffic Simulation Models on a Congested Network. Transportation Research Record 1727, TRB, National Research Council, Washington D.C. pp. 52-60.
Bureau of Transportation Statistics. National Transportation Statistics 2007. U.S. Department of Transportation. Washington, D.C., 2004.
Chu, L, K. S. Nesamani, and H. Benouar. Priority Based High Occupancy Vehicle Lanes Operation, In the 86th annual meeting of the Transportation Research Board, CD-ROM. Transportation Research Board, National Research Council, January 21-25, Washington, D.C., 2007.
Dahlgren D., High Occupancy Vehicle Lanes: Not Always More Effective Than General Purpose Lanes. Transportation Research A, Vol. 32. No. 2. 1998. pp.99-114.
Fielding J.G. and D. B. Klein. High Occupancy/Toll Lanes: Phasing in Congestion Pricing a Lane at a Time. Reason Foundation, Policy Study No. 170, 1993.
A Self-Adaptive Toll Rate Algorithm for High Occupancy Toll (HOT) Lane Operations
Page 80
Florida Department of Transportation. 95 Express. http://www.95express.com/. Accessed 10/10/2008.
Gomes, Gabriel; May, Adolf and Horowitz, Roberto. 2004. A Microsimulation Model of a Congested Freeway using VISSIM. Transportation Research Record 1876, TRB, National Research Council, Washington D.C. pp. 71-81.
Halvorson, R., M. Nookala, and K. R. Buckeye, High occupancy toll lane innovations: I-394 MnPASS. In the 85th annual meeting of the Transportation Research Board, CD-ROM. Transportation Research Board, National Research Council, January 22-26, Washington, D.C., 2006.
Kim, A.M., Y. Gardes, and A.D. May, Application of the Paramics Model. In High Occupancy Vehicle Lane Operations. In the 9th World Congress on Intelligent Transport Systems. Chicago. 2002.
Kwon, J. and P. Varaiya, Effectiveness of High Occupancy Vehicle Lanes in San Francisco Bay Area, University of California, Berkeley and California State University, East Bay, California. 2005.
Li, Jianling, Embry. Patrick, Mattingly. Stephen, Kaveh Farokhi Sadabadi, Isradatta Rasmidatta, Mark W. Burris, Who Chooses to Carpool and Why: An Examination of Texas Carpoolers. .
A Self-Adaptive Toll Rate Algorithm for High Occupancy Toll (HOT) Lane Operations
Page 81
In the 86th annual meeting of the Transportation Research Board, CD-ROM. Transportation Research Board, National Research Council, January 21-25, Washington, D.C., 2007.
Lowrie, P.R. (1982) SCATS principles, methodologies, algorithm, IEE Conf. On Road Traffic Signal, IEE Publication 207, pp. 67-70, England.
Moen, B., Fitts, J., Carter, D., and Ouyang, Y. 2000. A comparison of the VISSIM Model to Other Widely Used Traffic Simulation and Analysis Programs. Presented at the Institute of Transportation Engineers 2000 Annual Meeting and Exhibit, Nashville, TN.
Mowday, M. Equity and High Occupancy Toll Lanes: A Literature Review and Minnesotans Perceptions About the I-394 High Occupancy Toll Lanes. In the 85th annual meeting of the Transportation Research Board, CD-ROM. Transportation Research Board, National Research Council, January 22-26, Washington, D.C., 2006.
Papageorgiou, M., H. Haj-Salem, and F. Middelham, (1997) ALINEA local ramp metering: summary of field results. In Transportation Research Record: Journal of Transportation Research Board, No. 1603, TRB, National Research Council, Washington, D.C.,1997, pp. 90-98.
PTV. (2008). "VISSIM User Manual - V.4.30”. Karlsruhe, Germany.
A Self-Adaptive Toll Rate Algorithm for High Occupancy Toll (HOT) Lane Operations
Page 82
Shrunk, D. and T. Lomax. The 2005 Urban Mobility Report. Texas Transportation Institute. The Texas A&M University System (http://mobility.tamu.edu/, access on Jul. 14, 2007). 2005.
Tian, Z. Z., Urbanik, T., Engelbrecht, R., and Balke, K. 2002. Variations in Capacity and Delay Estimates from Microscopic Traffic Simulation Models. Transportation Research Record 1802, TRB, National Research Council, Washington D.C. pp. 23-31.
Tilahun, N.Y., and D. M. Levinson. Unexpected delay and cost of lateness on I-394 high occupancy/toll lanes. In the 87th annual meeting of the Transportation Research Board, CDROM. Transportation Research Board, National Research Council, January 13-17, Washington, D.C., 2008.
Turnbull K. F. High Occupancy Toll (HOT) lanes and Public Transportation. In the 87th annual meeting of the Transportation Research Board, CD-ROM. Transportation Research Board, National Research Council, January 13-17, Washington, D.C., 2008.
Wiedemann R.. "Simulation des Straßenverkehrsflusses". (In German) Schtiftenreihe des Instituts fur Verkehrswesen der Universitat Karlsruhe, Heft 8, 1974.
Wiedemann R.. "Modelling of RTI-Elements on multi-lane roads". Advanced Telematics in Road Transport, 1991.
A Self-Adaptive Toll Rate Algorithm for High Occupancy Toll (HOT) Lane Operations
Page 83
WSDOT (Washington State Department of Transportation), SR 167 - HOT Lanes Pilot Project http://www.wsdot.wa.gov/projects/sr167/hotlanes (access on July 14, 2007)
Yin, Y., and Y. Lou. Dynamic Tolling Strategies for Managed Lanes. In the 86th annual meeting of the Transportation Research Board, CD-ROM. Transportation Research Board, National Research Council, January 21-25, Washington, D.C., 2007.
Zhang, G., S. Yan, and Y. Wang. Simulation-based Investigation on High Occupancy Toll (HOT) Lane Operations for Washington State Route 167. ASCE Journal of Transportation Engineering, Vol. 135, No. 10. 2009. pp. 677-686.
Zhang, G, Y. Wang, H. Wei and P. Yi, A Feedback-Based Dynamic Tolling Algorithm for High Occupancy Toll (HOT) Lane Operations, In Transportation Research Record: Journal of Transportation Research Board, No.2065, TRB, National Research Council, Washington, D.C., 2008, pp. 54-63.
Zmud J., S. Peterson, and F. Douma Preliminary Before and After Results of the I-394 HOT Lane Panel Survey. . In the 86th annual meeting of the Transportation Research Board, CDROM. Transportation Research Board, National Research Council, January 21-25, Washington, D.C., 2007.
Zmud. J., B.. Mark, F. Douma, and C. Simek., Panel Survey Evaluation of Attitudes and Willingness to Pay for Tolled Facilities. . In the 86th annual meeting of the Transportation
A Self-Adaptive Toll Rate Algorithm for High Occupancy Toll (HOT) Lane Operations
Page 84
Research Board, CD-ROM. Transportation Research Board, National Research Council, January 21-25, Washington, D.C., 2007.