which can usually be downloaded onto users' mobile devices (Kwon et al., 2013; .... influences the behavioral intention of mobile payment, which was analysed by ... conducted a study and revealed that PE has positive relation with BI to ...
262
Chapter 12
A SEM-Neural Network Approach for Predicting Antecedents of Factors Influencing Consumers’ Intent to Install Mobile Applications Yakup Akgül Alanya Alaaddin Keykubat University, Turkey
ABSTRACT This chapter explores the present gap in the literature regarding the acceptance of mobile applications by investigating the factors that affect users’ behavioral intention to use apps in Turkey. First, structural equation modeling (SEM) was used to determine which variables had significant influence on intention to install. In a second phase, the neural network model was used to rank the relative influence of significant predictors obtained from SEM. The results reveal that habit, performance expectancy, trust, social influence, and hedonic motivation affect the users’ behavioral intention to use apps.
INTRODUCTION Recently, people are progressively eager to adopt new technologies in their daily lives by accepting and using modern technologies is common habit, making technology, now more than ever become a part of our usual activities (Islam, Low and Hasan, 2013). As of May 2017, Apple’s App Market contained 2.2 million and Google’s DOI: 10.4018/978-1-5225-4029-8.ch012 Copyright © 2018, IGI Global. Copying or distributing in print or electronic forms without written permission of IGI Global is prohibited.
A SEM-Neural Network Approach for Predicting Antecedents
Google Play Market contained 2.8 million apps (Statista, 2017a). Consumers have downloaded apps at a astounding percentage. As of May 2017, Apple has had 140 billion total downloads from its market since its origination in 2016 (Statista, 2017b). In the firstquarter of 2016 alone, Google had an estimated 64 billion downloads and Apple had 100 million downloads (Android Authority, 2017). Mobile applications are designed to extend the capabilities of the mobile devices for mobile device operating systems, which end-user soft ware apps, (Purcell, 2011). Mobile applicatios are defined as software or programmes that are designed to perform specific tasks, which can usually be downloaded onto users’ mobile devices (Kwon et al., 2013; Mozeik et al., 2009; Wang et al., 2015). As well, users can install different kinds of mobile applications, such as game, music, shopping, bank payment applications and so forth, which are delivered by the third-party software providers (Grotnes, 2009; Islam, Islam and Mazumder, 2010; Taylor, Voelker and Pentina, 2011). By the installation of these applications, the functions of the mobile devices are expanded. The number of mobile apps has been rising, and this rise contributed to the arising range of consumer needs that are being served by mobile apps (Kim, Yoon & Han, 2014). Because of the disadvantages of websites due to their restrictive functionality, many companies provide mobile apps to the customers (Magrath and McCormick, 2013). Compared to mobile websites, mobile applications are preferred by consumers primarily because they are perceived as more convenient, faster and easier to browse (Mobile Apps: What Consumers Really Need and Want, 2016). Many recent works that have examined the factors involved in a consumer’s adoption of distinct mobile device services, such as mobile payments (Lu, Yang, Chau and Cao, 2011; Zhou, 2013), mobile banking (Chen, 2013), financial services (Chemingui and Ben lallouna, 2013), health services (Deng, Mo and Liu, 2014), mobile learning (Callum, Jeffrey and Kinshuk, 2014), mobile data services (Al-Debei & Al-Lozi, 2014) and mobile games (Jiang, Peng and Liu, 2015). Regardless, there have not been many works that have assessed the determinants that affect the installation of mobile apps on mobile devices in Turkey context. One of the main drawbacks of conventional statistical techniques used for the prediction of users’ behavior is that they usually examine only linear relations among variables. In order to overcome this issue, relative importance of significant variables will be determined using neural networks, capable to model complex non-linear relationships. The UTAUT2 model is adjusted version of Unified Theory of Acceptance and Use of Technology (UTAUT) model. The primary model is developed by Venkatesh, Moris, Davis, and Davis (2003), which has PE, EE, SI and FC constructs. HM, PV and HT factors have been added into UTAUT2 model. According to Venkatesh et al. (2012), UTAUT2 has the applicability from the context of organizational to a consumer usage.
263
A SEM-Neural Network Approach for Predicting Antecedents
While mobile phones or smartphones were found in 96.9% of the houses in April of 2016, fixed phone availability was 25.6%. In the same period, 22.9% of the dwellings were desktop computers, 36.4% portable, while tablet computers were 29.6%. In 2015, 20.9% of TVs with internet connection were calculated as 24.6% in 2016 (http://www.tuik.gov.tr/PreHaberBultenleri.do?id=21779 26.05.2017). Recently, mobile apps changed consumers’ consumption behavior significantly because of having ubiquity and portability. Smartphone users enable to receive and diffuse information much more quickly and easily based on these qualities than ever before (Islam et al., 2013). As Wang et al. (2015) maintain “Today’s mobile technologies are known to possess the capabilities to satisfy users’ entertainment and spontaneous needs, help fulfilling one’s efficiency desires, assist in making time-critical arrangements, and cater to mobility-related situational needs” (Wang, 2015: 5-6).
REVIEW OF THE LITERATURE Hypothesis Development The relationships between the eight independent variables (PE, EE, SI, FC, HM, PV, HT and TR) and the dependent variable (BI) are examined in the previous empirical studies.
Behavioral Intention (BI) Behavioral Intention (BI) is defined as a person’s perceived likelihood or “subjective probability that he or she will engage in a given behavior” (Homburg et al., 2005). Also, Islam et al. (2013), defined behavioural intention as an individual’s intention to carry out a given act, which can foresee coinciding behaviours when an individual performs deliberately. In addition, behavioural intention is the subjective possibility of carrying out behaviour and also the cause of certain usage behaviour (Yi et al., 2006). The willingness of an individual to carry out a particular behavior can be examined by his or her BI. In this book chapter, BI is used to describe how great the individuals’ appeal to adopt mobile applications. Zhang et al. (2012), indicated that BI is the most notable deterninant that determines individual’s existent behavior in TAM theory. Therefore, intentions show the motivational determinants that leverage behaviour and are indicators of how hard people are willing to try and the effort they put in to embark on a behaviour. Also, it was found that behavioural intention is to be the primary factor of individual mobile services usage and that usage intentions are rational indicators of future system use (Mafe et al., 2010). According to The Theory 264
A SEM-Neural Network Approach for Predicting Antecedents
of Reasoned Action (Fishbein and Ajzen, 1975), Technology Acceptance Model (Davis, 1989) and the Theory of Planned Behavior (Ajzen, 1991) and former works have validated that a consumer’s intentions are critical forecaster of a consumer’s actual behavior (Kim et al., 2008; Pavlou, 2003; Shin, 2009; Taylor and Todd, 1995; Venkatesh et al., 2003; Yang, 2013). In this study, a consumer’s intention to install an application is seen as a prominent predictor of actually installing the application.
Performance Expectancy (PE) “The degree to which using a technology will provide benefits to consumers in performing certain activities” is defined as Performance Expectancy (PE) (Venkatesh et al., 2012:159). Empirical studies of AbuShanab and Pearson (2007) that customers has high PE, which has high BI to use internet banking in Jordan, which evaluated using MLR. This is further supported by Shi (2009) indicated that PE has positive influence on BI to use smart phone online application software. Sun, Cao and You (2010) remarked that PU has a positive and significant effect on BI to use m-commerce in China, which evaluated using SEM. This result aligned with Leong et al. (2013b), found that PU has a positive and significant influence on BI to use m-credit card, which was analysed using SEM. These empirical studies expose that PE as a substantial determinant to influence the BI to adopt mobile technology. On the other hand, Im, Hong and Kang (2011) asserted that PE has insignificant effect on BI to adopt MP3 and internet banking, which indifferent in U.S. and Korea. Furthermore, Lin, Zimmer and Lee (2013) found that PE has positive affect on BI to adopt podcasting, in a Northeastern United States college, which evaluated using PLS. Oliveira, Faria and Thomas (2014) carried out a study, which proved that PE positively influences BI to adopt m-banking. In addition to, a recent emprical study conducted by Slade, Williams, Dwivedi and Piercy (2014) found out that PE positively influences the behavioral intention of mobile payment, which was analysed by regression analysis. And also, the same year Martins, Oliveira, and Popovič (2014) conducted a study and revealed that PE has positive relation with BI to adoption of internet banking in a Portugal University. According to Venkatesh et al. (2012) the consumers are the users of the technology in a consumer user context rather than in an organizational user context (Venkatesh et al., 2012). This study adopts this definition of Performance Expectancy and consumers. Moreover, apps enable the users to purchase goods and services, get expert tips regarding goods and services and browse anytime at anyplace (Morris, 2016). This factor is equivalent to Perceived Usefulness (PU) in the Technology Acceptance Model (TAM) (Venkatesh et al., 2003). In previous studies, PE has been proved to significantly affect the consumer behavioral intention in the context of m-commerce (Chong, 2013b), mobile internet (Venkatesh et al., 2012). Thus, the following hypothesis is proposed: 265
A SEM-Neural Network Approach for Predicting Antecedents
H1: Performance expectancy affects the behavioral intention to use mobile apps.
Effort Expectancy (EE) Effort expectancy (EE) is defined as is “the degree of ease/effort associated with consumers’ use of the technology” (Venkatesh et al., 2012:159). Effort expectancy EE is the degree to which a technology is easy to use (Jambulingam, 2013). Moreover, Effort Expectancy is equal to Perceived Ease of Use in Technology Acceptance Model (TAM) (Venkatesh et al., 2003). AlAwadhi and Morris (2008) carried out a study that revealed EE and BI has a positive relationship to employ e-government services in Kuwait. On the other hand, Wu, Tao and Yang (2007) indicated that EE has insignificant effect on the BI to adopt 3G services in Taiwan. Besides, the study of Yang (2010) showed that EE insignificantly influences the attitude of US consumer to use m-shopping services, which validated using SEM. Differently, Tan, Sim, Ooi and Phusavat (2011) verified that PEU has a significant influence on the BI to adopt m-learning by using the multiple regression in Perak, Malaysia. EE has positive influence on the BI to adopt the technology, which has similar results from these empirical studies. In addition, Im, Hong, and Kang (2011) found that EE has positive influence on BI to adopt MP3 players and internet banking usage in Korea and U.S. and, which analysed by using covariance SEM. Teo and Noyes (2012) found that EE has a significant influence on the individual BI to use information technology by using SEM approach in the among Singapore trainee teachers. Chang (2013) found out that EE has positive effect on the BI to use library mobile applications in the eastern Taiwan, which analysed by SEM. The same year, Tai and Ku (2013) validated that EE has a significant positive effect on the intention of adopting for mobile stock trading for stock investors in Taiwan. Besides that, Alharbi and Drew (2014) found that EE has positive affection on the BI to employ m-learning system in Griffith University. In addition to that, a recent study conducted by Teo, Tan, Ooi, Hew and Yew (2015) provided evidence that EE has a positive influence on BI for utilization of m-payment in Malaysia. Effort expectancy has been a compulsory factor in previous studies on the technology acceptance, where the degree of the ease of use of the technology system affected significantly the behavioral intention of various technologies, such as 3G (Liao, Tsou and Huang, 2007), wireless internet (Lu, Yu, Liu and Yao, 2003), electronic commerce (Ha and Stoel, 2009) and m-commerce (Chong, 2013). Therefore, the following hypothesis is proposed: H2: Effort expectancy affects the behavioral intention to use mobile apps.
266
A SEM-Neural Network Approach for Predicting Antecedents
Social Influence (SI) Social Influence (SI) cites to “the consumers perceive that important others (e.g. family and friends) believe that they should use a particular technology” (Venkatesh et al, 2012:157-178). Lu, Yao and Yu (2005) showed that SI negatively influences the BI to use wireless internet services among university students in Texas. Akour (2009) found that the most influential factor of m-learning acceptance in tertiary education, which extrinsic effect of freshman students in Oklahoma State University. Taylor et al. (2011), found that students’ adoption and usage of mobile apps is strongly effected by their friends compared to family members in U.S. Midwest universities, which tested using logistic regression models. Also, Yu (2012) emphasized that SI has positive influences to adopt m-banking in major Taipei downtown areas and, which evaluated using PLS regression. Beside this, Chong, Chan, and Ooi (2012) showed that SI was the determinant of BI to employ mobile commerce. Jaradat and Rababaa (2013) indicated that SI positively influences the users’ BI on m-commerce adoption and usage in Jordan public university students. The same year, Alwahaishi and Snasel (2013) validated that SI has a positive influence on BI to use of mobile internet in Saudi Arabia. Furthermore, Leong et al. (2013a) proved that SI has a crucial function in influencing the BI to use m-entertainment. Differently, Yang (2013) found that subjective norm does not influence the intention to use mobile apps among college students in Southeast America by using multiple regression analyses. A recent study conducted by Jawad and Hassan (2015), SI has a positive relation on BI to adoption mobile learning by using regression model. Moreover, SI is equivalent to subjective norm in the Theory of Reason Action and Theory of Planned Behavior, where it is an important factor that affects the adoption of a system (Venkatesh et al., 2003). Likewise since m-shopping fashion apps are not a mandatory technology, in the sense that the consumers have the free choice to use them, social influence has the potential to affect the behavioral intention to use m-shopping fashion apps. Chong (2013) found that SI is a significant determinant of the consumers’ behavioral intention to use m-commerce, and that social influence affects the consumer’s intention to use mcommerce in Malaysia. Hence, the following hypothesis is proposed: H3: Social influence affects the behavioral intention to use mobile apps.
Facilitating Conditions (FC) Facilitating Conditions (FC) is defined as “the consumers” perceptions of the resources and support available to perform a behavior” (Venkatesh at al., 2012: 159). Wu et al. (2007) found that FC significantly effects the behavioural intention for 3G mobile 267
A SEM-Neural Network Approach for Predicting Antecedents
telecommunication services. Zhou (2008) found that FC will positively influence BI to adopt m-commerce in China. Yang (2010) showed that FC is positively related to BI to use mobile shopping services in U.S. This result is in line with the findings Yeoh and Chan (2011), indicated that FC has positive and significant impact on BI for internet banking adoption by using MLR. Regardless, Teo et al. (2012) indicated that FC has no positive and significant effect on the BI to use technology. And also, Jambulingam (2013) found that FC has no positive and significant influence on BI to influence m-learning adoption. In addition to that, Thomas, Singh, and Gaffar (2013) also found that FC is positively related to BI to adopt m-learning in University of Guyana. Also, Chong (2013a) found that FC has positive relationship with BI to adopt m-commerce in China by using MLR. Chong (2013) applied the UTAUT model in order to investigate the mcommerce adoption, and the study found that facilitating conditions had a significant influence on the user behavior intention to use m-commerce. Facilitating conditions in the context of m-shopping fashion apps relates to online supports and helps, m-devices, internet connection, and so forth (Hew et al., 2015; Magrath and McCormick, 2013). If the consumers have the necessary support and resources, they will have the intention to use a technology (Venkatesh et al., 2012). Hence, the following hypothesis is proposed: H4: Facilitating conditions affect the behavioral intention to use mobile apps.
Hedonic Motivation (HM) Hedonic Motivation (HM) is defined as “the pleasure or enjoyment derived from using a new technology” (Venkatesh et al., 2012:161). HM plays a vital role in predicting the intentions for technology use (Venkatesh et al., 2012). Hedonic Motivation has been shown to be an important factor in determining the acceptance of technology in previous technology acceptance studies. HM is the fun or pleasure derived from using a technology (Brown and Venkatesh, 2005). To, Liao and Lin (2007) found that hedonic attitudes directly influences the intention to search but an indirectly influence the intention to purchase in Taiwan. Magni, Taylor and Venkatesh (2010) hedonic factors influence individual’s intentions to explore a technology, but the influences differ across stages of technology adoption in U.S. The same year, Yang (2010) found that hedonic aspects are crucial factors of consumer to use of m-shopping services. Escobar-Rodrίguez and Carvajal-Trujillo (2013), found that HM has a positive impact on BI to purchase online airline ticket in Spain by using questionnaires and, which analyzed by using SEM. Also, the same year Raman and Don (2013) conducted a study on undergraduates’ students in University Utara Malaysia. The results indicated that HM and BI has a positive relationship to adopt Learning Management System. Nonetheless, Lewis et al. (2013) found that 268
A SEM-Neural Network Approach for Predicting Antecedents
HM has not positive influence the intention to use classroom technology in the United States of America. A recent study conducted by Bere (2014) has found that HM has a positive relationship with BI to employ m-learning in South Africa and which analysed multiple regression. The same year, Harsono and Suryana (2014) conducted a study on college students in Bandung. The results showed that HM has positive influence on the BI to use social media. In addition to that, Alalwan, Dwivedi and Williams (2014) studied on Jordanian banking customers. The results verified that HM has a positive impact on the consumers’ intention and use of internet banking in Jordan. Moreover, if a technology creates pleasure and fun while the user is using it, users are able to gain enjoyment, which influences their behavioral intention to pursue the technology (Lee, 2009). Venkatesh et al. (2012) proved HM as a significant factor that affects the behavioral intention to use mobile internet in a consumer context. Similarly in an m-shopping service context in a study by Yang (2010) it was concluded that hedonic factors are critical determinants of the m-shopping consumer usage, and that hedonic performance expectancy is gained by the users thought the fun obtained by using various features and functions in m-shopping technology. Hence, the following hypothesis is proposed: H5: Hedonic motivation affects the behavioral intention to use mobile apps.
Price Value (PV) Price Value (PV) refers to “consumers” cognitive trade off between the perceived benefits of the applications and the monetary cost of using them” (Dodds et al., 1991: 307-319). Venkatesh et al. (2012) highlights that PV in consumer decision making regarding technology use is an important factor influencing BI which is tested using PLS. Moreover, Munnukka (2004) indicated that PV has an influence on consumer use of mobile services in Finland. Toh et al., (2009) showed that perceived cost negatively impacts the intention to use m-commerce among Malaysian users. Prata, Moraes and Quaresma (2012) found out that mobile apps price is the main reason to buy an app in Brazil. Nonetheless, Chong (2013b) conducted a study regarding the cost that impacts the intention to adopt m-commerce among users in China. Yang (2013) showed that PV has a positive influence on BI to adopt mobile learning of undergraduate students in China. Furthermore, Xu s’ (2014) study carried out a study and the resultd verified that PV has positive impact on users’ continuance intention in online gaming in China. In addition to that, Dhulla and Mathur (2014) also found that PV has positive influence on BI to adopt cloud computing in Mumbai. Apart from that, a recent study conducted by Arenas-Gaitán, Peral-Peral, and RamónJerónimo (2015) also showed that PV has a positive impact on BI to accept internet banking in the south of Spain. This finding is consistent with the research done by 269
A SEM-Neural Network Approach for Predicting Antecedents
Unyolo (2012) found that PV has a positive impact on BI to adopt mobile money. When it comes to the consumer use setting the main difference is that consumers are the ones who bear the monetary costs of the use of a technology. Therefore, as the technology is not provided for free by the organization unlike in the organizational use context, the cost of using the technology and pricing structure have significant impact on consumers’ technology use (Venkatesh et al., 2012). M-shopping fashion apps are mostly free to download as vendors of fashion products aim to attract more and more consumers to use the mobile shopping app and hence make purchases. Other costs for using mshopping fashion apps are the cost of the internet, mobile device, mobile device maintenance (Wei et al., 2009). Price value in our study is defined as the as consumers’ cognitive trade-off between the perceived benefits of the mobile shopping fashion applications and the monetary cost for using them (Dodds et al., 1991; Venkatesh et al., 2012). The price value can be positive or negative; depending if the perceived benefits exceed the monetary costs of using the technology (Venkatesh et al., 2012). Hence, the following hypothesis is proposed: H6: Price value affects the behavioral intention to use mobile apps.
Habit (HT) Habit (HT) refers “the extent to which people tend to perform behaviors automatically because of learning” (Limayem et al., 2007:705-737). Venkatesh et al., (2012) indicated that habit has direct and indirect impacts on BI to use technology. Liao, Palvia and Lin (2006) conducted a study in Taiwan and found that habit has influence the continuance intention to use e-commerce. Liao et al., (2011b) utilised UTAUT2 research model and reported that HT was one of the determinants that has positive relationship on BI to use web portals. As well as, Pahnila, Siponen and Zheng (2011) indicated that habit has an impact on the use of Tao Bao in University of Shanghai, China. As well as, HT has been verified by Chong and Ngai (2013) found that HT has positive impact on BI to adopt location-based social media for travel planning in various mobile phone shops in China’s shopping mall and, which analyzed using PLS regression. The same year, Lewis et al. (2013) HT has a positive impact on BI to use technology in higher education classrooms in the United States and which was validated using Smart-PLS. Likewise, Oechslein, Fleischmann and Hess (2014) found that HT has a positive impact on BI to accept social recommender systems at German university. According to a recent empirical study conducted by Wong et al., (2014) indiacated that HT has a positive impact on BI to adopt mobile TV in Malaysia and, which was examined using PLS. In previous studies, habit has been defined as the extent that individuals tend to execute behaviors automatically because of learning (Venkatesh et al., 2012; 270
A SEM-Neural Network Approach for Predicting Antecedents
Limayem, Hirt & Cheung, 2007). In accordance with this definition we define habit, as the extent that individuals tent to use m-shopping fashion apps automatically. With increased experience in using a technology, the users start using the technology habitually (Venkatesh et al., 2012). Furthermore habit can predict one’s future behavior and people are more likely to have a good intention to perform acts they have performed often in the past (Ouellette & Wood, 1998). When habit is present people tend to rely more on habit compared to other external information and choice strategies (Gefen, 2003). Moreover, Venkatesh et al., (2012) found that habit affects the behavioral intention to use technology. Also, in a study conducted by Liao, Palvia and Lin (2006), it was found that habit influences the user’s intention to continue to use e-commerce. When a behavior has been done many times in the past, future behavior becomes automatic (Aarts, Verplanken & Knippenberg, 1998). Therefore, once the users have been using the app, this action becomes a routine and habit which influences the individuals to use the apps. Hence, the following hypothesis is proposed: H7: Habit affects the behavioral intention to use mobile apps.
Trust (TR) It has been validated that trust is a critical determinant to influence users’ decisions in uncertain environments (Pavlou, 2003). Studies have also showed that trust has no positive impact on perceived risk (Hong, 2015; Kim et al., 2008; Liao, Liu, & Chen, 2011a; Pavlou,2003). Mobile apps is a much newer technology, compared to mobile websites and ecommerce, and shopping via mobile apps for products and services are recent trend, therefore users of mobile apps are exposed to new vulnerabilities and risks (Joubert and Belle, 2013; Magrath & McComick, 2013). Moreover, because personal information is being stored on users’ mobile apps in order to make the purchase of the goods and services possible, the risks of privacy and security are quite high. Asymmetric information regarding the product and services purchased by the user of the app and the vendor of the product ans service are present, because the user cannot physically try and see the goods and services (Eliasson et al., 2009). Several studies have also showed that trust has a positive relationship between the decision to repurchase from an online vendor (Hong and Cha, 2013; Hsu, Chang and Chuang, 2015; Kwahk and Park, 2012; Pavlou and Gefen, 2004; Roca et al., 2009; Shin et al., 2013). Likewise in an mobile shopping context there is lack of physical interaction between in our case the vendor of the products and services and the user of the mobile app; the user of the app has the risk regarding personal information stored and accessible by the app, therefore users need to have trust in order to have intend to use the apps (Chong et al., 2010; Vasileiadis, 271
A SEM-Neural Network Approach for Predicting Antecedents
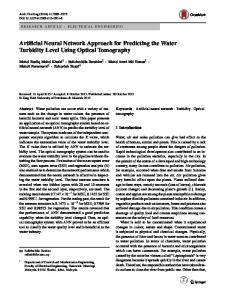
2014; Wei et al., 2009). Moreover, in a study by Luarn and Lin (2005) on mobile banking acceptance, it was found that issues related to security and privacy have more significant influence than the original TAM factors of perceived usefulness and perceived ease of use of the technology system. Research done in the context of online shopping by applying TAM, for example, Gefen, Karahanna and Straub (2003) showed that consumer trust in the m-vendor affects their intentions to use mobile commerce; as trust significantly reduces the perception of risk which a consumer faces in the online commerce context. Furthermore trust in the mobile vendors was found to affect the behavioral intention to use m-shopping, as the more trust the consumer has in the m-vendors, the more it is willing to use m-shopping (Groß, 2015b). In mobile shopping studies trust most often refers to the customer and mobile vendors relationships, and is defined as the consumer’s “willingness to rely on an Exchange partner in whom one has confidence” (Groß, 2015b: 220; Moorman, Deshpande and Zaltman 1993: 82), and in our case mobile vendors, “including beliefs about their ability, competence, integrity and benevolence” (Groß, 2015b: 220; Lin and Wang, 2006). In consistence with previous studies, we adopt this definition of Trust (trust in the mobile vendors). Kim and Yoon (2013) utilized TAM and the results showed that perceived information usefulness, perceived entertaining usefulness, and perceived ease of use all had significant impact on attitude toward app usage, which in turn had a significant influence on behavioral intention to use apps. Another recent study done by Hew and Lee (2015) also examined the behavioral intention to use mobile apps, utilized the Unified Theory of Acceptance and Use of Technology 2 (UTAUT2). The researchers indicated that all of the dimensions except price value and social influence were significantly related to behavioral intention to use mobile apps. Only one study, Shen (2015), examined perceived risk. Therefore, our theoretical model and related study uniquely contributes to the known body of work. Based on the above, we propose the following hypotheses (see Figure 1): The following hypothesis is proposed: H8: Trust affects the behavioral intention to use mobile apps. Figure 1 demonstrates the proposed conceptual framework of this research.
RESEARCH METHOD Measures of the Constructs A survey instrument was constructed by adapting measures from prior research to ensure the content validity of the scales. The measurement of performance expectancy adapted from the scale developed by Venkatesh et al.(2012), Venkatesh et al.(2003), 272
A SEM-Neural Network Approach for Predicting Antecedents
Figure 1. UTAUT2 model
Mallat et al., 2009, Hövels 2010 and Leong et al. (2013), effort expectancy adapted from the scale developed by Venkatesh et al.(2012), Venkatesh et al.(2003) and Davis et al. (1989), Social Influence adapted from the scale developed by Venkatesh et al. (2012), Moore and Benbasat (1991) Venkatesh and Davis (1991) Leong et al. (2013) and Yang (2010), Facilitating Conditions adapted from the scale developed by Venkatesh et al. (2012) and Venkatesh et al. (2003), Hedonic Motivation adapted from the scale developed by Venkatesh et al. (2012), Yang (2013) and To et al. (2007), Price Value adapted from the scale developed by Venkatesh et al. (2012) and Prata et al. (2012), Habit adapted from the scale developed by Venkatesh et al. (2012) and Verplanken & Orbell (2003), Trust adapted from the scale developed by (Groß, 2015b), Behavioural Intention adapted from the scale developed by Venkatesh et al.(2012), Venkatesh et al. (2003), Davis (1989) and Akour (2009). Thirty questionnaires were distributed to bank customers who have experienced using internet banking in Turkey, and minor changes to the scales were made accordingly to ensure that the questions were not repetitive. Pilot test respondents were not used in the further analysis. The descriptive statistics of the sample showed that females account for 51.1 and males 48.9 percent of respondents. The percent of 28.6 was in the age group 18-24 years, 49.8 percent of respondents were between 25-34 years of age, 19 percent of respondents were between 35-44 years of age and 2.2 percent was in the age group 45-54 years of age. In this context, younger generation prefers to use internet banking services compared to older age groups (35 years old above). In addition, majority 273
A SEM-Neural Network Approach for Predicting Antecedents
respondents claimed that they use mobile applications for three to six years (46.1 percent), followed by more than six years (42 percent) and less than three years (11.9). The majority of respondents were bachelor degree and represented (37.5%), followed by master degree (22.7 percent), Ph.D. degree (10 percent), vocational school degree (12.6 percent), high school degree (16.4 percent) and other education level (0.7 percent). Majority respondents claimed that they use android (72.9 percent), followed IOS (23.4 percent), windows (3.3 percent) and the other (0.4 percent). Finally, the survey instrument used in this study consisted of a total of 43 items related to the nine constructs of the research model. The items were measured using a five-point Likert-type scale for all constructs. To ensure the content validity of the instrument, all construct measures were adapted from their original source and slightly modified to fit the technology context studied. The validation of the survey instrument was done by experts from the field of information technology as well as web and application developers.
DATA COLLECTION PROCESS To reach mobile application users, a Web-based survey was used. A snowball sampling method was applied. A total of 343 surveys were collected from the participants, of which 269 were found to be usable in the data analysis.
Method of Measurement and Structural Model Analysis PLS, which is known as a variance-based SEM, provides tremendous advantages in marketing and consumer behavior studies (Henseler et al., 2009; Henseler, 2010; Hair et al., 2011; Henseler et al., 2012; Reinartz et al., 2009; Roldán & SánchezFranco, 2012; Sarstedt, 2008), and helps to understand the relations among the sets of observed variables (Hair et al., 2012; Rigdon et al., 2010). Thus, using SmartPLS software 2.0 (M3) (Chin, 1998b; Ringle, Wende, & Becker, 2014; Tenenhaus et al, 2005; Wetzels et al., 2009; Chin and Newsted 1999; Ringle et al., 2005b), the PLS algorithm, bootstrapping and blindfolding procedure were performed in this study to assess the measurement and structural model. The analysis should be carried out on the basis of the path weighting scheme (Henseler et al., 2012; Henseler et al., 2009). This study uses recent guidelines provided by Chin (2010), Gil-Garcia (2008), and others (Hair et al., 2011; Hair et al., 2012a, Hair et al., 2012b; Hair et al., 2012c; Hair et al., 2013a; Hair et al., 2013b). According to Chin (2010), and Henseler and Chin (2010) the first step in evaluating SEM is the measurement model, and, secondly, the structural model results (the two-stage approach). The PLS path modeling algorithm presents the outer and the 274
A SEM-Neural Network Approach for Predicting Antecedents
inner estimation stages (Hair et al., 2013; Vinzi et al., 2010). According to Ringle et al. (2010), non-parametric assessment criteria, such as construct reliability (> 0.6), outer loadings (> 0.7), indicator reliability (> 0.5), and average variance extracted (> 0.5), must satisfy the minimum requirements. For measurement assessment, construct validity is defined as “the extent to which an operationalization measures the concept it is supposed to measure” (Bagozzi and Yi, 1988; Bagozzi et al., 1991: 421). The construct validity is the extent to which a set of items in an instrument represents the construct to be measured. If the measurement model shows an acceptable level of model fit, then it is an evidence for the availability of construct validity (Hair et al., 2014). Furthermore, the structural model would assess the R2 measures and the level and significance of the path coefficients by performing the bootstrapping procedure of 5000 resamples (Chin, 1998b; Croteau and Bergeron, 2001; Gil-Garcia, 2008; Hair et al., 2011). First, researchers should check the sign, magnitude, and significance of each path coefficient, all of which should be consistent with theory. To evaluate the predictive power of the research model, researchers should examine the explained variance (R2) of the endogenous constructs. Using R2 to assess the structural model is consistent with the objective of PLS to maximize variance explained in the endogenous variables. The literature suggests that R2 values of 0.67, 0.33, and 0.19 are substantial, moderate, and weak, respectively (Chin, 1998b). The path coefficients of the PLS structural model have been measured, and bootstrap analysis was performed to assess the statistical significance of the path coefficients. The path coefficients have standardized values between -1 and +1. The estimated path coefficients which are close to +1 represent strong positive linear relationship and vice versa for negative values (Hair et al., 2013). Collectively, the R2 in the research model is fit based on the study context, and the path coefficients (beta and significance) specify the significance level of acceptance of the research hypotheses (Chin, 1998b). Data analysis utilized a two-step approach as recommended by Anderson and Gerbing (1988). The first step involves the analysis of the measurement model, while the second step tests the structural relationships among the latent constructs. The aim of the two-step approach is to establish the reliability and validity of the measures before assessing the structural relationship of the model. Secondly, the significance of the path coefficients, thirdly, the level of the R2 values, fourthly, f2 effect size, and, thirdy, the predictive relevance including Q2 and q2 effect size were assessed. In the final step, using neural networks, we have verified the strength of the effect of independent variables on dependent variables whose significance was determined by SEM analysis. Data analysis was conducted in the Statistical Package for Social Sciences (SPSS 24) and SmartPLS software 2.0 (M3). The internal consistency reliability was evaluated by using both Cronbach’s alpha and composite reliability. According to Table 1, the internal consistency reliability 275
A SEM-Neural Network Approach for Predicting Antecedents
Table 1. Evaluation of the reflective measurement model LC
Range of Factor Loadings
Number of Items
CRa
Ab
AVEc
Inter-Construct Correlationsd
BI
0,8380,941
5
0,95
0,94
0,81
1
EE
0,7560,848
5
0,91
0,87
0,66
0,53
1
FC
0,5530,869
5
0,87
0,80
0,57
0,55
0,66
1
HM
0,8340,934
3
0,92
0,88
0,80
0,59
0,60
0,60
1
Habit
0,7450,873
5
0,90
0,87
0,65
0,70
0,47
0,48
0,50
1
PE
0,7270,874
7
0,92
0,89
0,61
0,64
0,66
0,67
0,59
0,47
1
PV
0,7360,905
3
0,84
0,72
0,64
0,39
0,30
0,28
0,31
0,29
0,29
1
SI
0,6150,890
5
0,89
0,85
0,63
0,41
0,21
0,18
0,32
0,34
0,26
0,34
1
TRust
0,8270,894
5
0,93
0,91
0,74
0,40
0,19
0,11
0,27
0,32
0,15
0,48
0,40
BI
EE
FC
HM
Habit
PE
PV
SI
TRust
1
CR, composite reliability. , Cronbach’s alpha. c AVE, average variance extracted. d The square roots of the constructs’ AVE values are shown in the diagonal line; non-diagonal elements are latent variable correlations. c Average variance extracted (AVE)=(summation of the square of the factor loadings)/{(summation of the square of the factor loadings)+(summation of the error variances)}. a Composite reliability (CR)=(square of the summation of the factor loadings)/{(square of the summation of the factor loadings)+(square of the summation of the error variances)}. a
b
is verified because each latent construct clearly exceeds the minimum recommended level of 0.70 for composite reliability (Bagozzi and Yi, 1988) and Cronbach’s alpha (Nunnally and Bernstein, 1994), respectively. Convergent validity was estimated by using the average variance extracted (AVE). The values of each latent construct are above the suggested AVE value of 0.5, indicating a sufficient degree of convergent validity. Finally, the criterion by Fornell and Larcker (1981) is applied to evaluate discriminant validity. The square roots of all AVE scores (see diagonal elements in Table 1) are significantly larger than any other correlation coefficients among each construct, indicating good discriminant validity. Further support for discriminant validity can be derived from the fact that all of the indicator’s loadings are higher than all of its cross-loadings. Hence, all relevant criteria met the requirements for testing the structure model.
276
A SEM-Neural Network Approach for Predicting Antecedents
Table 2. Results of hypothesis testing and predictable power Hypotheses and Path
𝛃 Path Coef.
t-Valuea
Effect Size1 f2
R2
Effect Size2 q2
Q2
H1 PE -> BI
0,310800
4,83***
0,127273
0,670
0,069915
0,533
H2 EE -> BI
-0,011392
0,18
0
0
H3 SI -> BI
0,082181
1,96**
0,015152
0,006356
H4 FC -> BI
0,033698
0,48
0,00303
-0,00214
H5 HM -> BI
0,118854
1,90*
0,021212
0,012847966
H6 PV -> BI
0,056581
1,31
0,009091
0
H7 Habit -> BI
0,392887
7,64***
0,284848
0,164882227
H8 TRust -> BI
0,134588
2,77***
0,036364
0,019271949
t-values for two-tailed test: * 1.65 (sig. level 10%). ** 1.96 (sig. level=5%). *** t-value 2.58 (sig. level = 1%) (Hair et al., 2011). Notes: ***p