ESANN'1999 proceedings - European Symposium on Artificial Neural Networks. Bruges (Belgium), 21-23 April 1999, D-Facto public., ISBN 2-600049-9-X, pp.
ESANN'1999 proceedings - European Symposium on Artificial Neural Networks Bruges (Belgium), 21-23 April 1999, D-Facto public., ISBN 2-600049-9-X, pp. 99-104
A Simple Associative Neural Network for Producing Spatially Homogenous Spectral Abundance Interpretations of Hyperspectral Imagery Neil Pendock Department of Computational and Applied Mathematics, University of the Witwatersrand, Johannesburg, South Africa
Abstract.
A hyperspectral remotely sensed image may be modeled as a linear mixture of the spectral responses of unknown spectral endmembers. Using the a-priori information that the unknown spectral abundance images should be spatially homogenous, a simple associative neural network may be trained using Hebbian learning to extract spectral endmembers and corresponding abundance images from a hyperspectral image. The technique is applied to an AVIRIS image of Cuprite, Nevada and is compared to an interactive technique for approximating the spectral convex hull of a hyperspectral image that requires a-priori geological knowledge to identify spectral endmembers.
1. Introduction The spectral mixing model is the most successful algorithmic approach to date for the interpretation of hyperspectral imagery [1]. The main idea is to decompose the image into a product of mixing abundances of a library of spectral endmembers image = library � abundances (1) We call this approach a spectral factorization of the image. In the same way that any integer may be decomposed into a product of prime numbers, so can an image be decomposed into the sum of responses of spectral endmembers. The spectral analogue of a prime number is an endmember spectrum and an image may be interpreted by looking at images of the spectral abundances of each library spectrum. In the model described above, the spectral library is a collection of endmember spectra. There are two main ways to nd a spectral library given an image: � The endmember spectra are image pixels � The endmember spectra are a synthesis of image pixels
ESANN'1999 proceedings - European Symposium on Artificial Neural Networks Bruges (Belgium), 21-23 April 1999, D-Facto public., ISBN 2-600049-9-X, pp. 99-104
2. Endmember spectra as image pixels To nd endmember pixels in an image, we choose a large random sample of image spectra. All these spectra fall within the convex hull of the data, the vertices of which are candidate spectral endmembers in that any spectrum in the interior of the hull is by de nition a non-negative linear combination of convex hull vertices. To estimate the vertices of the convex hull, we compute many random 1-dimensional projections of the sampled spectra. We record how many times the projection of a particular spectrum is extremal (i.e. has either the smallest of largest projection value). Extremal projected spectra are candidate endmembers and may then be examined by an expert and a spectral library selected. For more details see [2]. There are several pros and cons to this approach:
2.1. Pros
A particular endmember spectrum may be located in the image and visited. This aids in identi cation of the spectral endmember.
2.2. Cons
1. How many spectral endmembers should we nd? This is a crucial question. Too many and we either model noise in the data and/or split a feature into a mixture of two or more other endmembers. This will obviously confuse the interpretation. Too few and we may not be able to discriminate the features of interest. 2. There is a practical limitation in the number of endmembers available for an image. Endmembers form a basis for an n-dimensional vector space, where n is the number of spectral bands in the image. A fundamental rule from linear algebra limits the number of linearly independent vectors in an n-dimensional vector space to n, i.e. there is an upper bound of the number of spectral bands for any one spectrum of a hyperspectral image. This is not much of a problem for AVIRIS images which have many hundreds of spectral bands, but may be an issue for airborne or satellite systems with tens of spectral bands. 3. Endmember spectra should ideally be pure and not mixtures themselves. This is not always the case, particularly in heavily vegetated scenes. Each image pixel will be a combination of vegetation and other spectra. 4. The procedure is crucially dependent on how well the random sample of image spectra represents the image - if the target is a spatially small feature and is not sampled, it cannot become an endmember spectrum. 5. The algorithm outlined above is susceptible to noise - a noisy pixel may become an endmember and any noise present in a spectrum is retained in the spectral library.
ESANN'1999 proceedings - European Symposium on Artificial Neural Networks Bruges (Belgium), 21-23 April 1999, D-Facto public., ISBN 2-600049-9-X, pp. 99-104
All the above problems may be overcome. Noisy endmembers may be identi ed by computing their abundance in the image. If the abundance images have a salt and pepper appearance, the endmember may be removed from the library. The size of the random sample may be increased or the procedure repeated several times with di�erent random samples to increase the con dence of detecting small features. Spectrally pure endmembers may be extracted from a spectral library by modifying endmember spectra to minimize the unmixing error.
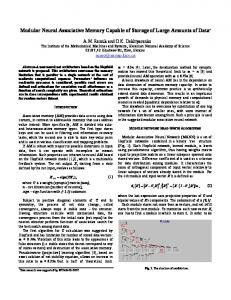
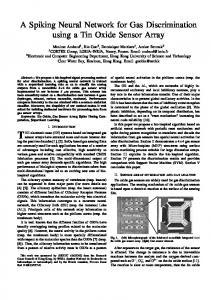
3. Cuprite case study The AVIRIS image used in this study is available on the Envi 3.1 Tutorials & Data CD-ROM from Research Systems Inc, is a 50-band SWIRII [2000nm - 2500nm] subset of satellite data over Cuprite, Nevada. The image has 400 columns and 350 rows and 16 bit precision. Spectral band twenty ve (2230nm) is shown as Figure 1. Figure 1: Aviris 2230nm image of Cuprite
50
100
150
200
250
300
350
50
100
150
200
250
300
350
400
This piece of geological real estate has become something of a standard image for evaluating multi- and hyperspectral processing algorithms [1][4].
ESANN'1999 proceedings - European Symposium on Artificial Neural Networks Bruges (Belgium), 21-23 April 1999, D-Facto public., ISBN 2-600049-9-X, pp. 99-104
4. Endmember spectra as combinations of image spectra An alternate mechanism for estimating spectral endmembers from a hyperspectral image is to consider the images of spectral abundances. Returning to our simple linear mixing model (1) we can express it in the notation of linear algebra as d = Sx where d is an image spectrum, S a library of spectral endmembers and x the spectral abundances. We have d but do not know either S or x. From looking at geological maps and our own observations, we know that the spectral abundance image sx corresponding to a single endmember spectrum s should be spatially concentrated - the abundance image should be blobby. If we choose a measure of blobiness for an image, we can look for a linear combination of the spectra d with weights w1 such that w1T d is blobby. If we remove the contribution of this abundance image to the data, we may then search for a second linear combination w2 such that w2T d is blobby. Repeating this process, we construct a matrix W such that Wd is as blobby as possible. Our spectral library S is then simply the pseudoinverse of W .
4.1. Estimation of w1
We shall constrain w1 to have unit norm as our mixing model d = Sx and equivalent unmixing model Wd = x is invariant to multiplication by a scalar. Choosing w1 randomly, we may compute an abundance image w1T D where D is the hyperspectral image consisting of individual spectra d. To measure the spatial homogeneity of w1T D, we convolve it with a Gaussian convolution kernel of a speci c size. The larger the kernel, the larger the scale of the spatial homogeneity which will be measured. The norm of the convolved image is a measure of the spatial homogeneity. We update w1 by an amount proportional to w1 using Hebbian learning [3]. The updated weights are then re-normalized.
4.2. Estimation of w2
With w1 estimated, we may remove its e�ect from the image D by replacing D with D , w1 w1T D. w2 may be computed from the residual image in a fashion analogous to the estimation of w1 .
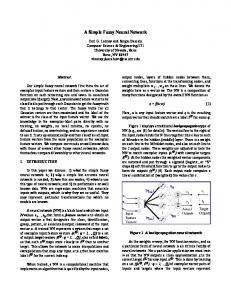
5. Example We computed 20 spatially concentrated spectral abundance images for the Cuprite Aviris image described above. The spatial concentration measures for each of the images are plotted as Figure 2.
ESANN'1999 proceedings - European Symposium on Artificial Neural Networks Bruges (Belgium), 21-23 April 1999, D-Facto public., ISBN 2-600049-9-X, pp. 99-104
Figure 2: Cuprite abundance smoothness
380
360
340
Smoothness
320
300
280
260
240
220
0
2
4
6
8
10 12 Abundance image
14
16
18
20
From an analysis of the above plot, we conclude that there are roughly 12 distinct spectral endmembers. The corresponding endmember spectra for the smoothest (endmember 1) and roughest (endmember 20) are plotted as Figures 3 & 4 and the corresponding spectral abundance images are plotted as Figures 5 & 6. Figure 3 : Smoothest endmember 15
10
5
0 2
2.05
2.1
2.15
2.2
2.25
2.3
2.35
2.4
2.45
2.35
2.4
2.45
Figure 4 : Roughest endmember 5 4 3 2 1 0 2
2.05
2.1
2.15
2.2
2.25
2.3
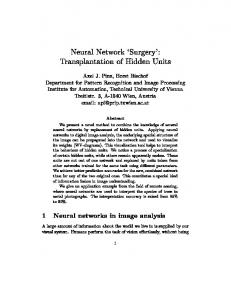
Comparing the abundance images to the geological map above we conclude that the smoothest abundance image corresponds to kaolinite, while the roughest image is clearly noise. Using the interactive convex hull estimation technique described above, the authors succeeded in identifying 11 spectral endmembers. These endmembers agree remarkably well with the endmembers extracted by the associative network.
ESANN'1999 proceedings - European Symposium on Artificial Neural Networks Bruges (Belgium), 21-23 April 1999, D-Facto public., ISBN 2-600049-9-X, pp. 99-104
Figure 5 : Abundances of smoothest endmember
50
100
150
200
250
300
350 50
100
150
200
250
300
350
400
350
400
Figure 6 : Abundances of roughest endmember
50
100
150
200
250
300
350 50
100
150
200
250
300
6. Conclusions Spectral endmembers may be quickly and automatically extracted from a hyperspectral image by estimating linear combinations of the data which are spatially homogenous. Good agreement is demonstrated with an interactive endmember selection technique. A simple associative neural network with Hebbian learning may be used to estimate the various linear combinations.
References [1] Abrams, M. J., Ashley, R. P., Rowan, L. C., Goetz, A. F. H., and Kahle, A.B., 1978, Mapping of hydrothermal alteration in the Cuprite Mining District, Nevada using aircraft scanner images for the spectral region 0.46 - 2.36 mm: Geology, v. 5., p. 173 -718. [2] Boardman, J. W., Kruse, F. A., and Green, R. O., 1995, Mapping target signatures via partial unmixing of AVIRIS data: in Summaries, Fifth JPL Airborne Earth Science Workshop, JPL Publication 95-1, v. 1, p. 23-26. [3] Hebb, D. O., 1949, The Organization of Behaviour, Wiley. [4] Kruse, F. A., Kierein-Young, K. S., and Boardman, J. W., 1990, Mineral mapping at Cuprite, Nevada with a 63 channel imaging spectrometer: Photogrammetric Engineering and Remote Sensing, v. 56, no. 1, p. 83-92.