algorithms here, but we do note that JADE is comparable to the MNF algorithm in that JADE solves the BSS problem by a joint diagonalization of correlation ...
A SOLUTION PROCEDURE FOR BLIND SIGNAL SEPARATION USING THE MAXIMUM NOISE FRACTION APPROACH: ALGORITHMS AND EXAMPLES Douglas R. Hundley
Michael J. Kirby, Markus G. Anderle
Whitman College Mathematics Department Walla Walla, WA 99362
Colorado State University Mathematics Department Fort Collins, CO 80521
ABSTRACT
using second order statistics is well known [7, 8], but the connection to MNF is not; in fact, the MNF algorithm itself does not seem to be widely known. The purpose of this paper is twofold: We will review MNF, then show that the variational problem produced will also yield independent components in the sense that we will implicitly compute the pseudo-inverse of the mixing matrix. This will be followed by some examples, conclusions and apparent extensions. We focus on demonstrating the relationship between MNF and BSS with examples and algorithms; due to space limitations, the theoretical details will appear elsewhere [9].
In this paper, we outline the relationship between the Maximum Noise Fraction (MNF) method–an algorithm first proposed for cleaning noise from multispectral image data– and Blind Signal Separation (BSS). In particular we demonstrate under what conditions these methods are equivalent and indicate that MNF may be viewed as an extension to BSS for the case of subspace mixing. We present several examples and compare the results of the MNF method to algorithms for performing independent component analysis (ICA). 1. INTRODUCTION
2. MAXIMUM NOISE FRACTION (MNF) REDUCTION
Under some basic assumptions, we show that the method known as Maximum Noise Fraction (MNF) reduction performs a separation of signals into separate sources, or more specifically, independent components. In addition, we show that a second order algorithm for Blind Signal Separation (BSS) is a special case of the MNF method. Thus, we can also view blind signal separation as a subspace method of separating signal and noise where the decomposition also diagonalizes each of the respective subspaces. MNF was originally developed to denoise multispectral satellite images [1, 2], and was more recently applied to multivariate time series [3, 4]. A necessary condition for a solution to the MNF variational problem may be formulated as a generalized eigenvector problem. 1 This problem may be reformulated as a pair of standard eigenvector decompositions via a technique referred to as Noise Adjusted Principal Component Analysis (NAPCA) [5], (also see [6]). As we shall see, this approach facilitates drawing the connection between BSS and MNF. The solution to the BSS
���� ��� �� � �� �������� � � ��������� ��� ����� ����!��#"%( *,)$'&+ - - ���/. . - -
The MNF algorithm begins with the following setup: Suppose we have a data set , with . Suppose further that: where is the “signal” matrix, is the noise.2 We also assume that the signal is orthogonal to the noise in the sense that and . We define the signal to noise ratio as (1)
Under the assumption that the signal is orthogonal to the noise, we can write
.0�12�1�. � 0. � ��� �/. ��3 . � � � ��. . � � � ��. ����!��#"%( *,)$'&+ -- �.��. -4
(2)
Thus, the equation
Partial support for this research was provided by the National Science Foundation Mathematical and Physical Sciences grant DMS-9973303 and the DOD-USAF-Office of Scientific Research grant F49620-99-1-0034 P00002. 1 Actually, the problem is a special case of the generalized eigenvector problem with non-negative definite matrices; hence, it is more properly viewed as a generalized singular value problem.
2 Alternatively, we could view two signal matrices.
337
(3)
more generally as being the sum of
*
* � * � + � ! � , � . , � *0/ � , �1,2� , � ! , � �� 3� ��� � ���3� ��� � � �3� � ��� ��3 � � ��� � � �� ��� � '� �� � � 3 � �
2� � �4* � � � � ��� ��� �6�'* 5 , and with the scaling as1. � sumption that � � , we have that: * �6�1,2���, � , � � � � ��6* � �
See [10] for details concerning this derivation. In many situations the covariance matrix of the noise is available. If not, it may be estimated by first computing the covariance of the differences (see [2, 3] for more details). If we define the th row of the matrix as the difference of the th and rows of the matrix
�
�� � 3
� � �� ��� � � �� � � �� �� � � #
��3 � �
�
����� � � �� ����� � �
��� #��1,.� , � � ��!�,��-,.� , � �1,.� , � � ��!�,
then we may make the approximation, i.e.,
2. Whiten the data:
This may shown to be accurate as long as the signal is smooth. Thus the resulting optimization problem is given by the generalized eigenvector problem:
� �. �
� � �.
��
�� ����1,.� , � ! , � � � ��� 8-9;�6: < 5
� � ����������� � � �
1. Take the eigenvector expansion of the covariance of :
�
���
where the elements of
� � ��� 7! , � � � ��!�, �7! 3, � 8-9 !�,
3. Perform the second eigenvector expansion:
4. Finally, we compute the separation
The NAPCA algorithm to solve the MNF variational problem is summarized in the following:
�
� � � ��
are the original, independent, signals in , and is the full rank mixing matrix. We show that applying the MNF algorithm to this set is equivalent to computing the pseudo-inverse of . That is, if we define the SVD of , then . As before, we define , . Now we begin:
� �. � � � � ��.
�
� � � � ��
where
is an equivalent form of Equation (1) and leads to the generalized eigenvector problem
In the final step of the algorithm above we have employed . the assumption that 4. CONNECTING MNF AND BSS
are decreasing.
��� ����� ��� �
It is apparent from the algorithms of the previous two sections that MNF and BSS are equivalent (under our restricted assumptions) in the sense the signal matrix and the matrix of maximum noise fraction vectors are the same, i.e.,
2. Whiten the original data:
���
�
� � ��� �!�� � �� ! � � ��������� � ! � � 4. Define "
3. Compute the eigenvector expansion of the covariance of :
�#
This arises from the fact that the mixing matrix is the psuedoinverse of the generalized eigenvector matrix, i.e.,
5. Compute the maximum noise fraction basis vectors via
#
�
� 3 � ( ( ()� �
"
�.�$&%'��.'$
Note that the signal-to-noise ratios are given by , . Thus, this method then gives a natural ordering of the basis vectors. 3. SECOND ORDER BLIND SIGNAL SEPARATION (BSS) Let
����'*
#
* � ">= !�� 7 � !�, and ��� �� �1, as a result of the construction. given
In fact, the connection between BSS and MNF can be made stronger by the Generalized Singular Value Decomposition (GSVD) (see, for example, [11]). It can be shown that [9], if with , then there exists orthogonal matrices , diagonal matrices and a matrix so that:
�� �����
� � ����� � �����
! �� * �������BA !C�-?D�E��@�FG*
��? � �� @
Compare this with the BSS model, Equation 4. The MNF model can be translated directly to a signal separation model.
(4)
338
�$��2� � � � �
� A �� � ( ( ()� � F �� �
On the other hand, we can formulate the BSS as an MNF problem by writing out the matrix product. Let � � so that . Let so � that . Then:
A �� � ( ( ( � F � $�� � � ��
*
�� �'* � $ � �$ * $ � � � � ��
�
G$ where each
��
��
$
2
0
−2
����
where
� � and
? @ "%* @ $'& ? *,+
�
50
100
150
200
250
300
350
400
450
500
0
50
100
150
200
250
300
350
400
450
500
0
50
100
150
200
250
300
350
400
450
500
0
50
100
150
200
250
300
350
400
450
500
0
*
. ��$
0
5
. By the assumption of independence, we can group this sum in any manner. Therefore, the MNF solution will, by definition, need to compute the pseudo-inverse of , as the specific grouping to be made is not specified by the model. Furthermore, this connection of the MNF to the BSS permits a variational formulation to the BSS problem as
−5 2
0
- - �� -
−2 5
0
�
−5
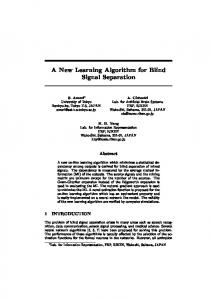
are assumed fixed. Fig. 1. The four original signals. This is the synthetic data for the first example, each of the four signals has 500 time ordered samples.
5. EXAMPLES Here we examine the above results with a synthetic data example as well as a speech data example. We will be comparing the results of the MNF method to two popular techniques: FastICA [12] and JADE [13]. Due to the limited length of this note, we will not discuss the details of these algorithms here, but we do note that JADE is comparable to the MNF algorithm in that JADE solves the BSS problem by a joint diagonalization of correlation matrices (versus MNF, which uses a single matrix).
5
0
Synthetic Data
−5
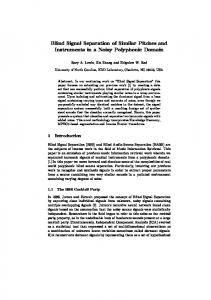
This example was taken from the Matlab implementation of FastICA [12] available on the web3 . Figure 1 shows the original, unmixed signals. Figure 2 shows the mixed signals presented to the MNF method, and the FastICA method. Figure 3 shows the result of using the MNF method (Steps 1-4 in Section 3), with the ordering given by the signal to noise ratios in Equation 2, and the results using FastICA are given in Figure 4. The parameters were set at the program defaults, using the “deflation” method and a cubic nonlinearity. The outputs of the algorithms are very similar.
0
50
100
150
200
250
300
350
400
450
500
0
50
100
150
200
250
300
350
400
450
500
0
50
100
150
200
250
300
350
400
450
500
0
50
100
150
200
250
300
350
400
450
500
5
0
−5 5
0
−5 5
0
−5
TIMIT Example
Fig. 2. The mixture of signals for presentation to the BSS algorithms.
The following mixture of signals was taken from the TIMIT [14] database. Two samples were taken of the same sentence (different speakers): “She had your dark suit in greasy wash water all year”. The time series were truncated to have 3 http://www.cis.hut.fi/projects/ica/fastica/
339
0.08
0.06
0.04
2 0.02
0
−2
0
50
100
150
200
250
300
350
400
450
0
500
2 −0.02
0
−2
−0.04
0
50
100
150
200
250
300
350
400
450
500
5 −0.06
0 −0.1
−5
0
50
100
150
200
250
300
350
400
450
0
0.05
0.1
500
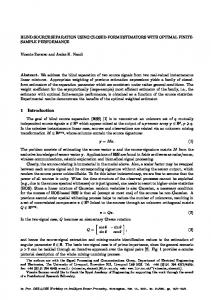
Fig. 5. A linear mixture of two voice samples (the same sentence is read by two different speakers).
5
0
−5
−0.05
0
50
100
150
200
250
300
350
400
450
equal length (no actual speech was deleted). A ��� mixing matrix was selected with elements randomly chosen from a normal distribution. The signals were mixed using this matrix, and the plot in Figure 5 shows the resulting scatter plot. In this case, the mixing matrix was arbitrarily selected to be
500
Fig. 3. The output of the MNF algorithm applied to the data in Figure 2.
*���� 33 ( �� 3�� � � � �� ( � � � ��3 � (� � (
8
0
50
100
150
200
250
300
350
400
450
500
0
50
100
150
200
250
300
350
400
450
500
0
50
100
150
200
250
300
350
400
450
500
0
50
100
150
200
250
300
350
400
450
500
2
0
2
0
−2 5
0
−5
� ���
�����
0
−2
�����'� *
*
5
−5
!
The covariance matrices described in Sections 2 and 3 are given in Table 1. Here we show the eigenvectors and eigenvalues , and only list the nonzero eigenvalues. In the first set, we consider the data as modeled by , and in the second set, we consider the data modeled by , where is the mixing matrix given previously. From the data in Table 1. it is evident that the signal and the noise are not exactly orthogonal. We also see that is close to diagonal, but is fairly far from diagonal. It is of significant interest that the fact that some of the basic assumptions held only approximately essentially did not impact to any significant degree the similarity of the MNF and BSS solutions indicating that these algorithms are rather robust to perturbations. The MNF was able to separate the signals, with the result shown in Figure 6. Similar results were found using FastICA [12] and JADE [13], where the outputs were compared to the original signal by computing the correlation coefficients. All yielded coefficients of either � . In Table 2, we compared the explicit computation of the the mixing matrix found by each method. To perform a valid comparison amongst methods, we examine the SVD of the output of each, and disregard the singular values, since the scaling is arbitrary in the BSS problem. The middle column lists the left singular vectors, the last column lists the right singular vectors. In all cases, the algorithms output comparable results.
*
Fig. 4. The output of the FastICA algorithm applied to the data in Figure 2.
340
3
�
30
�����
�� ( � � �3 ( � �� ( � � 3 �� (� � � �� ( � � �3 � ( ��� � � �� (( � � � � �� � � � � � (( � ��� � � �� �����
�
��
�
��
� � � � �
� �
!
� � ( � � 3 ��� � ( � � � (� 3 � � (� � � � � ( � � 3 � � �� �
� (
��
� � � (� � ( � � � � � � � ( � � � (�
8
( ��� (
3� 3�
(� � �
25
3� �
3 33 �� 33 33 3 33 �� ( � �
�� (( �� ( �
�
20
��
15
10
5
��
0
−5
��
−10
−15
−20 −20
�� �� �� ��
Left Vectors
� ( ( � � � � ( � ( � �
Orig
MNF
FastICA
JADE
�
�;( � �� �;( � � ( ( � � �
!
�;( � � � � ( �;( � � � � (
( � � � ��� �;(
�;( � � � � (
Right Vectors
� ( � � ( �
( � �;( � � ( � �� �� ( � ( � 3 �;( � �
−5
0
5
10
15
20
25
30
6. CONCLUSIONS
�� � ���
Method
−10
Fig. 6. The linear mixture from Figure 5, now separated through maximum noise fraction reduction.
We have reviewed the MNF technique, and have shown, by construction, that under some basic assumptions, the variational problem also produces independent components in the sense that we compute the pseudo-inverse of the mixing matrix. We have also shown several examples, comparing the output with some other popular ICA algorithms. In fact, we have compared many examples between algorithms, and have found that when MNF succeeds at separation, so does FastICA and JADE; when MNF fails to separate, so does FastICA and JADE. This comparison will need a more detailed examination in future work, but the comparison becomes somewhat clouded by the myriad of parameters that FastICA can implement.
Table 1. Computation of covariance matrices of interest. The first three correspond to the MNF model: , and the second set of two correspond to the BSS model:
�� �'*
−15
�
�;( � � � (� �;( � � �;( � �;( � � � � � (� �;( �3 � �;( �
7. REFERENCES [1] P. Switzer and A. Green, “Min/max autocorrelation factors for multivariate spatial imagery,” Technical Report 6, Stanford University, Department of Statistics, 1984. [2] Andrew A. Green, Mark Berman, Paul Switzer, and Maurice D. Craig, “A transformation for ordering multispectral data in terms of image quality with implications for noise removal,” IEEE Transactions on Geoscience and Remote Sensing, vol. 26, no. 1, pp. 65–74, January 1988.
Table 2. The left and right singular vectors of the mixing matrix, rounded to three digits. The first row was the original, the second row was produced by the MNF method, the third row was produced by FastICA, and the last row was produced by JADE. As we can see, all three methods produced comparable results.
[3] Markus G. Anderle, Modeling Geometric Structure in Noisy Data, PhD dissertation, Colorado State University, 2001. [4] M. Anderle and M. Kirby, “An application of the maximum noise fraction method to filtering noisy time-
341
series,” to appear Fifth International Conference on Mathematics in Signal Processing Book, University of Warwick, U.K., 2001. [5] J. Lee, A. Woodyatt, and M. Bergman, “Enhancement of high spectral resolution remote sensing data by noise adjusted principal components transform,” IEEE Transactions on Geoscience and Remote Sensing, vol. 28, pp. 295–304, 1990. [6] K. Fukunaga, Introduction to Statistical Pattern Recognition, Academic Press, Boston, MA, 1990. [7] Adel Belouchrani, Karim Abed Meraim, Jean´ Moulines, “A blind source Franc¸ois Cardoso, and Eric separation technique based on second order statistics,” IEEETRSP, vol. 45, no. 2, pp. 434–44, Feb. 1997. [8] A. Mansour, A. K. Barros, and N. Ohnishi, “Blind separation of sources: Methods, assumptions and applications,” IEICE Transactions on Fundamentals of Electronics, Communications and Computer Sciences, vol. E83A, no. 8, pp. 1498–1512, August 2000. [9] D. Hundley, M. Kirby, and M. Anderle, “A solution procedure for blind signal separation using the maximum noise fraction approach,” In Preparation, 2001. [10] Michael Kirby, Geometric Data Analysis: An Empirical Approach to Dimensionality Reduction and the Study of Patterns, Wiley, 2001. [11] Gene H. Golub and Charles F. Van Loan, Matrix Computations, Johns Hopkins, Baltimore, third edition, 1996. [12] A. Hyvarinen, “Fast and robust fixed-point algorithms for independent component analysis,” IEEE Transactions on Neural Networks, vol. 10, no. 3, pp. 626–634, 1999. [13] Jean-Franc¸ois Cardoso and Antoine Souloumiac, “Blind beamforming for non Gaussian signals,” IEE Proceedings-F, vol. 140, no. 6, pp. 362–370, Dec. 1993. [14] J. Garofolo, L. Lamel, W. Fisher, J. Fiscus, D. Pallett, and N. Dahlgren, “The DARPA TIMIT acousticphonetic continuous speech corpus,” CDROM, 1986.
342