AUTOMATED DAMAGE DETECTION AND VISUALIZATION OF THE 2003 BAM, IRAN EARTHQUAKE USING HIGH-RESOLUTION SATELLITE IMAGES Masashi MATSUOKA1, Tuong Thuy VU2, Fumio YAMAZAKI3 1
2
Team Leader, Earthquake Disaster Mitigation Research Center, NIED 1-5-2 Kaigandori, Wakinohama, Chuo-ku, Kobe 651-0073, Japan. Tel: (+81)-78-262-5529 Fax: (+81)-78-262-5527 Email:
[email protected]
Research Engineer, Earthquake Disaster Mitigation Research Center, NIED Email:
[email protected] 3
Professor, Department of Urban Environment Systems, Faculty of Engineering, Chiba University 1-33 Yayoi-cho, Inage-ku, Chiba 263-8522, Japan. Tel: (+81)-43-290-3557 Fax: (+81)-43-290-3411 Email:
[email protected]
KEY WORDS: damage detection, high-resolution image, the 2003 Bam earthquake, visualization ABSTRACT: This study focused in how to thoroughly exploit the capability of high-resolution satellite imagery such as IKONOS and QuickBird for disaster mitigation. An efficient automated methodology for damage detection was firstly implemented to derive the available rich information from satellite imagery. That detected results and the satellite imagery consequently were attractively presented through a fly-over animation and visualization. It aimed to assist the field-based damage estimation and strengthen the public awareness. Since oblique-view image or movie taken by a helicopter is more understandable, fly-over animation using Digital Terrain Model (DTM) and attributes of buildings from building inventory database simulated a movie taken by a camera equipped on a helicopter flying. Available IKONOS and QuickBird data capturing the recent strong Bam earthquake on December, 2003 were employed to demonstrate the competence of our automated detection algorithm and fly-over animation/visualization. Good agreement between our result and field-based damage detected results was found. Capture scenes from fly-over animation are depicted in this paper and the animation is presented elsewhere in a more appropriate form such as web or slide show. 1. INTRODUCTION For decades, remote sensing techniques have played an important role in grasping damage information due to earthquake. Medium resolution satellite data like SPOT, Landsat (Eguchi et al., 2003; Yusuf et al., 2001) or ERS (Matsuoka and Yamazaki, 2004) is mainly concerned to identify the damage extent and distribution. Damaged buildings can be detected by using the aerial photographs (Hasegawa et al., 1999). Recently, high-resolution imagery of commercial satellites such as IKONOS and QuickBird, which can be quickly acquired, becomes more powerful information of natural and/or man-made disaster at an early stage. We have been studying an automated detection method using only post-event images in order to make use of the instantaneous acquisition ability of helicopters and airplanes (Mitomi et al., 2000). Following those attempts, in this study, we investigate the suitability of the edge-based technique (Mitomi et al., 2002), which was developed by the examination of the relationship
between the aerial images and detailed damage survey data obtained after the 1995 Kobe earthquake, in applying on high-resolution satellite imagery. Remotely sensed data and its derived information can be employed in a more attractive mean to strengthen public awareness in disaster mitigation. That is virtual reality. Virtual reality using remotely sensed data has been widely employed to assist regional and local planning (Zhang et al., 2002), making digital cultural heritage (Gruen and Wang, 2002), natural resource management (Dunbar, 2003) and many others. However, few similar works have been carried out for disaster mitigation. In this study, we develop a technique employing the Digital Terrain Model (DTM), the building inventory database, and high-resolution satellite imageries to make the three-dimensional visualization and fly-over animation. They can also assist the on-site surveying and further damage assessment. After a strong earthquake which occurred beneath the city of Bam, Iran, on December 26, 2003, IKONOS and QuickBird observed the city on December 27, 2003 and January 3, 2004, respectively. QuickBird also captured the same area about eight months before the earthquake. Those data are employed to demonstrate the competence of developed methods. The following sections are started with the description about methodology for automated damage detection using high-resolution imagery and followed by new approach of its application on highresolution satellite imagery through the demonstration of data from Bam earthquake. It is then followed by the description of the technique for making animation and visualization, which was also applied for Bam earthquake. 2. AUTOMATED DAMAGE DETECTION OF BAM EARTHQUAKE The characteristics of the collapsed buildings were examined by processing the aerial television images taken after the 1995 Kobe, Japan, the 1999 Kocaeli, Turkey, the Chi-chi, Taiwan, and the 2001 Gujarat, India earthquakes (Mitomi et al., 2000). We proposed an area-independent technique using only post-disaster image to estimate the areas of damaged buildings by edge information in a local window, such as edge variance and edge direction, and statistical textures derived from the co-occurrence matrix of edge intensity (Mitomi et al., 2002). As the edge information can be derived from a gray scale image as well as brightness, the proposed method could be applicable to the high-resolution satellite imagery with equal or less than one-meter spatial resolution.
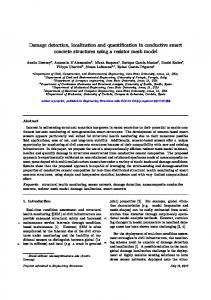
(a) IKONOS image taken on 12/27/2003
(b) QuickBird image taken on 1/3/2004
Figure 1. Result of detected areas with building damage.
Prior to applying the damage detection method to IKONOS and QuickBird images of Bam city, we need to prepare a gray scale (brightness) image. IKONOS and QuickBird can capture panchromatic images with very high-resolution, about 1 m and 60 cm, respectively. However, both panchromatic sensors cover not only visible but also near-infrared range. Our method was developed based on the aerial television images by a conventional camera. Therefore, highresolution brightness images were derived from pan-sharpened color images which were created by combining panchromatic band and multi-spectral bands. To create the natural color images, we used a linear contrast stretching, 2% for the minimum and 98% for the maximum, and allocated band 1, 2, and 3 to blue, green, and red colors. Figures 1 (a) and (b) show the results of the damage detection method applied to the IKONOS and QuickBird images of a central part of Bam city, respectively. Vegetated areas were removed by thresholding the NDVI. According to the reports of visual damage inspection from QuickBird images (Yano et al., 2004) and reconnaissance field survey (Hisada et al., 2004), more than 80% of buildings in an area, which is located in the south of Arg-e-Bam, were classified into Grade 4 (very heavy damage) or 5 (destruction) in the European Macroseismic Scale (EMS, 1998). The distribution of detected damage areas from IKONOS showed relatively good agreements with these results. However, less damage information could be detected from
Figure 2. Detected areas with building damage using color-modified QuickBird image.
Figure 3. Distribution of detected damage areas using whole QuickBird image with color-modification.
the QuickBird image (Figure 1b). Spatial resolution and color distribution might be the factors affecting the results. First, we examined the influence of spatial resolution. However, a resampled, one-meter resolution, QuickBird image provided similar result as the original Quickbird image. Hence, spatial resolution did not affect the extraction results. Next, we calculated the rates of DNs of green and blue to that of red in pan-sharpened IKONOS and QuickBird images to examine the color contribution. The average values of green and blue were 0.97 and 0.95 for IKONOS, 1.03 and 1.14 for QuickBird. We found that the QuickBird image contains cyan color in the predominance. In fact, the QuickBird image looked not natural but bluish. Therefore, color modification of QuickBird image by histogram matching with the IKONOS image was carried out. Figure 2 shows the results of extracted areas using the colormodified QuickBird image. Damage areas could be detected more abundantly than the original image use, and their distribution showed good correspondence with the results of the aerial and field investigations as well. The result applied to whole image of Bam city as shown in Figure 3 can support us to identify the locations of the severely damaged spots. In summary, even in use
of brightness image, the color distribution of RGB channels is the key factor, which depends on the characteristic of each sensor. Thus, it is necessary to carefully investigate this factor prior to apply our detection technique on any high-resolution satellite imagery. 3. FLY-OVER ANIMATION OF BAM EARTHQUAKE Briefly, the three-dimensional visualization and animation are based on the overlaying highresolution satellite imageries on the Digital Surface Model (DSM). Focusing on buildings in urban areas, DSM is generated from the Digital Terrain Model (DTM) and the building inventory database. Other features such as the trees, parks or streets are not concerned in generating DSM to set off the building features. Consequently, DSM is converted into grid format. The cell size of grid is chosen as same as spatial resolution of satellite imagery. Both the pre-event and post-event imageries can be overlaying on grid-based DSM for 3-dimensional visualization. It should be noted that it is not a real three-dimensional visualization because there is mainly information on the top of surface. Linear or cubic convolution re-sampling method can be used to paint the texture on the walls of buildings. Determining the flight orbit with the parameters of look angle, flight altitude, and flight speed is the first step for animation. Time frame is also decided to catch the scenes. Time-series scenes then are arranged and merged for the animation. In the case of Bam earthquake, DTM and building database were not available. However, we were also provided a pre-earthquake Quickbird scene which was acquired on September 30, 2003. Firstly, the area was assumed to be flat. Secondly, building footprints were digitized from pre-event scene for generating building database. Thirdly, relative heights of buildings were estimated based on extracted shadows from this pre-event scene and added into building database. As observed in Quickbird scenes of Bam, houses are mostly low and not much different in height. Hence, the thickness of extracted shadow was classified into 4 classes to estimate the building heights. Those extraction, classification and then registration of height into database were automatically carried out. However, a visual inspection was required afterwards to correct some strange appearance of building. It was due to the automated processing solely based on extracted shadows. Lastly, the animations were produced for both pre- and post-event
Pre-event
Post-event
Figure 4. The capture scenes from fly-over animation for pre- and post-event QuickBird images.
Quickbird scenes. Horizontal, vertical look angles and flight altitude were 5 degree, -45 degree and 500 meter, respectively. We also varied these parameters to generate different footages. The captured scenes from pre-event and post-event fly-over animation are shown in Figure 4. Viewed in oblique geometry, damage buildings can be clearly seen from these visualized scenes. Fly-over animation can project two cameras on the same surveying flight. While the left camera shoot the movie over pre-event scene, the right camera shoot the movie over post-event scene with overlaid damaged detection results (Figure 5). It is unreality but amazing and allow the watcher easily catch what happened when earthquake occurred. Due to the lack of DTM and the building inventory database in the case of Bam data as aforementioned, many manual tasks were carried out such as digitization of building footprints. If the database is available, the procedure to make this fly-over animation becomes much faster and easy to be carried out. Another key parameter is the height or number of story of the buildings. It is not only used for extrusion of the buildings but also might be necessary to assist ortho-rectification of the buildings.
Figure 5. A captured scene of simultaneous fly-over animation for pre- (left) and post-event (right) QuickBird Images. (Red-to-yellow colored regions are detected damaged areas as shown in Figures 4 and 5.) 4. CONCLUSIONS Automated damage detection algorithm has been developed to detect damage buildings from high-resolution satellite data. Good results detected from 2003 Bam earthquake proved the capability of our developed algorithm. It was not only successful with the aerial photographs as in our previous studies but also with satellite imagery by a few modifications, of course. A proposed scheme for fly-over animation and its amazing scenes from 2003 Bam earthquake was firstly aimed to assist the field-based damage estimation team. More importantly, it was a step further to expose the derived information from remotely sensed data to a wider community. Helping the publics to easily understand those analyzed results is a great contribution in disaster mitigation. Since our developed algorithm is designed as a fully automated processing, if satellite data is acquired within an acceptable time gap after a catastrophe, damage estimation at early stage is affordable. ACKNOWLEDGMENT QuickBird and IKONOS are owned by DigitalGlobe Co., Ltd. and Space Imaging, respectively.
QuickBird images used in this study were licensed and provided by Earthquake Engineering Research Institute (EERI), Oakland California, USA. IKONOS image was used by collaborated research with Remote Sensing Technology Center of Japan (RESTEC). REFERENCES Dunbar M. D., 2003. 3D Visualization for the Analysis of Forest Cover Change, ISPRS Commission IV Joint Workshop “Challenges in Geospatial Analysis, Integration and Visualization II”, September 8 - 9, 2003, Stuttgart, Germany. http://www.iuw.uni-echta.de/personal/geoinf/jochen/zzz_html/isprs03_papers_topics.htm Eguchi, R. T., Huyck, C. K., Adams, B. J., Mansouri, B., Houshmand, B., and Shinozuka, M., 2003. Earthquake Damage Detection Algorithms using Remotely Sensed Data – Application to the August 17, 1999 Marmara, Turkey Earthquake, The 7th EERI US/Japan Workshop on Urban Earthquake Hazard Reduction, Maui. European Seismological Commission, 1998. European Seismic Scale 1998. http://www.gfz-potsdam.de/pb5/pb53/projekt/ems/ Gruen, A. and Wang, X., 2002. Integration of Landscape and City Modeling : The Pre-Hispanic Site Xochicalco, International Archives of Photogrammetry, Remote Sensing and Spatial Information Science, Volume: XXX IV Part No.: 5/W3, ISSN: 1682-1777. Hasegawa, H., Yamazaki, F., Matsuoka, M., and Sekimoto, I., 1999. Determination of Building Damage due to the 1995 Hyogoken-Nanbu Earthquake Using Aerial HDTV Images, GIS and Applications of Remote Sensing for Disaster Management, CD-ROM. Hisada, Y., Shibayama, A., and Ghayamghamian, M. R., 2004. Building Damage and Seismic Intensity in Bam City from the 2003 Iran, Bam, Earthquake, Bulletin of Earthquake Research Institute, The University of Tokyo (paper in review) Matsuoka, M. and Yamazaki, F., 2004. Use of Satellite SAR Intensity Imagery for Detecting Building Areas Damaged due to Earthquakes, Earthquake Spectra, EERI, Vol.20, No.3, 975-994. Mitomi, H., Yamazaki, F., and Matsuoka, M., 2000. Automated Detection of Building Damage due to Recent Earthquakes Using Aerial Television Images, The 21st Asian Conference on Remote Sensing, 401-406. Mitomi, H., Matsuoka, M., and Yamazaki, F., 2002. Application of Automated Damage Detection of Buildings due to Earthquakes by Panchromatic Television Images, The 7th US National Conference on Earthquake Engineering, CD-ROM. Yano, Y., Yamazaki F., Matsuoka, M., and Vu, T. T., 2004. Building Damage Detection of the 2003 Bam, Iran Earthquake Using QuickBird Images, Proceedings of the 25th Asian Conference on Remote Sensing, CD-ROM. Yusuf, Y., Matsuoka, M., and Yamazaki, F., 2001. Damage Assessment after 2001 Gujurat Earthquake Using Landsat-7 Satellite Images, Journal of the Indian Society of Remote Sensing, No.29, Vol.1&2, 233-239. Zhang, L., Feiner, J., Louy, O., Gruen, A., and Schmid, W. A., 2002. Photo-Textured Digital Terrain Models as a Basis for Regional and Local Planning, International Archives of Photogrammetry, Remote Sensing and Spatial Information Science, Volume: XXX IV Part No.: 5/W3, ISSN: 1682-1777.