Mobile Networks and Applications 4 (1999) 273–287
273
A trace-based evaluation of adaptive error correction for a wireless local area network David A. Eckhardt and Peter Steenkiste Computer Science Department, Carnegie Mellon University, Pittsburgh, PA 15213, USA
Wireless transmissions are highly susceptible to noise and interference. As a result, the error characteristics of a wireless link may vary widely depending on environmental factors such as location of the communicating systems and activity of competing radiation sources, making error control a difficult task. In this paper we evaluate error control strategies for a wireless LAN. Based on low-level packet traces of WaveLAN, we first show that forward error correction (FEC) is effective in recovering from bit corruptions and that packet length adjustment can reduce packet truncation. However, as expected, fixed error control policies can perform very poorly, because they either introduce too much overhead in “good” environments or are not aggressive enough in “bad” environments. We address this problem through adaptive error control, i.e., error control policies that adapt the degree of FEC redundancy and the packet size to the environment. The effectiveness of adaptive error control depends on the characteristics of the error environment, e.g., the type of errors and the frequency with which the error environment changes. Our evaluation shows that adaptive error control can improve throughput consistently across a wide range of wireless LAN error environments. The reason for this effectiveness is that changes in the error environment are often caused by human mobility-related events such as the motion of a cordless phone, which take place over seconds, while adaptation protocols can respond in tens of milliseconds. Evaluating adaptive error control in a wireless environments is challenging because repeatable experiments are difficult: the wireless environment cannot easily be isolated and the adaptation process itself changes the environment, which may make trace-based evaluation difficult. We introduce a trace-based evaluation methodology that deals appropriately with changes in packet content and size.
1. Introduction Wireless connections are more susceptible to noise and interference than wired connections. Wireless transmissions are subject to absorption, scattering, fading, intersymbol interference, and interference from outside sources. The reason is that, while wired connections use a medium designed to reduce propagation-based errors and to largely isolate the data signal from competing signals, wireless signals traverse a harsh propagation environment shared with many competing signals. While many wireless connections are more error-prone than their wired counterparts, the effects of frequency and distance mean that the error environments of different wireless networks can be radically different; e.g., a satellite link and a wireless LAN may experience very different types of errors. Since solving the problem of high error rates depends critically on understanding the types and frequencies of errors, many studies have characterized wireless environments, e.g., [10,11,18,20,26] for wireless LANs. A recent study on the error characteristics of a wireless, in-building LAN [11] showed that wireless error environments may vary greatly depending on the placement of communicating stations, operation of other radio appliances, and even location of human operators. Variation in these conditions may cause a wireless link employing a fixed error-control policy to operate in one of three regimes: essentially error-free performance, an unusable link, or intermediate behavior. The high error rates in the intermediate regime are a major challenge, and research groups have considered approaches ranging from “localized” techniques, Baltzer Science Publishers BV
which are the focus of this paper, to end-to-end techniques that use special high-level protocols to treat wireless links in a special way [3–8,32]. We briefly discuss the tradeoffs between localized end-to-end techniques in section 7. Localized techniques, such as Forward Error Correction (FEC), in effect improve the error rate seen at higher levels [14,30]. The simplest solution is to cast a fixed FEC policy into hardware. While this may be cheap and fast, it will not be efficient if error environments can be very different. A fixed FEC policy will result in paying too much overhead in a low error environment, or leaving many link errors unmasked in a high error environment. The obvious solution is to use adaptive error control: the system adapts the degree of redundancy to the error environment. Adaptive error control has been used in a number of systems, e.g., satellite communication. However, the effectiveness of adaptive error control depends on the characteristics of the error environment, e.g., the type of errors and the frequency with which the error environment changes. In this paper we evaluate the utility of adaptive error control strategies in a wireless LAN environment. Our evaluation has two steps. We first evaluate error control techniques for the different types of errors we observed. We evaluate how effectively FEC masks bit corruption errors and how well reducing the packet size combats packet truncation. In the second step we evaluate whether error control can be applied adaptively in a wireless LAN environment. The results presented in [11] suggest that adaptation may be feasible since significant changes in the error characteristics of the wireless environment are often caused
274
D.A. Eckhardt, P. Steenkiste / Adaptive error correction for a wireless LAN
by human actions, e.g., moving from a location with poor reception to an area with good reception, or starting to use a cordless phone. Since human actions are relatively slow (on a multi-second timescale) compared with activities in a LAN, having the LAN adapt to the human actions seems quite realistic. This paper presents specific algorithms and evaluates them. Evaluating adaptive error control in a wireless environment is challenging because two factors make repeatable experiments difficult. First, the wireless environment cannot easily be isolated, so the dynamic error environment is hard to control. Second, the adaptation process changes the behavior of the system, e.g., the packet stream sent with adaptation will be different from the stream sent without adaptation, making a direct comparison of different adaptation policies difficult. For these reasons we evaluate adaptive error control using a trace-based evaluation methodology. We first characterize the error environment by collecting a set of detailed error traces. These traces then form the input to a simulator that evaluates adaptation policies based on forward error correction and packet shrinking. The simulator uses a performance metric that accounts for the traffic stream changes introduced by the adaptation policies. In the remainder of this paper, we first characterize the error environment of a wireless LAN using a set of error traces (section 2). We then evaluate the effectiveness of fixed error control techniques at overcoming the challenges posed by these traces (section 3) and present and evaluate adaptation strategies (sections 4 and 5). We conclude the paper with a discussion of implementation issues, related work, and conclusion in sections 6 through 8.
2. Characterization of errors We investigate the nature of the WaveLAN error environment by collecting detailed error traces for a set of interference scenarios. The traces we present span a wide range of packet loss, truncation, and bit corruption rates and will be the basis for our later evaluation of adaptive error control. 2.1. Error trace collection To characterize error environments, we monitored data transfers between two identical DECpc 425SL laptops (25 MHz 80486) running NetBSD 1.1. For different tests, we placed the PCs in different environments or added competing radiation sources. Our laptops use PCMCIA WaveLAN [29] interfaces operating in the 902-928 MHz frequency band. Appendix A provides more details on the WaveLAN interface. We instrumented our kernel device driver to collect all packets (even runt packets and those that fail Ethernet CRC) into an 8-megabyte kernel trace buffer. This allows collection of approximately 30 seconds of continuous network
activity. Packets are stored along with a sub-millisecond timestamp and signal information from the RF modem: signal level during reception (related to the receiver’s autogain-control level), “silence level” (signal level just after packet reception), signal quality, and selected receive antenna. The designated transmitter sends specially-formatted UDP datagrams that contain several repetitions of a single Walsh code word. We selected Hadamard–Walsh codes for the packet contents because they allow us to evaluate the sensitivity of the errors to packet contents (see appendix B). When the kernel trace buffer is full, the contents are compressed and stored on disk for off-line analysis, and the transmitter is instructed to send another stream of packets. The first phase of the analysis consists of processing the binary trace file into a text file containing a contentinsensitive summary of errors. Figure 1 shows an example. In general, each processed trace event contains a timestamp, the transmitted and received packet lengths (expressed as a count of 32-bit words), signal information from the RF modem, a packet sequence number, and a list of corrupted (inverted) bits. In this example, packet 151 was missing 3 out of 352 32-bit words, but was otherwise undamaged; packets 152 and 153 were lost; packet 154 was severely truncated and nine bits of the remainder were corrupted; after packet 154 a 7-word packet of unrecognizable contents was received. The second phase of the analysis extracts various summary information from the traces, which is described in the remainder of the section. 2.2. Interference scenarios Among the error sources we could have investigated are attenuation, interfering radio sources, multipath interference (which can vary due to details of antenna placement and orientation), motion, and data dependent effects. We chose to focus on the effects of the most significant error sources: active interference sources and attenuation [11]. Note that the encoding used by WaveLAN already addresses many problems such as multipath interference (appendix A). To explore the range of error severity due to interference, we investigated 30-second traces in four different situations (see table 1). In the “office” scenario, the communicating machines were separated by a distance of approximately 5 feet, and there were no known interference sources. In the “walking” scenario, the communicating machines were separated by roughly 3 feet. A cordless telephone base station was a few inches from the receiver’s modem unit (as might be the case on an office desk), and the telephone handset moved repeatedly at walking speed back and forth from roughly a foot away from the base station to a point approximately 30 feet away (where the handset complained about signal loss). The cordless phone used was a Radio Shack ET-909, which uses spread spectrum modulation in the same band as our WaveLAN units. It was reported to be a particularly harsh interference source in [11]. The “adjacent” case was the same at the “walking” case except
D.A. Eckhardt, P. Steenkiste / Adaptive error correction for a wireless LAN
@2738775 lost 152 @2757194 @2780328
{352 349} [40 2 4 1] 151: 153 {352 30} [34 40 10 1] 154: {-1 7} [34 40 6 0] alien
275
156 160 163 320 324 327 411 415 418
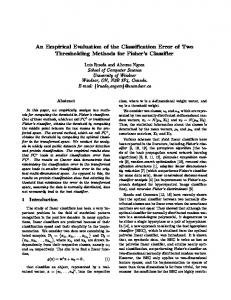
Figure 1. Example of human-readable trace file. Table 1 Summary of various error scenarios. Since the trace buffer is of a fixed size, lost packets cause it to fill more slowly, and it captures a wider range of sent-packet sequences numbers. “Packet loss rate” is the fraction of packets that were sent but not received; “packet truncation rate” is the fraction of packets that were received but truncated, and “packet corruption rate” is the fraction of packets that were received without truncation but with at least one corrupted bit in the UDP data area. The Bit Error Rate is computed for all bits in the UDP data area which arrive at the receiver (that is, bits lost to truncation do not contribute to the BER computation). Trial name
Packets sent
Bits received
Packet loss rate
Packet truncation rate
Packet corruption rate
Bit error rate
Office Walking Adjacent Table Walls
5729 5729 10487 5916 5776
6 × 10⁷ 6 × 10⁷ 6 × 10⁷ 6 × 10⁷ 6 × 10⁷
0 7 × 10⁻⁴ 3.1 × 10⁻¹ 5.4 × 10⁻² 6 × 10⁻³
0 9 × 10⁻⁴ 2.3 × 10⁻¹ 1.9 × 10⁻² 1.7 × 10⁻²
3.4 × 10⁻⁴ 5.4 × 10⁻² 3.5 × 10⁻³ 9.4 × 10⁻¹ 2.7 × 10⁻¹
0 1.6 × 10⁻⁴ 1 × 10⁻³ 4.9 × 10⁻³ 3.8 × 10⁻⁴
that the handset was fixed adjacent to the receiver’s modem unit and was power-cycled at a rate of approximately twice per second (in an attempt to provide an error environment with more challenging variability than the “walking” case). In the “table” case, two communicating units were approximately three feet apart, with the telephone handset and base station about an inch and about five inches from the receiver’s modem unit. In these traces we observe packet loss rates of up to 30% and packet truncation rates of up to 23%. We notice that the bit error rate varies by more than an order of magnitude, and that this variation is not straightforwardly linked to the other error rates. While attenuation can be reduced by provisioning a network more densely with base stations, mobile users may still encounter occasional coverage “holes.” Therefore, we investigated the effects of attenuation to see how they differed from those of active interference sources. The fifth, “walls,” trace in table 1 represents a path with significant attenuation: we separated two units by placing them in two rooms across a hallway. The direct path was approximately 17 feet long and passed through two thick concrete block walls, a metal display case, and some classroom furniture. As compared to the interference environments, attenuation has an almost insignificant truncation rate, but has significant packet corruption. Theses five examples illustrate the wide range of damage induced by interference and attenuation. They also detail the three types of errors commonly encountered on wireless links: lost packets, truncation, and bit corruption. An important question is how the error environment changes over time. In [11] the authors report that the main error sources are attenuation caused by obstacles (walls and humans) and interference caused by some active radio sources that use the same frequency band as the WaveLAN card. For these types of error sources we expect that changes will often be caused by human actions such as switching the competing source on or off, or moving the
Figure 2. Temporal display of the start of the “adjacent” trace. Each point represents a single event, such as a loss or corruption.
mobile host or competing source. Figure 2 gives an example of how the error environment changes in response to the 2-Hz power cycling of a cordless phone. As the interference source is turned on and off, two steady but alternating error environments are visible. Even though this is fairly rapid human action, long periods of similar error behavior occur. Note that there will also be changes in the error environment at a finer time scale. An example would be interference from another wireless network: the level of interference could change from bit to bit. This type of interference is typically addressed by methods different from what we propose in this paper. For example, WaveLAN uses direct sequence modulation to combat a variety of error sources (fading and narrowband interference signals); wireless networks could also employ code diversity, frequency diversity, and base station antenna sectoring to further reduce interference. As a result of this, in a well-designed wireless LAN, the main remaining sources of errors are attenuation and other sources of interference, as described above.
276
D.A. Eckhardt, P. Steenkiste / Adaptive error correction for a wireless LAN
2.3. Applicability of results Our adaptation results are based on the observation that some changes in the error environment are slow because they are caused by human actions such as mobility. We believe that similar results will be obtained for other LANs that face errors that can be ameliorated by modifying transmission resource consumption (via power control, error coding, packet shrinking, or even adaptive medium access protocols). Note that while adaptive error control has been applied to other wireless environments such as satellite links and cellular phones, differences in both the error environment and how it changes mean that our results may not generalize to these domains. 3. Error control techniques In this section we summarize the error traces in terms of three error types, bit corruption, packet truncation, and packet loss, and discuss error control options for each error type. 3.1. Bit corruption A first source of errors is bit corruption. WaveLAN typically operates as an Ethernet in that all packets are protected by a 32-bit Ethernet CRC, and all packets failing that CRC check are rejected. In tables 2 and 3 we present a brief analysis of all bit corruptions observed during the interference runs described above. The histogram in table 2 indicates that approximately 28% of the packets would have been discarded as failing CRC, but that essentially all of Table 2 Histogram of per-packet bit error rate. Percent of bits flipped
Number of packets
0 1 2 3 4 5 6 7 8 9 10 11 12 14
192846 74000 982 509 364 208 72 21 12 7 10 4 1 1
Table 3 Bit flipping behavior observed during the combined interference runs. The overall bit error rate was 6.6 × 10⁻⁴ . Original bit 0 1
Times flipped
Times sent
998945 997311
1509063744 1509568640
them have 5% or fewer flipped bits, well within the reach of FEC. Furthermore, interference seems to corrupt each bit value with essentially identical probability (table 3). We did not observe any tendency for bad bits to be at any particular bit position within a packet. However, bit corruptions very often follow a specific pattern: three bits, separated by 3 and 2 bit positions, are flipped. This means that most error bursts occur within one or two bytes. We believe this is an artifact of an 8-bit-deep linear feedback scrambler. 3.2. Applicability of FEC to correcting bit corruption The bit corruption patterns discussed above suggest that FEC can be used to reduce the error rate. We now evaluate the effectiveness of Reed–Solomon burst-correcting block codes at correcting the errors observed in our traces and briefly discuss the corresponding implementation costs. Appendix C contains FEC background information and a discussion of why we chose to employ these particular codes. 3.2.1. Effectiveness Reed–Solomon codes with 8-bit symbols have a block size of 255 bytes, which may be arbitrarily divided among user data bytes and overhead bytes. The decoder can correct as many corrupted bytes as half the number of overhead bytes, and doesn’t care how many bits in a given byte are corrupted. This means that these codes are particularly suited to error bursts of fewer than 8 bits. The 255-byte block size poses some inconvenience, as packet body lengths are typically even and often slightly longer than a power of two. However, we can break a packet into some number of 255-byte blocks and one “shortened” block, which we zero-pad for encoding and decoding purposes. We ran the traces presented in the previous section through a software implementation of Reed–Solomon encoding, and evaluated how many corrupted packets could be recovered. Figure 3 shows how effective FEC is at reducing data loss due to bit corruption. The graph shows how the percentage of uncorrectable packet bodies decreases as the FEC overhead is increased. We processed the traces described above by removing all records that reflect losses, unrecognized packets, and truncated packets (for which full corruption patterns are necessarily unavailable). Residual error rates less than around 1% are probably not significant even for higher-layer protocols such as TCP. It is worthy of note that the FEC overhead level required to reach a reasonable residual PER varies from 0% in the “office” environment to 20% or 30% in the “table” environment. These results are conservative as we have not investigated interleaving, which would tend to average out the number of corrupted symbols per block, quite possibly improving performance. Even so, they show that FEC is effective at recovering from bit corruption. The graphs also show that it would be costly to always employ error coding strong enough for the worst case: substantial bandwidth
D.A. Eckhardt, P. Steenkiste / Adaptive error correction for a wireless LAN
Figure 3. Residual packet error rate versus error correction overhead. The residual packet error rate is the percentage of packets that arrived without being lost or truncated and had one or more bit errors not corrected by the Reed–Solomon code. The left-most (0%) point on each curve represents the uncorrected packet corruption rate given in table 1. The “office” dataset has no uncorrected errors once FEC is enabled, and hence is represented on the graph by only a single point.
would be wasted in the other cases. Selecting an error coding appropriate for the average error rate is also suboptimal: it will be too aggressive in some cases and not aggressive enough in others. Given the high variance in error rates, the average is not a useful metric. 3.2.2. Implementation costs The costs associated with the implementation of FEC are additional bandwidth on the link, as discussed above, and the FEC coder/decoder. FEC codecs can be implemented in either hardware or software. For example, multi-rate singlechip convulational codecs that operate at tens of megabits per second are available as commodity parts [22], making hardware implementations practical and economical. For this paper we relied on a publicly available software implementation of Reed–Solomon codes [15], which can encode at up to 2.7 Mb/s and decode at up to 1.5 Mb/s on a 100 MHz Pentium. 3.3. Packet truncation Truncated packets are a serious problem for network reliability. While erasure-correcting FEC can be designed to recover from truncation, this requires overhead beyond that necessary to correct occasional symbol errors. We have observed that WaveLAN experiences significant truncation in heavy interference situations. While it seems intuitive that short packets are less likely to be truncated than long packets, the truncation rate might depend on the packet length in a number of ways. For example, the probability of truncation could be proportional to the packet length (some interfering source occasionally truncates whichever packet is being transmitted, independent of its length), or packets could be truncated to some fixed length (by some process within the receiver). Identifying the precise error behavior is important if we want to reduce the truncation rate.
277
Figure 4. Packet injury as a function of packet length. The cordless phone is on throughout the trace, and both base and handset positions are fixed.
In order to better understand the relationship between packet length and truncation errors, we collected packet traces that use a mix of packet sizes. Since we do not understand the cause of the truncation, it is important that all packet sizes get sufficient exposure to the potential cause of truncation. For this reason, we arranged the packet sequences so that roughly equal time was spent transmitting packets of each observed length, i.e., more of the shorter packets were sent. One interesting detail is that the WaveLAN link header and trailer occupy air time equivalent to 38 bytes [2] and Ethernet, IP, and UDP headers and trailers occupy 48 bytes. This 86-byte overhead is significant when we sent test packets of only 128 user bytes. We correct for this by sending packets according to a schedule which roughly balances their air time. We present the results in two forms. The first (figure 4) is a graph of packet outcome as a function of packet length from a trace in which the cordless phone is providing steady interference from a fixed location. Packets that are not lost may be corrupted, truncated, or both. Note that this corresponds to a high error environment: the packet error rate can be nearly 100%. Focusing on the truncation rate, we observe that for packets longer than 400 bytes virtually all received packets are truncated, while for shorter packets the truncation rate increases linearly with the (original) packet length. While figure 4 classifies packets according to how they were injured, it does not describe the severity of the injury (the bit error rate or truncation extent). These figures are presented in table 4. Again focusing on the problem of truncation, we observe that truncation is quite severe for long packets. For example, for full sized packets, usually fewer than half the bits survive, making it difficult to extract useful data from truncated packets. For shorter packets, truncation is less severe. One possible physical phenomenon that could cause this type of packet truncation is clock drift. Since the carrier frequencies of the transmitter and receiver typically vary by a small amount, WaveLAN performs active clock recovery [29]. It seems likely that under unfavorable conditions, clock drift could eventually
278
D.A. Eckhardt, P. Steenkiste / Adaptive error correction for a wireless LAN
Table 4 Truncation details. Some of the unrecognized packets are probably “lost” test packets; others seem to be interference mistakenly identified by the RF modem unit as a potential packet. The bit error rate is computed over the non-truncated bits of each packet. Transmit length
Number observed
min
? 128 256 384 512 640 768 896 1024 1152 1280 1408
104352 7183 4023 3053 2067 2063 2022 2060 1015 1015 1016 1026
0 96 96 96 96 96 96 96 96 96 96 96
Length after truncation mean 34.19 127.10 235.42 322.80 381.64 412.27 427.71 428.07 436.45 437.43 428.75 436.65
% of packets truncated
Bit error rate
std. dev. 104.55 4.49 42.97 90.00 139.14 179.85 198.52 202.43 203.77 213.50 217.26 226.21
100.00 4.83 24.76 42.94 61.97 81.10 96.88 97.57 98.62 98.33 98.72 98.73
? 9.2 × 10⁻³ 9.1 × 10⁻³ 8.6 × 10⁻³ 8.8 × 10⁻³ 8.3 × 10⁻³ 8.6 × 10⁻³ 8.3 × 10⁻³ 8.6 × 10⁻³ 8.7 × 10⁻³ 9.1 × 10⁻³ 9.0 × 10⁻³
3.4. Packet loss
Figure 5. Packet injury as a function of packet length. Unsteadiness in this plot may be due to the fact that the interference source was intermittent, so the smaller number of large packets could reduce sampling quality.
overcome the clock recovery process, causing the receiver to abort packet reception. Figure 5 demonstrates a similar trend for a trace collected with machines in the same locations as the “table” trace. The above results suggest that packet size reduction is a realistic method for reducing packet truncation rates. For example, figure 4 indicates that reducing the packet size to 400 bytes would cut the truncation rate from 40% to 20% of the received packets. Packet size reduction would need to be combined with retransmission of the truncated (and lost) packets to reduce the error rate to a number that is acceptable to the upperlayer protocols. Even for the extreme error environment used in this section, the link may still be quite useful: if we make the conservative assumption that all truncated packets are useless (that is, no erasure code or sub-packet blocking is employed), shrinking the packet size and applying FEC might still achieve a useful fraction of the link rate. Furthermore, it is interesting to note that even if truncated packet bodies are useless for conveying user data, we may still be able to extract a small Logical Link Control layer header containing error statistics. As a final note, we observe that the packet loss rate (figures 4 and 5) and BER (table 4) appear to be independent of packet size.
The final type of error is packet loss. One possible explanation for packet “loss” might be that our trace analysis is failing to recognize certain packets due to extreme truncation or corruption, i.e., our approach creates false losses. We briefly investigated this hypothesis and found that, while some periods of packet “loss” correspond with arrivals of unrecognized packets, many do not. Furthermore, there are many occasions when unrecognized packets arrive intermixed with sequential test packets. Figures 4 and 5 suggest that the packet loss rate is independent of packet size, suggesting another explanation. Each WaveLAN packet begins with a training pattern, a start delimiter, a carrier training sequence, a “network ID”, and a standard Ethernet preamble [2]. It seems plausible that damage to any of these fields (though most are transmitted with extra redundancy) could cause receiving hardware to overlook an entire packet. Table 1 does not clearly demonstrate that packet loss and bit error rate are linked, so this explanation may be incorrect. The problem of packet loss can be addressed by retransmission [6,8] or by cross-packet interleaving. 3.5. Summary We used error traces to characterize a number of error environments for WaveLAN and we discussed and evaluated error control techniques. We showed that bit corruption can be addressed using FEC based on Reed–Solomon codes. We also showed that packet truncation can be addressed by sending smaller packets. Both FEC and packet shrinking have the property that they increase communication overhead. As a result, it is not attractive to apply these techniques unless they are needed. Our results show in fact that radically different degrees of error coding are needed in the different error environments we evaluated. In the next two sections, we propose and evaluate adaptive error control policies.
D.A. Eckhardt, P. Steenkiste / Adaptive error correction for a wireless LAN
Lost packets are most easily addressed using retransmission, which is inherently adaptive. It is evaluated elsewhere [6,8].
4. Adaptive error control strategies In this section we discuss design considerations for adaptive error control strategies, implementation issues that may complicate adopting adaptive error control, and present the adaptation policies that we will evaluate in the next section.
279
Adaptation will be effective if the system can collect reliable error estimates and react appropriately to those estimates in a timely fashion, i.e., before conditions change again. There are many reasons why adaptive error control may fail, e.g., it is not understood how errors can be reduced by changing how data is sent, or the changes in error environment happen too quickly to be tracked. Adaptive error control that works well in one environment may not be effective in a different environment. For example, errors on a satellite link and in a LAN environment are caused by different phenomena, and different error control strategies (adaptive or not) are likely to be needed.
4.1. Overview 4.2. Adaptation policies The idea behind adaptive error correction is simple: the receiver collects information about the status of the channel, it summarizes the information into an error estimate, which is transferred to the sender, and the sender adapts how it sends data based on the error estimate. Let us briefly look at some the implementation options for each of these three components: • Error information sources. A number of different information sources can be used to determine the quality of the error environment. A hardware CRC algorithm may be used for error detection, and most error correction algorithms can provide their clients with an estimate of how close the decoded packet was to containing uncorrectable errors. Alternatively, a wireless network interface may provide signal measurement information which could warn of impending trouble, thus allowing predictive rather than reactive error control. All the policies we evaluate are reactive schemes based on observed error rates. • Error estimation. Single error events must be combined to yield an error estimate. This summary will typically be generated periodically by applying a reduction method (average, minimum, or maximum) over some time window. Different methods may be used for different features. The error estimate then must be sent to the sender in a fairly robust way so that the information arrives most of the time. Finally, the sender must deal with the time-critical nature of the information, e.g., it must age state measurements and it must have some method for estimating the results of experiments it hasn’t performed recently. Two aging methods are used by our adaptation policies. • Adaptation policy. The sender must modify how it sends data based on the error estimation. This requires an understanding of the dependencies between error types and the possible recovery techniques, i.e., it must know how each type of error can be reduced or eliminated. Note that certain types of errors (e.g., packet loss) may not be avoided by changing how data is sent, but require more radical approaches (e.g., retransmission). The policies we use below adapt the packet size and the degree of redundancy used in FEC.
To focus on the utility of adaptation, we evaluated three fixed policies and four adaptive policies: Bold roughly corresponds to an unmodified WaveLAN: maximally-sized packets (five 255-byte blocks) are sent with no error coding. This policy could be considered a pure ARQ link-layer policy: each packet will be transmitted repeatedly until it is received error-free. Light transmits maximally-sized packets with 5% coding overhead. This is potentially a good policy since many packets are not badly damaged (see section 3.2). Robust attempts to excel in difficult conditions. It sends minimally-sized packets (one 255-byte block) with nearly one third of each devoted to coding overhead. Bimodal is a simple-minded adaptive policy. It behaves exactly as “bold” when conditions are good, and as “robust” when they are poor: if two consecutive packets are truncated or corrupted, it sends small, heavily-coded packets until three consecutive packets are not damaged. Bi-code is like “bimodal” except that it adjust only coding overhead. Bi-size is like “bimodal” except that it adjust only packet size. “Bi-code” and “bi-size” are included in an attempt to understand how much coding and packet sizing contribute independently to the success of “bimodal.” Flex adapts the packet size and degree of FEC redundancy independently. Whenever two or more packets in a window of ten experience truncation, “flex” reduces its estimate of the current safe packet size to 85% of the post-truncation packet length. If three consecutive transactions do not experience truncation, “flex” begins to expand the safe packet size estimate, adding first 200 bytes, then 400, then 800, until the estimate reaches the maximum packet size. While “flex” maintains its estimate of the safe packet size in bytes, it rounds this value downward to an integral number of 255-byte blocks. Whenever two or more packets in a window of ten experience a decoder failure, “flex” reduces its estimate of the fraction of each Reed–Solomon block that can carry user data by 15%. If three consecutive packets do not experience decoder failure, “flex” begins to expand the user data share, adding first 10 bytes, then 20, then 40, until the entire block carries user data.
280
D.A. Eckhardt, P. Steenkiste / Adaptive error correction for a wireless LAN
It is clear that more sophisticated policies are possible. However, our samples illustrate the space of possible policies and, as we will see below, highlight interesting differences among the trace environments. 5. Evaluation of policies In this section we describe details of the simulation environment we employed and present an evaluation of the policies we considered. 5.1. Approach Evaluating adaptive error control in a wireless environment is challenging because repeatable experiments are difficult. Repeatability is difficult for two reasons. The first problem is that a wireless environment cannot easily be isolated, so the dynamic error environment is hard to control. This problem is traditionally addressed by using trace-based evaluation. A set of traces is collected that capture features of the environment that are important to the protocols under investigation. The different protocols are then implemented and evaluated in a simulator or an emulated environment [18,20] that is driven by the traces. By using the same set of traces for each of protocols, a direct comparison is possible. We use this approach for our evaluation of adaptive error control policies. We use a simulator (discussed below) that is driven by the detailed error traces that we presented in section 2. The simulator does a one-to-one transfer of errors from packets in the trace to the stream of packets that is submitted to it. If a packet in the trace was lost, the simulator marks the packet submitted to it as lost. If the trace shows packet truncation to x bytes, the simulator will truncate its packet to x bytes. Finally, if the trace shows bit corruption, the simulator will corrupt the appropriate bits in whatever part of the packet escaped truncation. The second problem is that the adaptation process itself changes the behavior of the system, so we must replay traces in situations different from the ones in which they were collected. In our case, the packet contents may change as a result of FEC and the packet size may be changed to reduce truncation errors. The correctness of applying an error trace collected using one packet stream to a different packet stream depends strongly on the characterization of the errors presented in section 2. Let us consider both changing the packet contents and packet size: • Contents Applying bit corruption information collected using one set of packets to a set of packets with different contents (e.g., as a result of adding FEC) is only correct if errors are not sensitive to packet contents. As a result of the data encoding used in WaveLAN, errors are indeed not sensitive to the data contents and bit corruption information collected using one data set can be applied to another data set. Appendix B elaborates on this point and also presents an experimental validation
of the assumption that changing contents affects neither the packet corruption rate nor the packet truncation rate. • Size Applying the truncation information collected using one packet size to a (shorter) packet is valid only if the chance of truncating a packet to x bytes is the same for all packets (longer than x), and is independent of the packet contents. Table 5 is based on the same trace information presented in table 4. If post-truncation received packet lengths were a function of the transmitted packet length, we would expect that the percentage of packets truncated to a certain length (entries in one row of table 5) would vary noticeably, which we do not observe. If, on the other hand, truncation lengths are independent of transmitted lengths, we would expect that rows would be internally consistent and different from each other. For example, roughly 10% of all packets with transmitted lengths from 512 to 1408 bytes are truncated to a length in the 448-to-511-byte range, but essentially no packets of any transmitted length survive to be truncated to any length over 768 bytes. This justifies treating a trace record containing a truncation to x bytes as an indication that any packet shorter than x bytes would escape truncation and that any packet longer than x bytes would be truncated to x bytes. If we wish to also apply (part of) a long packet’s bit corruption syndrome to a simulated short packet, we would wish to validate this by observing the bit error rate to be independent of packet length; table 4 supports this approach. 5.2. Simulator The architecture of the simulator is shown in figure 6. The policy module implements a specific error correction strategy. Its input is information on the errors that affected previous packets. It periodically makes a “send” decision, which consists of specifying two numbers, a count of 255byte blocks to send and the number of user data bytes each block will carry (the remainder is used to carry Reed– Solomon parity information). The policy module currently has instantaneous access to the error estimate generated by the decoder on the receiver. This represents a delayfree, error-free back channel, which is clearly not realistic. However, it can be approximated in a LAN environment by a MAC-level acknowledgement with appropriate transmission redundancy. The packet is then encoded using a software Reed–Solomon encoder, and forwarded to a modulate that models the error characteristics of the wireless link. The channel model takes an error trace and uses this to decide what damage to inflict on the packet, as we described above. In order to ensure that the trace’s bit-corruption patterns are long enough to cover any packet that our adaptation policy might choose to send, we use only traces of long fixed-size packets. The transmission result is then forwarded to the Reed–Solomon decoder, which will attempt to decode it. The decoder forwards the error information for the packet to the evaluation module, and also generates
D.A. Eckhardt, P. Steenkiste / Adaptive error correction for a wireless LAN
281
Table 5 Received lengths versus transmitted lengths. The column headings are transmitted lengths, and the row labels are the floors of histogram buckets: row 0 represents packets received with length 0 through 63. Note that the leftmost non-blank entry of each row represents packets that were received without truncation. Columns may not add to 100% due to accumulated roundoff errors. Received
Transmitted length
length
128
256
384
512
640
768
896
1024
1152
1280
1408
0 64 128 192 256 320 384 448 512 576 640 704 768 832 896 960 1024 1088 1152 1216 1280 1344 1408
– 4% 95% – – – – – – – – – – – – – – – – – – – –
– 5% 9% 10% 75% – – – – – – – – – – – – – – – – – –
– 4% 9% 8% 9% 10% 57% – – – – – – – – – – – – – – – –
– 5% 8% 9% 9% 9% 9% 9% 38% – – – – – – – – – – – – – –
– 5% 11% 9% 8% 9% 9% 10% 8% 9% 18% – – – – – – – – – – – –
– 5% 10% 8% 8% 10% 9% 8% 9% 9% 8% 7% 3% – – – – – – – – – –
– 5% 10% 10% 8% 10% 8% 10% 9% 9% 8% 6% 0% 0% 2% – – – – – – – –
– 4% 9% 8% 9% 11% 10% 8% 9% 9% 9% 6% 0% – 0% 0% 1% – – – – – –
– 4% 9% 9% 9% 11% 8% 9% 8% 10% 9% 5% 0% – 0% 0% 0% 0% 1% – – – –
– 4% 10% 11% 9% 8% 8% 9% 10% 9% 7% 6% 0% 0% – 0% 0% – 0% – 1% – –
– 4% 9% 11% 8% 10% 8% 9% 10% 9% 8% 5% 1% – – 0% 0% 0% – 0% – 0% 1%
an error estimate for the policy module on the sender. Our traces contain a small numbers of packets which experienced bit corruption in only the Ethernet or IP envelopes, for which we cannot reconstruct the exact corruption pattern. The simulator treats these events as if no corruption had occurred. While this is inaccurate, these packets are quite rare (28, or 0.5%, in the “walls” trace, and no more than 4 in any other trace). For each packet, the evaluation module is told whether the packet was lost, how many blocks were not truncated, and how many blocks were successfully decoded. This results in a packet efficiency figure: the number of correct bytes delivered to the receiver (zero in the case of packet loss) divided by the “air time”, the amount of time required to send those bytes, however they were encoded, plus WaveLAN, Ethernet, IP, and UDP headers and trailers. The adaptive protocols we are simulating are intended to represent wireless-specific single-hop Logical Link Control protocols such as those evaluated in [6] rather than higher-level, inherently end-to-end protocols such as TCP, so this efficiency figure does not account for any competing transport-level retransmissions. While one would like to see an efficiency of 100%, packet headers and inter-packet gaps limit the efficiency to 94%, even in an error-free environment. We wish to compare the efficiencies of different error control policies, each transmitting continuously, under a variety of error environments. Calculating the efficiencies of policies adapting to a specific trace is straightforward if, during each transmission interval, all policies use the same
Figure 6. Simulator architecture.
packet size as the trace packet: a policy’s efficiency is the total number of user bytes delivered correctly divided by the total airtime. Calculating efficiency is more complicated if policies use different packet sizes. The fundamental problem is that the trace has incomplete information on the error environment, e.g., no information is available on the environment during the inter-packet gap, so it is not possible to precisely simulate the errors observed by each policy. We can use the per-packet simulation outlined above, but we must apply a weight to the effect of each packet. Since each simulated packet transmission “consumes” a trace record even if the packet is shorter than the trace record, a policy that reduces packet size under high error conditions would be billed for less air time than a policy that uses fixed packet sizes. Since each trace record represents a certain amount of time, the effect would be that, in the simulation, the adaptive policy would spend less time in the bad periods than the fixed policy, and would thus be experiencing a different error environment, rendering efficiency comparisons impossible. We correct for this by scaling the effects of each packet (bytes delivered and airtime consumed) by the ratio of the trace record’s airtime to the transmitted packet’s airtime.
282
D.A. Eckhardt, P. Steenkiste / Adaptive error correction for a wireless LAN Table 6 Performance of different error control policies. Packet sizes are expressed in 255-byte Reed–Solomon blocks and error control overheads are expressed as percentages. Environment
Bold
Light
Robust
Bimodal
Bi-code
Bi-size
Flex
Oracle
Office Walking Adjacent Table Walls
94% 89% 43% 0.06% 69%
89% 87% 41% 15% 84%
53% 53% 32% 49% 52%
94% 89% 50% 26% 72%
94% 89% 43% 33% 73%
94% 89% 44% 17% 72%
94% 89% 45% 58% 81%
94% 93% 54% 76% 91%
Figure 7. Comparison of normalized performance for each policy. For each policy, each bar represents that policy’s performance in one scenario (office, walking, adjacent, table, or walls) normalized to the performance of the “oracle” in that scenario. This comparison shows that “bold” and “light” perform well except for one case, “robust” always performs satisfactorily, and “flex” always does well.
In effect, during each trace interval, a policy can send one maximally-sized packet or one and some fractional number of smaller packets. We can then compare policies in a fair manner. One minor drawback of this solution is that it artificially limits the adaptivity of algorithms, since adaptation is only allowed at fixed time intervals, rather than after every packet exchange. 5.3. Evaluation Table 6 presents the numerical efficiency ratings for the different adaptation policies. Headers, trailers, and interpacket gaps limit these numbers to 94%. The last column, “oracle”, represents the efficiency of a policy that picks the optimal packet size and FEC parameters for each packet based on advance knowledge, derived from the error trace, of the errors that the channel will inflict on the packet. While this is not a realistic policy, it provides a good reference point. Figure 7 shows the same data graphically: it shows, for each policy, its efficiency in different scenarios, normalized in each scenario to the efficiency of the “oracle” policy. The figure makes it clear that no single policy was best in all environments. In fact, almost all policies performed poorly (less than 70%) in at least one scenario. However, almost all policies scored 100% (i.e., highest efficiency) in at least one environment, suggesting that all policies have some merit.
Several fixed policies performed well in several environments. For example, “bold” performed acceptably in all but one case – even in the harsh “adjacent” environment, its large-packet gamble sometimes pays off well. The “light” policy, which represents a plausible fixed FEC policy, also performed well in all situations but one. “Robust” is the opposite of “light”, performing well in only the “table” case. Simplistic adaptation policies show more promise, especially in the “table” case, where almost every packet is lightly corrupted. The “table” row of table 6 shows that both “bimodal” and “bi-code” out-performed “bold” by an embarrassing amount and out-performed “light” by almost a factor of two. The “bi-size” policy shows that packet size is important in high-truncation environments: it performed nearly as well as the “bimodal” and “bi-code” except in the “table” case, where aggressive error coding is essential. Comparison among these three adaptive policies suggests that independently adjusting packet size and coding overhead is superior to linking them. For example, it is effective to adjust packet size and coding overhead for the “adjacent” environment, but it is better to adjust only the coding overhead in the “table” scenario. “Flex” independently adjusts packet size and coding overhead, and also incorporates longer-term channel history. The “flex” column of table 6 shows that, while “flex” is often not the star performer, it is always within 10% of
D.A. Eckhardt, P. Steenkiste / Adaptive error correction for a wireless LAN
the best performer for each trace. The above results clearly show that which policy performs best depends on the scenario. This raises the question of which policy one should implement. We argue that consistent good performance across a wide range of scenarios (as delivered by “flex”) is more important than being the best performer in any particular scenario. For example, the fact that “robust” performs best in the “table” scenario will do little to cheer up people working in “office” conditions. This argues that the adaptive policies, especially “flex”, are preferable to the fixed policies. 5.4. Summary We believe that the results of this section make a strong case that adaptive error control policies are both useful and practical. Any mobile host is likely to encounter each of these scenarios (among many others) in its lifetime, so being able to adapt the error policy is important; this type of adaptation is easy since it happens on a time scale of minutes. Both the “walking” and “adjacent” case involve adaptation inside the trace, and are more challenging since changes happen on a smaller time scale. However, the results show that it is possible to track even these rapid changes. While there is room for investigating a wider variety of information sources and measurement and estimation approaches, the simple “flex” policy seems likely to suffice in many common environments. 6. Implementation issues While our trace-based simulation demonstrates that adaptive error control can reduce error rates, sometimes dramatically, the question of how it is best implemented is more difficult to answer. The mechanisms we used in our evaluation, packet shrinking and FEC based on Reed–Solomon encoding, have the advantage that they can be implemented at a high level in the protocol stack. A low bandwidth implementation (up to a few megabits per second) may be feasible entirely in software. There are several ways of integrating these mechanisms in a complete system. A first solution is to expose the higher layers (layers 3 and higher) to the changes in the payload size caused by changes in FEC redundancy and packet size. Another option is to have the datalink layer export a fixed packet size, and to have the link driver fragment and reassemble packets as required; this would improve portability. Alternatively, appropriate adaptive error control could be pushed to the lower layers, and be integrated with the error control mechanisms that already exist in WaveLAN (appendix A). This is probably the preferred solution, since it can potentially yield the highest efficiency and be most transparent to host software. Finally, any implementation will have to consider interactions with the upper layers. Transport protocols and applications often try to adapt to changes in network conditions, e.g., available bandwidth, and these efforts may be
283
negatively affected by an adaptive error control layer. As others have pointed out [8], it is important to ensure that low-level adaptation policies are coordinated with higherlevel protocols to avoid duplication of effort. To that end, it would be useful if the adaptive error control mechanisms could give feedback to the upper layers about the status of the link. 7. Related work One area of related work is studies of error characteristics of wireless links. Others have presented summaries of WaveLAN error behavior [10,18,20]. We present more detailed information (characterization of errors into loss, truncation, and corruption, including error syndromes) which allows us to evaluate the impact of specific error control mechanisms (packet shrinking and FEC) and adaptation strategies. A study of dynamic adaptation to both channel noise and CDMA multiple access interference may be found in [12]. There is an effort to standardize the format of traces collected on wireless networks [19]. A standardized trace format will allow researchers to share traces more easily and will in making experiments more easily reproducible, allowing a more direct comparison of competing error control strategies. A second area of research is the design of higher level strategies to deal with the high error rates that may be found on wireless links. Examples are link-level retransmission, transparent protocol translators, and proxies inside the network that modify the behavior of the higher level protocols [3–9,32]. Our proposed adaptive error correction strategy may have a direct impact on these efforts. Our results suggest that local error correction or avoidance on the wireless link may in some cases reduce the error rates to the point that an unmodified transport level protocol can be used. In other cases, packet loss will remain too high, but the reduction in packet loss should simplify the task of the higher level protocol. Detailed trace information may be useful in designing and evaluating link-level strategies. A final area of related work is adaptive error control for wireless links. Satellite communication has been studied widely, and since error rates can be very high, satellite links make extensive use of FEC to improve communication performance [22,28]. In some cases, adaptive FEC is used, but the conditions are very different from those in wireless LANs: the causes and nature of the errors are very different, and the long roundtrip times means that adaptation is many orders of magnitude slower than in a LAN. The DARPA Packet Radio Network [13], a metropolitan-area mobile radio network designed to carry data and voice traffic, included a multi-rate FEC codec, although we are not aware of any published performance evaluation of this implementation. The Proxim RangeLAN frequency hopping system has two data rates, the primary rate of 1.6 Mb/s, and a secondary rate of 800 Kb/s, used to extend the usable range [25]. While having two symbol rates is more flexible than having only one, our results suggest that multiple
284
D.A. Eckhardt, P. Steenkiste / Adaptive error correction for a wireless LAN
rates would allow efficiency in more scenarios. In addition, selecting an appropriate symbol rate for each transmission requires an adaptation policy which could profit from evaluation similar to ours.
8. Conclusion In this paper we showed how forward error correction and packet shrinking can be used to reduce the error rates for the WaveLAN wireless LAN, and we demonstrated how the adaptive use of these techniques can optimize throughput in wireless LANs over a wide range of error environments. Even simple adaptive policies outperform static policies. The reason is that, due to mobility, a particular mobile computer may operate in error environments ranging from essentially error-free to very challenging. Since changes in the error environment are frequently caused by human actions occurring at a coarse time scale, tracking the changes is possible. While our trace data are from a particular wireless LAN, we believe that adaptive error control will be useful in a variety of wireless LAN environments, and that our approach to defining and evaluating adaptation policies will be useful as well. The evaluation of the above techniques is based on a trace-based evaluation. We collected a set of traces of an indoor wireless LAN under several conditions, ranging from error-free to strong interference from competing radiation sources. The simulator implements a number of adaptive policies and uses the error traces to model the errors that are inflicted on the packet stream obtained after adaptation. The simulator relies on the fact that errors are independent from the packet contents and packet size, so error traces collected using one packet stream can be used to model the errors in a stream that has packets with different contents and of a different (shorter) size. More work is required to achieve efficient, non-adversarial interaction with higher-layer protocols. The amount of responsibility that lower layers should shoulder is a topic of hot dispute. However, we believe that transporttransparent, wireless-specific adaptation is attractive given the difficulty for end-systems on different continents to share information on and react to status changes of multiple intermediate links of very diverse natures.
9. Acknowledgements The WaveLAN driver we modified was written by Bob Baron of the Coda research project. John Stonick of Oregon State University helped us understand details of the WaveLAN modulation scheme. Phil Karn provided useful advice and the Reed–Solomon codec implementation. The responsibility for any inaccuracies in this paper is, of course, ours alone. Amy Eckhardt and Doug Tygar graciously made long-term loans of cordless phones used to produce error traces.
This research was supported in part by the Defense Advanced Research Project Agency/ITO monitored by NRaD under contract N66001-96-C-8528. The views and conclusions contained here are those of the authors and should not be interpreted as necessarily representing the official policies or endorsements, either express or implied, of Carnegie Mellon University or the U.S. Government. Appendix A. WaveLAN WaveLAN [29] is designed to be an affordable, easyto-install wireless extension of an existing bridged Ethernet system. Products include ISA and PCMCIA network interfaces for PC-compatible computers and stand-alone WaveLAN-to-Ethernet packet bridges. They operate in either the 902–928 MHz or the 2.4–2.8 GHz ISM (Industrial, Scientific, and Medical) license-free band. The PCMCIA units comprise a Type II PCMCIA card and an external unit a little larger and heavier than a deck of cards. Internally, the WaveLAN interface contains a standard Intel 82593 single-chip CSMA/CD LAN controller, custom logic for signal processing and modem control, and a custom radio transceiver. The transmitter applies DQPSK modulation to a 2 megabit/s data stream, yielding a 1 megabaud signal. This signal is further modulated by an 11 chip per bit sequence (hence “direct sequence”) to produce an 11 MHz wide signal which is transmitted with a power of 500 milliwatts. The receiver selects between two perpendicular antennas and multiple incoming signal paths to combat multipath interference. The modem control unit prepends a 16-bit “network ID” to every packet on transmit, and can be set to reject all but one network ID on receive. In addition, it informs the host of the channel condition upon each packet arrival by reporting signal level, silence level, signal quality, and antenna selected for each packet. The signal and silence levels (5 bits) are derived from the receiver’s automatic gain control (AGC) setting just after the beginning and end of the packet, respectively. Because the MAC protocol discourages simultaneous transmission and immediately consecutive transmissions, measuring the silence level during an interpacket time is typically a good indication of the amount of non-WaveLAN background interference. The signal quality (4 bits) is sampled just after the beginning of the packet and is derived from the information the receiver uses to select between the two antennas. As it is difficult to detect collisions in this radio environment, WaveLAN employs a CSMA/CA (collision avoidance) MAC protocol [2]. In CSMA/CD, a station which becomes ready to transmit while the medium is busy will make its first transmission attempt as soon as the medium is free, based on the optimistic assumption that it is the only waiting station. If this assumption is wrong, all waiting stations will quickly learn their mistake by sensing a collision. Since WaveLAN cannot sense collisions, they result
D.A. Eckhardt, P. Steenkiste / Adaptive error correction for a wireless LAN
in packet losses which must be dealt with by higher layer protocols. WaveLAN CSMA/CA attempts to avoid collision losses by treating a busy medium as a collision. That is, any stations which become ready to transmit while the medium is busy will delay for a random interval when the medium becomes free. Aside from the modified MAC protocol and lower data rate, the 82593 performs all standard Ethernet functions, including framing, address recognition and filtering, CRC generation and checking, and transmission scheduling with exponential backoff. Many of the techniques cellular radio systems [16,23,24] employ to re-use frequencies in nearby areas, such as power control, frequency diversity and code diversity, are easiest to employ in a point-to-point environment. Since WaveLAN follows the Ethernet protocol, where stations multicast to dynamic sets of peers rather than communicating exclusively with a central base station, it would be difficult to estimate the power required to contact a particular set of receivers for each packet transmission, and expensive or complex to synchronize with many stations each using a different spreading sequence. Perhaps for these reasons, WaveLAN does not provide the ability to vary transmit power and does not use frequency or code diversity. Instead, it gives receivers the ability to mask out weak signals through programmable threshold values for signal level and quality, which improves throughput and may be sufficient to simulate cell boundaries in some cases even though WaveLAN is inherently a single shared channel. In addition, the “network ID” provides multiple logical Ethernet address spaces, which allows WaveLAN-to-Ethernet bridges to use standard bridge routing protocols. B. Content insensitivity
285
depends heavily on this feature, we decided to experimentally validate it. Clock synchronization can be impaired by long runs of all-one or all-zero bits. Furthermore, indoor high-speed wireless LANs may suffer from inter-symbol interference, which occurs when a delayed echo of one symbol interferes with the arrival of the next symbol. We also wished to determine whether error events might force whatever bit was being transmitted to a certain value, or alternatively might invert whichever bit was being transmitted. To evaluate whether WaveLAN errors are sensitive to packet contents, we chose a set of packet bodies whose contents vary significantly and then observed whether they exhibited different error behavior. We chose the 128-bit and 1024-bit Hadamard–Walsh codes [27], sets of orthogonal code words generated by a recursive algorithm (see figure 8). We augmented the sets by adding an all-zero code word. Each set of codes includes a wide variety of run lengths and alternation patterns (for example, H4 contains runs of length 1, 2, and 4). These sets are extensive but clearly not exhaustive. By aggregating multiple trace runs from each of the interference scenarios, we collected approximately 270,000 packets, or about 2100 apiece of each of the 129 different content types, representing roughly 20 minutes of network activity. To evaluate whether the error rates are sensitive to packet contents, we calculated the percentage of packet types (yaxis) that exhibit a certain error rate for different error rates (x-axis), over the aggregated trace data from the above runs. The results are shown in the histograms in figure 9. Note that these graphs capture the type, but not the degree, of damage. To the extent that WaveLAN errors are insensitive to packet contents, we would expect all packet types to be harmed at the same rate, yielding narrow histograms, shaped roughly like normal curves, with no outlying points. We believe that the data presented here support this assumption. Based on these results, we assume in section 5.1 that errors are insensitive to packet contents, so bit corruption and truncation patterns can be collected and then applied in a meaningful way to a packet stream with different contents. C. FEC background
Figure 8. Walsh functions.
Given the particular coding used in WaveLAN,1 one would expect error characteristics for a particular experiment to be independent of the particular data contents. Since the correctness of our methodology of applying error traces collected using one data stream to other data streams 1
WaveLAN effectively transmits an 11-“chip” sequence for each bit, resulting in many transitions regardless of user data; the WaveLAN designers expected indoor multipath delay of up to 250 nanoseconds [29], approximately one quarter of a dibit symbol time, which would mean that most inter-symbol interference would be between chips belonging to a single dibit.
Forward Error Correction is a fairly mature field and this paper makes no contributions in that area. However, since we rely on FEC, we include a short overview of the field for the benefit of readers unfamiliar with the area. The field of FEC is constructed on a firm mathematical foundation, and there are closed-form solutions for the behaviors of many codes under a variety of error models. Error coding books exist at several levels of abstraction: handbooks [21], introductory approaches [1], and in-depth studies [17,31]. Error codes exist for many different applications, including erasure channels (which can blot out a symbol rather than corrupting it), asymmetric channels (which may tend to force symbols to certain values more than others), and burst error channels (which tend to corrupt symbols in clumped or bursty patterns).
286
D.A. Eckhardt, P. Steenkiste / Adaptive error correction for a wireless LAN
independent of every other block. In some block codes, the block size is directly related to the symbol size. That is, if a transmission channel accepts (and therefore corrupts) two-bit symbols, the block size will be a multiple of two bits. Encoding and decoding block codes typically involves matrix algebra and/or polynomial arithmetic. The ratio of extra symbols to user symbols within a transmitted block may be adjusted smoothly to meet the needs of a particular application. Convolutional codes, on the other hand, operate on data streams or on variable-sized blocks (above a typically small minimum size). The encoder is a simple linear-feedback shift register, similar to a CRC generator. The effect of the encoder is that each user symbol is “smeared” across some number of transmission symbols (based on the length of the shift register). Convolutional codes have correction and detection thresholds analogous to those of block codes, but these thresholds are related to the number of corrupted symbols within the “smearing window”, which is typically on the order of tens of bits. Convolutional code redundancy overheads are typically a small integer multiple of the user data size (block code overheads are often fractional), though there are “punctured” convolutional codes which allow submultiple overhead amounts. While convolutional codes are not as straightforwardly robust in the face of burst errors, they have several attractive features: • They do not impose any data blocking on applications. • They can be implemented cheaply and efficiently in hardware. Multi-rate codecs which operate at transmission rates of tens of megabits are commercially available as VLSI components. • They can easily take advantage of “soft decision” demodulation, in which the demodulator provides the decoder not only with the most likely symbol given the arriving signal but also the likelihood that this symbol is correct. Soft-decision decoding typically yields an increase in performance roughly equivalent to doubling the transmission power.
Figure 9. Histogram of per-packet-type loss rates (top), truncation rates (middle), and truncation rates.
One important distinction is between block codes and convolutional codes. A block code operates by accepting a block of user data, typically of fixed size, and adding a certain number of extra symbols to the block. As long as the number of transmission errors per block is under a certain threshold, the receiver will be able to correctly recover the original user data. If the number of errors exceeds the correction threshold, but is below a detection threshold, the receiver will be able to report that a block is corrupted. Otherwise, the receiver may incorrectly believe that an entirely different block was sent. The fate of each block is
For the purposes of this paper, we will employ a Reed– Solomon block code. This decision is based on several reasons. First, the WaveLAN hardware presents us with a “hard decision” environment; that is, it provides us with bits, but not with bit certainty estimates, so we cannot take advantage of soft decision decoding. Second, Reed–Solomon codes can operate with a symbol size of 8 bits. This is attractive for software implementations, as byte operations are typically more efficient than bit operations, and network packets are typically an even number of bytes long. Third, the performance of Reed–Solomon codes, as with other linear block codes, is insensitive to the particular user data bits (and we have demonstrated that the underlying channel probably is, too). While production systems will often choose convolutional codes to obtain the benefits of soft-decision decoding, the adaptation issues presented by a multi-rate codec are similar whether the code is block or convolutional.
D.A. Eckhardt, P. Steenkiste / Adaptive error correction for a wireless LAN
References [1] B. Arazi, A Commonsense Approach to the Theory of Error Correcting Codes (MIT Press, 1988). [2] Data Manual – WaveLAN Air Interface, No. 407-0024785, Rev. 2, AT&T Wireless Communications and Networking Division, AT&T Corporation (July, 1995). [3] B.R. Badrinath, A. Bakre, T. Imielinski and R. Marantz, Handling mobile clients: A case for indirect interaction, in: Proc. of IEEE WWOS-IV, Napa, CA, IEEE Press (1993) pp. 91–97. [4] A. Bakre and B.R. Badrinath, I-TCP: Indirect TCP for mobile hosts, in: Proc. of the 15th Int. Conf. on Distributed Computing Systems (1995) pp. 136–143. [5] A. Bakre and B. Badrinath, Implementation and performance evaluation of indirect TCP, IEEE Trans. on Computers 46 (1997). [6] H. Balakrishnan, V.N. Padmanabhan, S. Seshan and R.H. Katz, A comparison of mechanics for improving TCP performance over wireless links, IEEE/ACM Trans. on Networking (December 1997). [7] H. Balakrishnan, V.N. Padmanabhan, S. Seshan, M. Stemm, E. Amir and R.H. Katz, TCP improvements for heterogeneous networks: The Daedalus approach, in: Proc. of the 35th Annual Allerton Conf. on Communication, Control, and Computing (1997). [8] A. DeSimone, M.C. Chuah and O.-C. Yue, Throughput performance of transport-layer protocols over wireless LANs, in: Proc. of IEEE GLOBECOM ’93 (1993) pp. 542–549. [9] D. Duchamp and A. Athan, Agent-mediated message passing for constrained environments, in: Proc. of the USENIX Mobile and Location-Independent Computing Symposium, USENIX Association (1993) pp. 103-107. [10] D. Duchamp and N.F. Reynolds, Measured performance of a wireless LAN, in: Proc. of the 17th Conf. on Local Computer Networks, IEEE (1992) pp. 494–499. [11] D. Eckhardt and P. Steenkiste, Measurement and analysis of the error characteristics of an in building wireless network, in: Proc. of the SIGCOMM ’96 Symposium on Communications Architectures and Protocols, Stanford, ACM (1996) pp. 243–254. [12] J. Escobar, Run-away dynamics of CDMA channels in an adaptive packet radio network, Wireless Networks 1 (1995) 37–46. [13] J. Jubin and J.D. Tornow, The DARPA packet radio network protocols, in: Proc. of the IEEE (January 1987) pp. 21–32. [14] S. Kallel, Efficient hybrid ARQ protocols with adaptive forward error correction, IEEE Trans. on Communications 42 (1994) 281–289. [15] P. Karn, Error Control Coding (September 1996), http://people. qualcomm.com/karn/dsp.html. [16] P. Karn, The Qualcomm CDMA digital cellular system, in: Proc. of the USENIX Mobile and Location-Independent Computing Symposium, USENIX Association (1993) pp. 35–39. [17] S. Lin and D.J. Costello, Error Control Coding: Fundamentals and Applications (Prentice Hall, 1983). [18] G.T. Nguyen, R.H. Katz, B. Noble and M. Satyanarayanan, A tracebased approach for modelling wireless channel behavior, in: Proc. of the Winter Simulation Conf. (1996). [19] B. Noble, G. Nguyen, M. Satyanarayanan and R. Katz, Mobile network tracing, Internet RFC 2041 (September 1996).
287
[20] B.D. Noble, M. Satyanarayanan, G. Nguyen and R.H. Katz, Tracebased mobile network emulation, in: Proc. of the ACM SIGCOMM Conf., Cannes, France (1997). [21] J.P. Odenwalder, Error Control Coding Handbook, Final Report (LINKABIT, San Diego, CA, July 1976). [22] Q1650 k = 7 Multi-Code Rate Viterbi Decoder technical data sheet, Qualcomm, Inc., 6455 Lusk Boulevard, San Diego, CA 92121-2779 (1992). [23] Proposed EIA/TIA Interim Standard: Wideband Spread Spectrum Digital Cellular System–Dual-Mode Mobile Station–Base Station Compatibility Standard, No. 80-7814, Rev DCR 03567, Qualcomm Inc., San Diego, California (April 1992), accepted as TIA IS-95. [24] K. Raith, E. Lissakers, J. Uddenfeldt and J. Swerup, Cellular for personal communications, in: Wireless Personal Communications (Kluwer, 1993) pp. 1–20. [25] RangeLAN2 Tech. Guide, available at http://www.proxim.com/ support/techtips/techgd.shtml. [26] T. Rappaport, Characterization of UHF multipath radio channels in factory buildings, IEEE Trans. on Antennas and Propagation (August 1989) 1058–1069. [27] T.S. Rappaport, Wireless Communications: Principles and Practice (Prentice Hall, 1996). [28] F.A. Tobagi, R. Binder and B. Leiner, Packet radio and satellite networks, IEEE Communications (November 1984) 24–40. [29] B. Tuch, Development of WaveLAN, an ISM band wireless LAN, AT&T Technical J. (July/August 1993) 27–37. [30] A.J. Viterbi, Spread spectrum communications – myths and realities, IEEE Communications Magazine 17 (1979) 11–18. [31] A.J. Viterbi and J.K. Omura, Principles of Digital Communication and Coding (McGraw-Hill, 1979). [32] R. Yavatkar and N. Bhagawat, Improving end-to-end performance of TCP over mobile internetworks, in: Mobile ’94 Workshop on Mobile Computing Systems and Applications (1994).
David A. Eckhardt is a Ph.D. candidate in the School of Computer Science at Carnegie Mellon University, where he has already received a M.S. in computer science. He received a B.S. in computer science, with a minor in political science, from The Pennsylvania State University in 1989. His research interests are in the areas of wireless and high-performance networking. He is a member of the IEEE Computer Society. E-mail:
[email protected]
Peter A. Steenkiste is a Senior Research Scientist in the School of Computer Science at Carnegie Mellon University. He received the degree of electrical engineering from the University of Ghent in Belgium in 1982, and M.S. and Ph.D. degrees in electrical engineering from Stanford University in 1983 and 1987, respectively. His research interests are in the areas of high-performance networking and network quality of service. He is a member of the ACM and the IEEE Computer Society. E-mail:
[email protected]