well as program data analysis tasks is necessary. In ... a browser, a visual language editor for processes and ... data analysis programming ability is necessary.
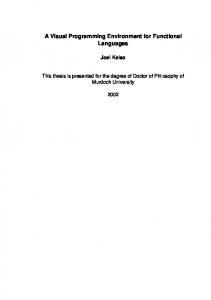
A Visual Programming Environment for Supporting Scienti c Data Analysis � Yuhong Zhang, Matthew Ward, Nabil Hachem, and Michael Gennert Computer Science Department Worcester Polytechnic Institute
Abstract
that provides users both data management ability and data analysis programming ability is necessary. The objective of our research is to use visual techniques in an integrated data analysis and management support system to provide scientists with a complete research environment. Gaea, a scienti c database management system for supporting geographic information analysis and global change research, is a project under development at the Computer Science Department of Worcester Polytechnic Institute [9]. Gaea is designed as an integrated data and analysis management system. It has two components; the Gaea Kernel provides the database management support, while the GaeaVE is a visual environment that provides its users with the ability to program their tasks and to perform management functions over data, operators, and experiments. A visual environment is a programmingenvironment in which the programming task is made easier for users by using visual representations in the speci cation and control of computer systems [19]. Several visualization systems provide visual environments for supporting data analysis, including IRIS Explorer [20], Khoros [23], and AVS [22, 1]. Similarities between these systems include:
Our research on a conceptual model for scienti c data analysis concludes that traditional computational and environmental support is insu�cient. We believe an integrated system that provides users with the ability to manage data, processes, and experiments as well as program data analysis tasks is necessary. In this paper the scienti c data analysis process in global change research is analyzed and the development of GaeaVE, a visual environment for a scienti c database management system for global change research, is described. The components of the environment consist of a browser, a visual language editor for processes and experiments, and a data viewer.
1 Introduction Scienti c data analysis is the process whereby scientists from various disciplines apply mathematical, logical, and analytical methods to data to generate new information or knowledge in their disciplines [16, 11]. Data analysis is a critical phase in scienti c research, and managing experiments and the data produced throughout an experiment life-cycle has become a bottleneck of many experimental studies[13]. Current computerbased support systems for scienti c data analysis can be found in two areas: Scienti c Databases and Scienti c Visualization. Scienti c Databases are a relatively new research direction in database management systems development, where the data management issues such as data storage, data access, and data query techniques are studied. Scienti c Visualization has a longer history, where many visualization techniques have been developed and organized into various software systems. One problem with current support systems is that there is no uniform environment for scientists to conduct research without having to learn many di�erent software systems. We believe that an integrated system � This
� � �
�
Providing both visualization and analysis functionality. Providing an extensible data processing and data visualization library. Allowing users to build custom applications without writing code in a traditional programming language. Using data- ow diagrams as the analysis programming language as well as other visual techniques in the user interface.
In the use of visual representations, the systems mentioned above have many good ideas which are being incorporated into GaeaVE. IRIS Explorer uses process
work was partially supported by NSF contract IRI-
9116988
1
menu icons in a data ow diagram to make the speci cation of a particular process an easy and intuitive task. AVS makes three major display processes into data viewers: the geometry viewer, the image viewer and the graph viewer. In this way, the interface provides users at di�erent levels a di�erent working environment. An application user, who uses only the existing processes, does not have to know the detailed procedure for de ning a new task. In AVS, operators are categorized by function, and color is used to indicate input and output data types. The goal of Khoros is to integrate research programming, end-user application programming, information processing, data visualization, instruction, documentation, and maintenance all in one software environment. Within the context of scienti c database management systems, there are numerous examples of visual interfaces for geographical information systems or global change research [5, 7]. These systems improve user interfaces by allowing direct-manipulation of spatially related information. The programminglanguages used are still textual. In [3, 14], some database issues related to geographic information systems are addressed and visual techniques are used for query speci cation. The focus of all the above systems are restricted to only parts of a complete scienti c data analysis system. To clearly present the de ciencies of these systems, the conceptual model of scienti c data analysis and its supporting requirements have to be investigated.
Data collection and processing
Set up computational model
Execute computational model
Interpretation of results
Figure 1: Life-Cycle of Data Analysis [11]. alternately. Operator nodes represent the analysis or processing operations applied to data. Data nodes represent information used or generated by operators. A more detailed description, based on a Petri net model of data, can be found in [10]. Data_1
Op_1
Data_3
Op_3
Data_2
Op_2
Data_5
Data_4
operator node data node
Figure 2: Diagram of an Analysis Process.
2 Scienti c Data Analysis and Supporting Requirements
A process is actually just a template; the data types, operators, and ow of execution are speci ed, but not the physical data sets to be used. The combination of a process with a speci c set of data de nes an experiment. It is clear that a relationship exists between experiments which share the same processes but differ in the data sets used. Similarly, di�erent processes can generate data which are related at some level of abstraction. We refer to this relationship as a concept, and each data set in our system is associated with a particular concept. Considering the elationships between these components of a data analysis experiment, the data analysis model is modi ed as shown in Figure 3. A data model consisting of concepts and data objects is generated and modi ed in a data analysis experiment. The interpretation of results is based on this model and controls the iteration of the the experiment. Based on our study of the data analysis model, several observations may be made: � In an experiment, the role of processes is as important as the role of data. In a process, the role
The process of scienti c data analysis has been widely studied [16, 11, 21]. One generalized model of data analysis, de ned by Hick [11], involves four phases: collect and process data, set up a computational model, execute the computational model, and interpret the results. The procedural description of the model is shown in Figure 1. The real research process may repeat these phases many times before a satisfactory result or conclusion is obtained. Further analysis of this model has led us to the development of an enhanced conceptual framework for data analysis. We refer to a single iteration of the data analysis task in Figure 1 as an experiment. The purpose of an experiment is to generate new knowledge about a discipline from the data and knowledge that are available. We call the computational model in the second phase of Figure 1 a process. A process can be described by a ow diagram as shown in Figure 2. In a process ow diagram, two kinds of nodes are placed 2
Classification
fair level of sophistication from users, as they have to know what the processes do and what they are named. In some cases, when the experiment is small and the data used in the experiment is simple, this mode of operation is acceptable. But in a more general case, information may be shared among scientists, so more sophisticated methods of managing data, processes and experiments have to be provided. The second problem is that in most current systems, only processes are represented explicitly in the user interface. Data are speci ed simply as parameters to processes, and experiments and concepts are not supported at all. These de ciencies are being addressed in the design of the GaeaVE. We take research in geographical information systems and global change as an example of scienti c research. Our analysis of properties involved in this research supports our conclusions above. There are three additional signi cant properties of data in global change research [9]: � Spatial Data Spatial data are one or more dimensional structured data. Spatial data types are not as simple as those found in conventional database systems. In [8], spatial data are de ned as n-dimensional data with explicit knowledge about objects, their extent and position in space. Such an object can be a city that is made up of streets and buildings. Data representing a city have a molecular structure. Spatial data introduces a diverse set of data types, such as points, line segments, and regions. Since spatial data have a more complex structure than conventional data, the properties of spatial data and their relationships are more complex. The operators and predicates which characterize those properties and relationships are, of course, richer. The operations on conventional data consist of numerical computation or alphanumeric comparison, and the only relationships supported are equality and ordering. Spatial data relationships and operations include containment, overlay, neighborhood, and distance. � Temporal Data Data with temporal attributes is the basis of global change research. The understanding of time di�ers among scientists [18]. It is hard to give a de nition of temporal data without de ning a particular point of view. Temporal data structures and operators can only be discussed after a temporal data model is created. One possibility is to treat temporal data in the same manner as one-dimensional spatial data. In this model, time is de ned as a
Collection
Data Collection and Processing
Interpretation of Results
Concepts
Data Objects
Data Model
Set up Computational Model
Execute Computational Model
Figure 3: A Modi ed Data Analysis Conceptual Model.
�
�
of operators is as important as the role of data. There are always concepts behind data, but without interpretation, concepts behind data cannot be seen. The process applied to original data de nes the semantics (concepts) of the nal output data of that sequence. Experimentation is an iterative process. Data generated from an experiment can be used to generate new concepts and enhance old concepts.
From the above observations, we can develop speci c requirements for supporting data analysis through an easy-to-use user interface: � �
�
�
�
The interface should clearly represent concepts, data, processes, and experiments. The interface should provide users intuitive ways of manipulating information, including the management of data, processes , and experiments. Generating and executing an experiment should be easy, so iteration and repetition will be facilitated. Information regarding experiments, processes, concepts, operators, and data should be available at any stage of an experiment. Information should be able to be visualized for the purpose of interpretation.
Now let's look at the de ciencies with the visualization systems discussed in rst section. First, information about data, processes and experiments are assumed to be understood by users. For example, selecting a process from the process library requires a 3
Mauritania
1977
reclass
scale
1= 0.01
*0.01
Mauritania
overlay
1977 Positive overlay
Image ratio
transform Visualized
1977/1979 overlay
image
Mauritania
1979 Positive
Mauritania
1979
reclass 1= 0.01
scale *0.01
Figure 4: An Example of an Experiment: Image Ratioing.
3 The GaeaVE System
set of points or intervals, and operators analogous to those found in spatial data may be used. � Diverse Data User Interface Management Another property of data in GIS and global change Browser research is that spatial data, non-spatial data, temporal data, and non-temporal data are all involved [6]. This encourages us to consider spatial Task Executor Process Editor Data Viewer data, temporal data, and attribute data in a consistent and uni ed fashion rather than independently. As an example of a scienti c experiment in global Visual Language Query Generator change research, Figure 4 shows the process of image Interpretor ratioing [4]. We are only interested in the process that Visual Language Processing a data analysis follows. The details of this process applied to global change research are presented in [4]. In this work, NDVI (Normalized Digital Vegetation InGaea Kernel dex) data is the original concept. The images from 1977 and 1979 for an area of Mauritania along the Figure 5: The GaeaVE System Organization. Senegal River are instances of this concept, and ratioing is the process. The objective is to illustrate a new concept (NDVI ratio) and an instance of this concept The GaeaVE system organization is shown in Figure 5. (for Mauritania in 1977/79) after applying a process of The current version of GaeaVE can be summarized as some pairwise comparison techniques using data on a follows: large scale. The analysis process is as follows. � Use di�erent visual variables (eg. color, icons and 1. Process NDVI data of both 1977 and 1979 to conwindows) to di�erentiate between di�erent comsist of only positive values. The operators used ponents of scienti c data analysis (i.e. concepts, include reclassify, scale, and overlay. data, processes, experiments, etc.) and represent the relationships between those components. 2. Apply functions on data generated in Step 1 to do ratioing. The operators used are overlay, image � Provide a programming environment that interratio, and transform. prets scientists' data analysis activity intuitively and handle both data and process management 3. Apply more functions on data generate in Step 2 requests. to examine data. The operators used are examine, reclassify, and visualize. � Provide a browser that can be driven according to 4. Describe the results or conclusions based on the users' conceptual models to retrieve information examination in Step 3. stored in the database. 4
� �
Provide special mechanisms for the speci cation of spatial and temporal objects and relations. Provide a consistent view of all components across di�erent levels of abstraction and phases of operation.
temporal extents. An example is shown in Figure 7. Browsing Target
3.1 Visual Browsing
Concepts
The browsing system supports retrieval of all information stored in the application database system. GaeaVE supports multiple ways of information browsing. � Browsing data and process semantics The derivation semantics of data is de ned by the process that is used to generate that data. On the other hand, the semantics of a process are de ned by the input data and output concepts for that process and the operators it employs. From this point of view, browsing methods include identifying data available to be used by a process and identifying processes available to work on a piece of data. An example is shown in Figure 6.
Processes
Time 1970
Space
Processes
Concepts
Inputs:
1978
1982
1986
1990
1994
Browsing data and processes in the conceptual model Besides the derivation semantics, concepts in the application conceptual model can drive users' browsing activities. Typical questions to ask in the browser include how a concept is de ned, and what data and process are associated with a certain concept.
3.2 Visual Analysis Programming
Processes Output:
The GaeaVE's programming environment has two major components: a process editor and a task (experiment) executor. In the process editor, a process can be de ned or modi ed, while in the task executor, an experiment can be set up and executed. Both processes and experiments are speci ed using data ow diagrams as the programming language. A data ow programming language is more suitable than other programming language styles, since data ow diagrams on paper are frequently used by scientists before any data analysis via the computer [2, 12, 15, 17]. One major di�erence between the GaeaVE data ow language and most other data ow languages is that data as well as processes are represented as nodes. Di�erent node representations are used for data nodes and process nodes. This way, data and processes take equivalent positions in the appearance of an experiment. Users can switch their points of interest between data
Time
Figure 6: Semantic Browsing: The input and output information is in a popup window and the data available is highlighted in the concept window. �
1974
Figure 7: Spatial Browsing: The result of a browsing request is highlighted in the space window, the conditions are speci ed in other windows using a di�erent color. �
Browsing Target
Space
Spaces
Browsing data or concepts in time and space Data has multiple aspects: spatial, temporal and attribute. For viewing these aspects, browsing is accomplished by specifying one or two of the three aspects and displaying what, if any, data are available meeting the speci ed constraints. Thus the user can determine, for example, what types (attributes) of data are available for a given region and period of time by identifying the spatial and 5
Shading is used to represent the existence of a data object. A shaded icon represents an existing data object. A nonshaded icon means that either the data object does not exist or the data object has not been su�ciently speci ed to refer to a unique data object. Shading is also used for processes to transform indicate if a process is ready to execute. A shaded reclass process has all input data to execute, An unshaded process is still expecting more data. overlay compound operator � Flashing animation is used to show the execution scale of a process or experiment. A common problem of visual languages is that the screen space is so limited that not all information can be shown. Generally, in scienti c research, the average size of the data ow diagram will t in a reasonably sized computer screen. Even in large experiments, scienti c research activity usually focuses on one part of a detailed process rather than on the whole experiment. GaeaVE uses strategies such as sliding windows and Figure 8: A Program Written in the Gaea Visual Lan- iconi cation to increase the utilization of the screen. guage. and processes easily. Figure 8 shows the visual program for the global change research experiment example shown earlier.
m77
p77
ratio 77-79
m79
�
image
p79
3.3 Data Visualization
In a data- ow diagram, whenever all the input data for a process has arrived or an input data is updated, the process will be executed and will generate output to all the nodes to which it is connected. In GaeaVE, this can be done both automatically (as in AVS) or manually as users desire. In the GaeaVE programming environment, separating the process editor and the task executor is to distinguish between processes and experiments. In both the process editor and the task executor, common components, such as a particular data object or attribute type, are represented using the same icon. In the GaeaVE browser, di�erent window areas and icons are used for data, processes, space, time, and concepts. The general use of visual variables is summarized below: �
Icons or shapes are used to di�erentiate between distinct components. For example, in the task executor, a rectangular icon represents a data class and a circular icon represents a process. Icon bitmaps are designed to convey object semantics, and a key to interpretation is available on demand.
�
Color is used to indicate the di�erence between instances of a concept. For example, in one concept, di�erent data instances are colored di�erently. Color is also used in the process editor to associate attributes of a concept. Attributes of the same color are properties of the concept sharing that color.
For data visualization, the GaeaVE provides a data viewer. Data with various types, such as tabular data, image data, and geometry data, can be viewed using a set of visualization techniques. Users can interactively specify the parameters for visualization operators. The results of visualization can be used for specifying spatial extents or location, data types, or temporal intervals or points for use by the Browser. Since much of the data that Gaea deals with have a spatial property, the GaeaVE provides a general support for representing spatial data. Maps are the traditional tools used by global change researchers to represent spatial data. In recognition of this, spatial speci cation in GaeaVE is accomplished via map representation and manipulation. However, simply generating a map representation from an image or a vector form is insu�cient to support scientists' research activities. More sophisticated map manipulation tools are supported. For each map display, the set of manipulation functions includes: � Selecting { Getting a point or region in image or world coordinates. � Rescaling { Selecting display at di�erent scales. � Repositioning window { Selecting display for locations of interest. � Changing Attributes { Changing the display appearance by specifying display variables, such as color, symbol icons, etc. 6
Overlaying { Displaying two or more maps for the same area in a single display. Figure 9 shows a map displaying political boundaries.
In this paper, we have outlined our view of the data analysis and management needs for scienti c data analysis in the global change research eld and our progress towards addressing these needs. The Gaea system, currently under development, integrates the management of experiments, processes, data, and operators in a single environment. We believe the Gaea Visual Environment contributes signi cantly towards the requirements of scienti c data analysis by supporting visual programming at both the process level and experiment level, presenting clear visual representations of data, processes, and concepts, and providing a powerful database browser.
�
display select zoom overlay erase color highlight
References [1] Advanced Visual System Inc., 300 Fifth Avenue, Waltham, MA 02154. AVS Technical Overview, October 1992. [2] J. J. Birchman and S. L. Tanimoto. An implementation of the viva visual language on the next computer. In 1992 IEEE Workshop on Visual Languages, pages 177{183, Seattle, Washington, September 1992.
Figure 9: Spatial Data Representation. The temporal aspect in data is also important in global change research and is one of the critical issues in the Gaea project. It is the responsibility of the GaeaVE to support visualization of change and other time-related properties. The Gaea system treats time analogously to one-dimensional spatial data. According to this abstraction, time is represented as a onedimensional axis in the GaeaVE. functions include: � Selecting { Selecting time point (a point on display) or time period (a segment on display). � Rescaling { Changing granularity of time. � Repositioning { Changing the time period being displayed.
[3] E. Clementini, A. D'Atri, and P. Di Felice. Browsing in geographic databases: an object-oriented approach. In 1990 IEEE Workshop on Visual Languages, pages 125{131, Skokie, Illinois, October 1990. [4] J. R. Eastman and J. E. McKendry. Explorations in Geographic Information Systems Technology. UNITAR European O�ce, Switzerland, 1991. [5] M. J. Egenhofer. Manipulating the graphical representation of query results in geographic information systems. In 1990 IEEE Workshop on Visual Languages, pages 119{124, Skokie, Illinois, October 1990.
4 Research Status and Conclusion
[6] A. U. Frank. Properties of geometric data: Requirements for spatial methods. In Advances in Spatial Databases, 2nd symposium, SSDSD'91, Zurich, Switzerland, August 1991. Spring-Verlag.
At present, each of the components of the GaeaVE has been prototyped and independently tested. Current e�orts are focussed on establishing communication links between the independent components so that, for example, the browser may pass information regarding data or operators to the process editor and attributes from a data visualization may be used by the browser to specify new queries to the database. Work is also underway at developing methods for capturing, managing, and displaying semantics (concepts) from experiments.
[7] P.-C. Goh. A graphical query language for cartographic and land information systems. SIGMOD RECORD, 19(4):61{68, December 1990. [8] O. Guenther and A. Buchmann. Research issues in spatial database. SIGMOD RECORD, 19(4):61{ 68, December 1990. 7
[9] N. I. Hachem, M. A. Gennert, and M. O. Ward. [21] Rebecca R. Springmeyer, Meera M. Blattner, and A DBMS architecture for global change research. Nelson L. Max. A characterization of the scienIn Proceedings of ISY Conference on Earth and ti c data analysis process. In 1992 IEEE WorkSpace Science, Pasadena, CA, 1992. shop on Visual Languages, Seattle, Washington, September 1992. [10] N. I. Hachem, K. Qiu, M. A. Gennert, and M. O. Ward. Managing derived data in the Gaea Scien- [22] Craig Upson, Thomas Faulhaber, David Kamins, David Laidlaw, David Schlegel, Je�rey Vroom, ti c DBMS. Worcester Polytechnic Institute ComRobert Gurwitz, and Andries van Dam. The appliputer Science Department Technical Report Numcation visualization system: A computational enber WPI-CS-TR-08, 1992. vironment for scienti c visualization. IEEE Computer Graphics and Applications, 9(4):30{42, July [11] C. R. Hicks. Fundamental Concepts in the Design 1989. of Experiments. Holt, Rinehart and Winston, New York, NY, 1982. [23] Carla. S. Williams and John. R. Rasure. A visual language for image processing. In 1990 [12] Daniel D. Hils. Visual languages and computIEEE Workshop on Visual Languages, pages 86{ ing survey: Data ow visual programming lan91, Skokie, Illinois, 1992. guages. Journal of Visual Languages and Computing, 3(1):69{101, March 1992. [13] Y. E. Ioannidis, M. Livny, and E. M. Haber. Graphical user interfaces for the management of scienti c experiments and data. SIGMOD Record, 21(1):47{53, March 1992. [14] E. Jungert. Towards a visual query language for an object-oriented geographical information system. In 1990 IEEE Workshop on Visual Languages, pages 132{137, Skokie, Illinois, October 1990. [15] J. Kodosky, J. MacCrisken, and G. Rymar. Visual programming using structured data ow. In 1991 IEEE Workshop on Visual Languages, pages 34{ 39, Kobe, Japan, October 1991. [16] P. D. Leedy. Practical Research: Planning and Research. Macmillan Publishing Co. Inc, New York, NY, 1980. [17] Thomoas J. Olson, Nicholas G. Klop, Mark R. Hyett, and Shawn M. Carnell. Mavis: A visual environment for active computer vision. In 1992 IEEE Workshop on Visual Languages, pages 170{ 176, Seattle, Washington, September 1992. [18] K. Qiu, N. I. Hachem, M. O. Ward, and M. A. Gennert. Providing temporal support in data base management systems for global change research. In Proceedings of SSDM 92, Switzerland, 1992. [19] N. C. Shu. Visual Programming. Van Nostrand Reinhold Company, New York, NY, 1988. [20] Silicon Graphics Computer Systems, Mountain view, CA. IRIS Explorer, 1991. 8