The results obtained on at-sea recorded data during the INTIFANTE'00 sea trial will be shown to support the expectations. 1 Introduction. The underwater ...
VIRTUAL TIME REVERSAL IN UNDERWATER ACOUSTIC COMMUNICATIONS: RESULTS ON THE INTIFANTE’00 SEA TRIAL. PACS: 43.60.Dh S.M. Jesus and A.J. Silva SiPLAB - FCT, University of Algarve Campus de Gambelas, PT-8000 Faro, Portugal, Tel: +351289800951, Fax: +351289818560, E-mail: {sjesus,asilva}@ualg.pt
Abstract Underwater acoustic communications in waveguides is known to be prone to severe multipath, which strongly limitates practical transmission rates with actual equalization techniques. The virtual Time Reversal Mirror (vTRM) principle uses the actual response of the ocean waveguide to attempt to reduce the multipath structure which, under ideal conditions, allows for environment independent signal extraction. One of the known limiting factors is the time stability of the acoustic channel. This paper focuses essentially in two aspects: one, is to demonstrate the potential application of the vTRM approach to undo the severe intersymbol interference in a real variable geometry channel scenario and, the other, is the variability of detection performance with symbol rate and source array distance. The results obtained on at-sea recorded data during the INTIFANTE’00 sea trial will be shown to support the expectations.
1
Introduction
The underwater acoustic channel is extremely adverse to high throughput communications. For a shallow water waveguide, the most imparing effects are the surface and bottom reflections (multipath) and the rapid signal attenuation with range. Multipath is responsible for a continuous symbol superposition at the receiver making it difficult to detect the transmitted message - that is known as Intersymbol Interference (ISI). At short range there are only a few paths: one direct, one surface and one bottom reflected that is, if the geometry is known, arrival times can be easily predicted leading to possible multipath separation at the receiver. When range increases to practical useful distances of a few kilometers, the received signal becomes a combination of a large number of bottom and surface reflections whose arrival times, due to medium inohomogeneities and bottom and surface roughness, are fairly difficult to accurately predict. After a given source-receiver range, the signal attenuation effect becomes dominant, thus limiting the number of multipath by volume and bottom attenuation, i.e., their amplitude is below the background noise level. Classical methods to counter multipath effects are based on signal equalizers, which task is to estimate the parametric filter coefficients that reverse filters the channel re-
sponse [1]. That procedure generally require the transmission of a known test sequence, thus reducing the channel efficiency since, in real conditions, the underwater acoustic channel response changes quite rapidly, making it necessary to continuously adjust the equalizer response. Attention has been recently drawn to an alternative technique based on the actual acoustic channel response as measured at an earlier/later time than the data transmission. This technique was originally proposed in underwater acoustics by Parvulescu in 1967 (republished in [2]) and then re-presented by Jackson et al. [3, 4, 5] as “phase-conjugation” (PC) or its time domain equivalent “time-reversal mirror”(TRM). This regain of interest was justified after the experimental test carried by Kuperman et al. [6] where it was shown that for low frequency tones at 400 Hz the environment remained stable over long periods of several hours and even days. During this test, the signal received at the vertical array were time reversed and retransmitted back to the source from each array exact hydrophone point. The acoustic field, as measured at (or nearby) the source, showed a stable focusing effect both in time and space. In that sense, the TRM acts as an optimum time-space recombiner thus providing a simultaneous solution to the multipath and attenuation most imparing effects as mentioned above. The usage of the TRM principle for “undoing” the acoustic channel, not in the ocean but in the computer, was first suggested by Dowling et al. [5] as ”passsive phase conjugation” (p-PC) and applied to underwater communications by Silva et al.[7] under the name of virtual TRM (vTRM). Similar techniques have been recently applied with real data in [8, 9]. This paper focus in two aspects: one, is to offer a common theoretical view for TRM and MFP as signal estimation techniques and second, it shows with experimental data that under realistic moving -AUV to VLA communication conditions, the long time stability of the acoustic channel is not verified.
2 2.1
Theoretical background Data model and optimum estimators
Let us assume that the transmitted signal is Pulse Amplitude Modulated (PAM) and can be written as s(t) =
+∞ X
Am p(t − mTs ),
(1)
m=−∞
where Am is the symbol sequence, Ts is the symbol duration and p(t) is the pulse shape function. Assuming the acoustic channel as a time-invariant linear system with impulse response hl (t), the received signal at hydrophone l is yl (t, θτ ) = hl (t, θt ) ∗ s(t) + ul (t),
(2)
where θt represents the environmental and geometric parameters that produce the impulse response hl (t) and where ul (t) is an additive zero mean white noise, assumed to be uncorrelated with the signal and from sensor to sensor. The Fourier transform of yl (t, θt ) at time τ and frequency ω is yl (ω, θτ ) = hl (ω, θτ )s(ω) + ul (ω),
(3)
which can be condensed in a convenient vectorial notation for all the hydrophone array {l = 1, . . . , L} as y(ω, θτ ) = h(ω, θτ )s(ω) + u(ω), (4)
Estimating s(ω) in (4) is a classical problem whose least squares (or maximum likelihood) optimal solution is given by sLS (ω) = wH (ω, θτ )H y(ω, θτ ), where
H
(5)
designates complex conjugate transpose and the weight vector w is given by w(ω, θτ ) =
h(ω, θτ ) , τ )h(ω, θτ )]
[hH (ω, θ
(6)
which is a simple matched filter adjusted to the impulse response h(ω, θτ ) at time τ . At this point there are various alternatives: one, is to consider that the channel impulse response h(ω, θτ ) needs to be estimated, which leads to a ill conditioned blind estimation problem similar to that found in air-wireless communications; the other, is to consider h(ω, θτ ) as a known function of an unknown parameter θτ , and attempt to estimate θτ prior to estimating s(ω): that is an environmentally blind problem which solution requires also a multiparameter non-linear numerical optimization; yet, another - approximate solution to finding h(ω, θτ ) is to consider that the channel of propagation varies slowly compared to the symbol duration Ts and that h(ω, θτ ) ≈ h(ω, θτ +T ), for T > Ts - that is the p-PC or vTRM approach as mentioned above.
2.2
The vTRM receiver
Let assume that the waveguide is excited by an impulse signal at time τ + T such that the received signal is written z(ω, θτ +T ) = h(ω, θτ +T ) + u(ω)
(7)
thus, as per the vTRM approach, an estimator of the weight vector in (5) can be given by z(ω, θτ +T ) ˆ vTRM (ω, θτ ) = H . (8) w z (ω, θτ +T )z(ω, θτ +T ) This can be justified by the following reasoning: under an high SNR assumption it can ˆ vTRM (ω, θτ ) ≈ w(ω, θτ +T ) and replacing that as weight vector in (5) be assumed that w gives sˆvTRM (ω) = wH (ω, θτ +T )y(ω, θτ ), (9) thus sˆvTRM (ω) =
hH (ω, θτ +T ) hH (ω, θτ +T ) h(ω, θ )s(ω) + u(ω), τ hH (ω, θτ +T )h(ω, θτ +T ) hH (ω, θτ +T )h(ω, θτ +T )
(10)
where the first term equates to κs(ω) if and only if hH (ω, θτ +T )h(ω, θτ ) = constant,
(11)
i.e., if θτ +T = θτ . That expression is absolutely equivalent to the Green’s functions product and sum in the p-PC formulation of [5] and that over modes for the TRM [6] and vTRM [7], with the advantage of introducing a statistical context where observation noise and signal properties have an important role. In particular the high SNR assumption in (8) and the second term of (10) that is a non-white noise sequence, whose impact on the final
result remains to be studied. In this notation, θ was introduced as a generic parameter that denotes both geometric and environmental parameters of the acoustic medium. At this point a distinction should be made between these two types of parameters. In fact, only environmental parameters, such as sound speed and surface roughness has been tested as relatively stable in [6]. Here, under realistic conditions and at higher frequencies, it becomes clear that geometric parameters have a much higher impact than environmental parameters, on the stability assumptions that are the basis for TRM to work.
3
The INTIFANTE’00 sea trial 124
07:23 151
06:23
122
Milit. lat (km)
150.5
120 150
08:22 118 149.5
04:23 05:23
116
149
03:23 02:23
148.5
128
128.5
129
ULVA 129.5
114
130
Milit. long (km)
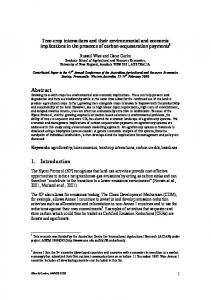
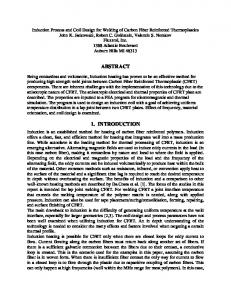
Figure 1: INTIFANTE’00 Event I source-receiver geometry and bathymetry; ULVA refers to the VLA position. The INTIFANTE’00 sea trial took place during October 2000, off the town of Set´ ubal, approximately 50 km south from Lisbon, Portugal. This sea trial had a number of objectives ranging from ocean tomography to autonomous vehicle navigation, among which a few events were concerned to underwater communications. This paper will concentrate on Event 1, that extends for about 5 hours worth of data on October 16, between 04:36 and 09:41. The source were signals emitted with a Honeywell HX-90G sound projector hanging from the oceanographic vessel NRP D. Carlos I, at nominal depth of 60 m. The receiver was a surface suspended 16 equispaced-hydrophone vertical line array (VLA) spanning nominal depths between 31 and 91 m. The received signals were transmitted via a high density radio link to onboard NRP D. Carlos I, pre-processed, monitored and stored. The source - receiver geometry along Event I is shown in figure 1. The data being analysed here was obtained during stations 1, 3 and 4 at approximate source - receiver ranges of 800, 3300 and 1450 m, respectively. Source receiver ranges and ship speed as measured from GPS during stations 1, 3 and 4 are shown in detail in figure 2. It can be seen that, even during stations, the source was continuously moving with, at some moments, a significant ship movement. Note that also the VLA was free moving in 50 m radius around the radio-buoy mooring.
(a)
(b)
950
850
800
750
700
1500
Source Range (m)
Source Range (m)
Source Range (m)
1520
3320
900
650
(c)
3340
3300
3280
3260
3240
289.16
289.165
289.17
289.175
289.18
289.185
3200 289.27
289.19
1460
1440
1420
3220
2
1480
289.275
289.28
289.285
289.29
289.295
1400
289.3
1.4
289.34
289.345
289.35
289.355
289.36
289.355
289.36
1.5
1.8 1.2
1.2 1 0.8 0.6
1
Ship speed (kn)
1.4
Ship speed (kn)
Ship speed (kn)
1.6
0.8
0.6
1
0.5
0.4
0.4 0.2 0.2 0
289.16
289.165
289.17
289.175
289.18
289.185
289.19
0 289.27
Julian date
289.275
289.28
289.285
289.29
289.295
0
289.3
289.34
Julian date
289.345
289.35
Julian date
Figure 2: Source -receiver range (top) and ship speed (bottom) as measured from GPS data during station 1 (a), station 3 (b) and station 4 (c).
3.1
Acoustic signals
Test signals were computer generated, differential binnary phase shift keying (DPSK2) sequences, with a center frequency of 1.6 kHz and a variable bandwidth depending on the required bit rate. Each data sequence had a format as shown in figure 3. The first field is 1 s duration probe signal sent as data header, the second field is a 5 s duration data sequence and the last field is a 1 s long blank interval. This sequence is continuously repeated. probe
DPSK2 data
1s
5s
blank
t
1s
Figure 3: Acoustic data sequences format. The probe signal (data header) has the pulse shape p(t) of the PSK modulation and is a root-root raised cosine with 50% roll-off. It serves as acoustic channel excitation to obtain ˆ vTRM in agreement with equation (8). An example of the probe signal, at a an estimate w symbol rate of 75 symbol/s, as received on hydrophone 9 (mid water depth) is shown in figure 4(a). If this signal is cross correlated with the transmitted signal and the enveloppe is taken - pulse compressed - the result is shown in figure 4(b), where three main paths can be distinguished: the direct path, corresponding to the highest peak, the surface path, the second-highest and the bottom reflected the last and smallest peak. That is a typical received signal at short range (approximately 350 m range, in this case).
4
Communication results
The estimated probabilities of error for the three stations considered in this analysis are shown in table 1 using the vTRM technique and without any equalization or phase
Normalized amplitude
(a)
(b)
1
1
0.8
0.9
0.6
0.8
0.4
0.7
0.2
0.6
0
0.5
−0.2
0.4
−0.4
0.3
−0.6
0.2 0.1
−0.8 −1 0.7
0.75
0.8
0.85
0.9
0.95
1
1.05
1.1
0 0.7
0.75
0.8
0.85
0.9
0.95
1
1.05
1.1
Reduced time [s]
Reduced time [s]
Figure 4: Probe signal received on hydrophone 9, at 64 m depth, for the 75 symbol/s rate (a), and the respective channel impulse response estimate after pulse compression (b). synchronization. These results where drawn from a variable statistical population size between 800 and 2000 symbols. This difference was due to interferences in the RF data link connection between the VLA and onboard ship. It can be easily seen that this population size is, in some cases, not sufficient to descriminate the probability of error at short distance and at low symbol rate. In general, error probability is increasing with time interval to the probe signal (up to 5 s) and with symbol rate, but in general is extremely low, attaining a significant value of 4% only at 3.3 km range for a 300 symbol/s rate. T (s) 1 2 3 4 5
Station (%) 75 150 0 0 0 0 0.016 0 0 0.17 0 0
1 300 0.08 0.07 0.07 0.19 0.26
Station (%) 75 150 0.02 0.03 0.29 0.03 0.11 0 0.29 0.03 0.19 0.11
4 300 0.01 0.54 0.12 1.29 0.24
Station (%) 75 150 0 2.17 0.15 1.27 0.34 2.24 – – – –
3 300 3.80 3.84 4.06 – –
Table 1: Probability error (in %) for stations 1, 4 and 3, in a range increasing order, at symbol rates of 75, 150 and 300 symbol/s and for a time interval T of 1,2,3,4 and 5 second between the probe signal and the actual data sequence.
5
Conclusion
The contributions of this paper can be summarized as follows: i) the usage of time reversal in underwater acoustics is presented under a new theoretical context of signal estimation in noise, leading to a quantification of the influence of observation noise into the estimation process; ii) the estimated error probability obtained on real signals, transmitted in a shallow water waveguide at various symbol rates, show that there is a significant loss of coherence over time intervals of only 5 s between the probe signal and the data sequence; iii) it is suggested that this error increase are due to source-receiver relative motion, that was not observed on previous experiments where all equipments were held fixed. Despite, these results the vTRM approach is promising when coupled with a conventional equalizer for increasing speed convergence and channel efficiency.
Acknowledgements The authors are in debt to: C. Soares and C. Lopes for their contribution during the sea trial; to Saclantcen, La Spezia, Italy for equipment loan; and to Instituto Hidrogr´afico, for sea trial coordination. This work was supported under projects INFANTE of FCT, Portugal, and LOCAPASS from the Ministry of Defense, Portugal.
References [1] Stojanovic M., Catipovic J., and Proakis J. Adaptive multichannel combining and equalization for underwater acoustic communications. J. Acoust. Soc. Am., 94(3):1621–1631, 1993. [2] Antares Parvulescu. Matched-signal (mess) processing by the ocean. J. Acoust. Soc. America, 98(2):943–960, 1995. [3] Jackson R.D. and Dowling R.D. Phase conjugation in underwater acoustics. J. Acoust. Soc. Am., 89(1):171–181, January 1991. [4] Dowling R.D. and Jackson R.D. Narrow-band performance of phase-conjugate arrays in dynamic random media. J. Acoust. Soc. Am., 91(6):3257–3277, June 1992. [5] Dowling R.D. Acoustic pulse compression using passive phase-conjugate processing. J. Acoust. Soc. Am., 95(3):1450–1458, March 1994. [6] Kuperman W.A., Hodgkiss W., Chung Song H., Akal T., Ferla C., and Jackson D. Phase conjugation in the ocean: Experimental demonstration of an acoustic time-reversal mirror. J. Acoust. Soc. Am., 103(1):25–40, January 1998. [7] Silva A., Jesus S., Gomes J., and Barroso V. Underwater acoustic communications using a “virtual” electronic time-reversal mirror approach. In P. Chevret and M.Zakharia, editors, 5th European Conference on Underwater Acoustics, pages 531–536, Lyon, France, June, 2000. [8] Edelmann G.F., Hodgkiss W.S., Kim S., Kuperman W.A., Song. H.C., and Akal T. Underwater acoustic communications using time-reversal. In Proc. of the MTS/IEEE Oceans 2001, pages 2231–2235, Honolulu, Hawai, USA, 5-8 November 2001. [9] Roussef D., Fox L.J.W., Jackson D., and Jones D.C. Underwater acoustic communications using passive phase conjugation. In Proc. of the MTS/IEEE Oceans 2001, pages 2227–2230, Honolulu, Hawai, USA, 5-8 November 2001.