favorite ice cream flavors can be used to predict the personality of people [4,8,10] .... [13] I. Railean, P. Lenca, S. Moga, and M. Borda, "Closeness Preference â A.
International Journal of Applied Engineering Research ISSN 0973-4562 Volume 10, Number 8 (2015) pp. 21259-21266 © Research India Publications http://www.ripublication.com
Cluster mapping with the help of new proposed algorithm and MCF algorithm to recommend an ice cream to the diabetic Patient. 1
Suhas Machhindra Gaikwad1, , Dr.PreetiMulay1, Rahul Raghvendra Joshi1 Symbiosis International University, Lavale, Pune-412115, India. Symbiosis Institute of Technology, Lavale, Pune - 412115, Maharashtra, India. {Suhas.gaikwad, preeti.mulay, rahulj} @sitpune.edu.in}
Abstract The research for suggesting an ice cream for a diabetic patient is carried out in data mining by using clustering and mapping between the data for ice cream and diabetic patients. Here, mapping of ice cream dataset with diabetic patient dataset is done by using MFCA, which is proposed and explained in this paper. The results obtained from MCFA algorithm and the new proposed algorithm are explained and verified and it is observed that they are having the relevance. Keywords: Modified Cluster Formation Algorithm, Newly proposed Algorithm, Ice cream, Ice cream attribute, Diabetic Patient, Matlab.
1. Introduction The month of July is proclaimed as “National Ice Cream Month”. Every year this month, in the United States is celebrated as Ice Cream Month. The study suggests, favorite ice cream flavors can be used to predict the personality of people [4,8,10] for e.g. people who loves vanilla ice cream are likely to be impulsive, easily suggestible and idealistic. Likewise, those who love chocolate ice cream are likely to be dramatic, lively and charming. The data mining is useful for identifying and predicting pattern from given data series and verification of the obtained pattern or results can be carried out with the help of new techniques [2,3]. In this paper, the focus in on suggesting an ice cream to a diabetic patient by using data mining. Here, two different algorithms are considered and they are applied on two datasets viz., ice cream dataset and diabetic patient datasets. Here, closeness factor between two data series is found by considering clusters formation and mapping between the two datasets, which are ice cream and diabetic patient datasets, is observed [1,6,7].
21260
Suhas Machhindra Gaikwad
2.1 Methodology involved in MCFA algorithm For all the data sets, their areS1 and S2 be the two data series [17]. a) S1=S (i), S2=S (i+1) T
T ( j)
S ( j)
S ( j)
1 2 b) Calculate the sum of each column c) Calculate the sum of each series, which can be used to calculate the S ( j) probability ratio. n
1
p
j
1 n
T ( j) j
1
d) Calculate error for each series, e) Calculate weight of each series, f) Calculate G (closeness factor) for these two series,
n
c( j)2 G( j)
w( j)
j 1 n
w( j) j 1
The stat crunch [16] for an ice cream datasets having 10000 units is taken from Pearson website. After solving the steps mentioned in the above algorithm from a to f, the range of closeness factor is obtained which is from 0.045500354 to 0.136190053. Similarly, for diabetic patient dataset of 10000 units, the range of closeness factor is from 0.01913278 to 0.434617605. Now, cluster formation depending upon the closeness factor is considered. So, for ice cream dataset, there are only 2 clusters. These clusters are shown in table 1. Table 1: Ice Cream Cluster’s Cluster 1 0.045500354 0.045500354 0.045500354 0.045500354 0.045500354 0.045500354 0.045500354 0.045500354 0.045500354
Cluster 2 0.100169098 0.100169098 0.100169098 0.100169098 0.100169098 0.100169098 0.100169098 0.100169098 0.100169098
Also, for diabetic patient’s dataset there are 5 clusters, which are shown in table 2 as given below.
Cluster mapping with the help of new proposed algorithm and MCF algorithm to recommend an ice cream to the diabetic Patient. 21261 Table 2: Clusters for Diabetic Patients Cluster 1 0.01913278 0.021573531 0.02283005 0.024110058 0.024110058 0.024758738 0.024758738 0.024758738
Cluster 2 0.100454229 0.100454229 0.100454229 0.100454229 0.100454229 0.100454229 0.100454229 0.100454229
Cluster 3 0.200681794 0.200681794 0.200681794 0.200681794 0.200681794 0.200681794 0.200681794 0.200681794
Cluster 4 0.30044568 0.30044568 0.30044568 0.30044568 0.30044568 0.30044568 0.30044568 0.30044568
Cluster 5 0.401195004 0.401195004 0.401195004 0.401195004 0.401195004 0.401195004 0.401195004 0.401195004
The cluster centriod is calculated from average distance between the formed clusters. The centriod for cluster 1 of ice cream datasets is 0.068670542; where as centriod of cluster1 of diabetic patient dataset is 0.057610173. The details about centroid are mentioned in table 3. Table 3: Centriod for Ice Cream and Diabetic Patient Clusters Cluster
Centroid of Cluster for a Centroid of Cluster for a ice cream dataset of 7020 diabetic patient dataset of unit 7020unit
Cluster 1
0.068670542
Cluster 2
0.11750986
0.057610173
0.148106059
Thus, the mapping between ice cream and diabetic patient datasets is possible. The cluster 1 of ice cream datasets cannot map with the cluster cluster1 of diabetic patient dataset, but cluster2 of ice cream datasets can be mapped with the cluster 2 of diabetic patient dataset.
21262
Suhas Machhindra Gaikwad
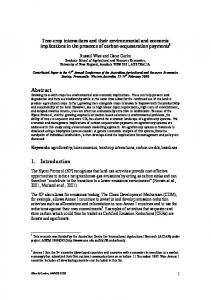
2.2 New Proposed Algorithm The new proposed algorithm consists of the flowing steps. Firstly, there is a collection of datasets and it then is followed by pre clustering of data, which is removal of zeros [14].
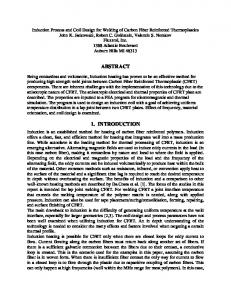
Figure 1: New Proposed Algorithm After removal of zero’s and replacing those with the previous values, application of k Nearest Neighbor (KNN) algorithm gives centriod and distance between the clusters. The centriod and distance between clusters is useful in Mahanalosis distance measure. So, by the use of Mahanalobis distance measure the results are obtained. If the obtained results are in the expected range then they are added to clusters, which show incremental clustering behavior. Here, the obtained results are not in given range so, new clusters are to be generated. Finally, print results and stop. Then apply newly proposed algorithm on same dataset on which previously MCFA algorithm is applied for 10,000 units of ice cream datasets, the results of the same are shown figure 2. It considers attributes of ice cream like green line indicating fats in the range from 0 to 0.579,sugar in the range from 0.579 to 2.293 and cholesterol in the range from 2.293 to 8.12.
Cluster mapping with the help of new proposed algorithm and MCF algorithm to recommend an ice cream to the diabetic Patient. 21263
Figure 2: Graph obtained from MATLAB for the proposed new algorithm after applying on considered ice cream dataset Also, new proposed algorithm is applied on the diabetic patient datasets as shown in figure3, which shows the results for the same. It shows the attribute like green line indicating sugar which in the range from 0 to 1.52.
Figure 3: MATLAB graph after application of new proposed algorithm on diabetic patient dataset
21264
Suhas Machhindra Gaikwad
After application of proposed new algorithm on two datasets, which are ice cream and diabetic patient dataset, it is observed that mapping is possible between these two datasets. Also, mapping is possible by considering sugar attribute for ice cream datasets and diabetic patient dataset. In ice cream dataset sugar range is from 0.579 to 2.29 whereas in diabetic patient dataset its range is from 0 to 1.52 so mapping between them can be done and it is achievable. Time complexity and cluster formation comparison between two algorithms is given in table number 4. Table 4: Complexity Table Algorithm name
Time Clusters formed Clusters formed Attribute compl for 4020 unit for 7020 unit Visualization exity data data
MCFBA
New proposed Algorithm
2.522 sec
2 for ice cream data 4 for diabetic patient dataset
2.569 sec
No cluster Impactful Sugar Impactful formation Attribute Sugar Visualization Attribute Visualization
Domai n OF Data
2 for ice cream No Attribute Data data 5 for Visualization mining diabetic patient dataset
Data mining
3. Conclusion The process of suggesting an ice cream to a diabetic is verified by two methods which are in turn two different algorithms are used for the same. Firstly closeness factor and then cluster formation and mapping of cluster for considered datasets is carried out. However, new proposed algorithm can be used to visualize the attribute in the ice cream and for diabetic patients. Here, sugar is an impactful attribute whose range for considered datasets is observed and the same is shown by plotting the graphs on MATLAB. So mapping between considered datasets that is an ice cream and a diabetic patient datasets can be possible and is achievable. This mapping is verified by the results obtained from of MCFA and new proposed algorithm and it is seen that they are analogous to each other.
Cluster mapping with the help of new proposed algorithm and MCF algorithm to recommend an ice cream to the diabetic Patient. 21265
4. Related Works and Its Relevance With The Concept Proposed In This Paper Analytical Hierarchy Process (AHP) can be used to verify cluster mapping in order to suggest an ice cream to the diabetic patient. Also, System dynamics modeling can be done in order to suggest an ice cream to the diabetic patient based on sugar content in the ice cream and sugar intake of the day by a diabetic patient. In this paper, by considering sugar as a main attribute for ice cream and diabetic patient dataset, it is proved mapping between these two datasets is possible. Also, by using the same, suitable ice cream can suggest to a diabetic patient.
5. References [1]
[2]
[3]
[4]
[5]
[6]
[7] [8]
[9]
S. Chauhan, M. Imdad, W. Sintunavarat, and Y. Shen, "Unified fixed point theorems for mappings in fuzzy metric spaces via implicit relations," Journal of the Egyptian Mathematical Society, 2014. T. Y. Chen and J. H. Huang, "Application of data mining in a global optimization algorithm," Advances in Engineering Software, vol. 66, pp. 24-33, 2013. M. J. Cracknell and A. M. Reading, "Geological mapping using remote sensing data: A comparison of five machine learning algorithms, their response to variations in the spatial distribution of training data and the use of explicit spatial information," Computers & Geosciences, vol. 63, pp. 2233, 2014. V. M. da Silva, V. P. R. Minim, M. A. M. Ferreira, P. H. d. P. Souza, L. E. d. S. Moraes, and L. A. Minim, "Study of the perception of consumers in relation to different ice cream concepts," Food Quality and Preference, vol. 36, pp. 161-168, 2014. J. P. Donate, P. Cortez, G. G. Sánchez, and A. S. de Miguel, "Time series forecasting using a weighted cross-validation evolutionary artificial neural network ensemble," Neurocomputing, vol. 109, pp. 27-32, 2013. D. N. Flynn, "Building a Better Model: A Novel Approach for Mapping Organisational and Functional Structure," Procedia Computer Science, vol. 44, pp. 194-203, 2015. S. Ghosh and S. Mitra, "Clustering large data with uncertainty," Applied Soft Computing, vol. 13, pp. 1639-1645, 2013. M. Grossi, R. Lazzarini, M. Lanzoni, and B. Riccò, "A novel technique to control ice cream freezing by electrical characteristics analysis," Journal of Food Engineering, vol. 106, pp. 347-354, 2011. K. Jung, K. C. Morris, K. W. Lyons, S. Leong, and H. Cho, "Mapping Strategic Goals and Operational Performance Metrics for Smart Manufacturing Systems," Procedia Computer Science, vol. 44, pp. 184193, 2015.
21266
Suhas Machhindra Gaikwad
[10] T. Kanit, S. Forest, D. Jeulin, F. N’Guyen, and S. Singleton, "Virtual improvement of ice cream properties by computational homogenization of microstructures," Mechanics Research Communications, vol. 38, pp. 136140, 2011. [11] C. Lemke and B. Gabrys, "Meta-learning for time series forecasting and forecast combination," Neurocomputing, vol. 73, pp. 2006-2016, 2010. [12] M. K. Pakhira, "Finding Number of Clusters before Finding Clusters," Procedia Technology, vol. 4, pp. 27-37, 2012. [13] I. Railean, P. Lenca, S. Moga, and M. Borda, "Closeness Preference – A new interestingness measure for sequential rules mining," KnowledgeBased Systems, vol. 44, pp. 48-56, 2013. [14] Preeti Mulay, Dr. Parag A. Kulkarni, “Knowledge augmentation via incremental clustering, new technology for effective knowledge management”, ACM digital library, International journal of business information systems, vol. 12, issue 1, Dec 2013. [15]
[16]
Suhas Machhindra Gaikwad, Dr. Preeti Mulay, Rahul Raghvendra Joshi. "Analytical Hierarchy Process to Recommend an Ice Cream to a Diabetic Patient based on Sugar Content in it." procedia Elsevier (2015). http://www.statcrunch.com.
[17] Prachi M. Joshi, Dr. Parag A. KulkarniA Novel Approach for Clustering based on Pattern Analysis International Journal of Computer Applications (0975 – 8887) Volume 25– No.4, July 2011