2010 International Conference on Computer Applications and Industrial Electronics (ICCAIE 2010), December 5-7, 2010, Kuala Lumpur, Malaysia
Adaptive image segmentation based on Peak Signalto-Noise Ratio for a license plate recognition system Farshid PirahanSiah 1 Siti Norul Huda Sheikh Abdullah 2, Shahnorbanun Sahran3 Center for Artificial Intelligence Technology Faculty of Information System and Technology 43650 Bandar Baru Bangi, University Kebangsaan Malaysia 1
[email protected], http://www.pirahansiah.com, 2 mimi, 3shah @ ftsm.ukm.my This research intends to propose a developed method for recognition of license plates. One of the most important preprocessing parts of image processing is thresholding. Thresholding is a method which can separate foreground and background of an image. The major steps in LPR systems are : capturing the image, processing the image, segment decision, identifying the features, and category in the patterns. In an automatic LPR system, the first step will be extraction the license palate location in a captured image. Whereas, the license plate characters and numbers will be properly recognized during the stage of LPR. It will be necessary to high light a variety of variables, which influence on a typical LPR system as ether condition, vehicle type, plate color or some other possible and dubious factors as well as the specific character as fonts.
Abstract— The objective of this paper is to propose an adaptive threshold method based on peak signal to noise ratio (PSNR). Nowadays, PSNR has been widely used as stopping criteria in multi level threshold method for segmenting images. Alternatively, we apply the PSNR as criteria to find the most suitable threshold value. We evaluate this proposed method on license plate recognition application. At the same time, we compare this proposed algorithm with multi-level and multithreshold methods as the benchmark. Via the proposed technique, it could relatively change according to environment such as when there is a high or low contrast situation. KeywordsüAdaptive threshold, image segmentation, license plate recognition, thresholding image segmentation, PSNR
I. INTRODUCTION Pattern recognition is integral to a wide spectrum of scientific disciplines and technologies application which includes Optical Character Recognition (OCR), Biometrics, Diagnostic systems and Military applications. OCR involved handwritten: sorting letters by postal code, input device such as PDA's; printed texts for reading machines purposely for blind people and digitalization of text documentations and plate recognition. Biometrics application involved with face recognition, verification, retrieval; finger prints recognition and speech recognition. In diagnostic systems such as medical diagnosis for example X-Ray and EKG analysis and another important application is machine diagnostics and water detection. For military applications, one of the most important applications is automated target recognition (ATR) and image segmentation and analysis (recognition from aerial or satellite photographs). OCR system can convert image of characters (printed or handwritten) to the machine encoded text. After that, implementation in some application such as machine translation, text-to-speech, text mining and other related field. Currently, license plate recognition (LPR) has attracted more attention in OCR application. LPR system is using for identification of vehicles. It can be used in many applications such as executing the law, defending the border lands, the thefts in the vehicles, auto collect of tolls, monitoring the traffic jam and speed, permitting the point of entry, security and parking control. In LPR, thresholding is considered to be one of the most essential stages of preprocessing with respect to the image adaptation and processing.
978-1-4244-9055-4/10/$26.00 ©2010 IEEE
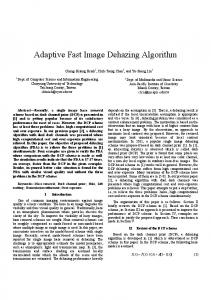
Figure 1. Some examples of images
II.
MOTIVATION
A. Single thresholding The thresholding process is a critical step during the segmentation phase. It is also an important part for image processing and pattern recognition. Implementing thresholding different reasons such as increase speed and use small storage
468
space. Therefore, the segmentation accuracy can be increased if the estimated thresholding value is achievable.
3:Calculate the total of gray scale pixels according three levels. 4: For (0< t < 256) step 10 is true do 5: Obtain the total number of objects, numt, when the source image using t threshold value. 7: end for 8: Search and select the peak values among num1…25. 9: Choose the selected threshold values. 10: Execute the character segmentation module.
We can simplify that:
1 f ' (i, j )® ¯0
if if
f (i, j ) > t f (i, j ) ≤ t
(1)
Various approaches are used to determine automatic thresholding. They often use gray level co-occurrence matrix as the population set to determine appropriate thresholding values such as; Local Entropy, Illingworth and Kittler's Minimum Entropy Threshold (MET)[1], and potential difference[2].
III.
THE PROPOSED METHOD
The proposed algorithm also works on Peak Signal to Noise Ratio (PSNR) . From previous research [3] the allowed range of the thresholding is equal to 10,20,30, . . . ,240,250. From each of these values, PSNR is identified for each of them. The maximum value of PSNR declares as the pick value and determine the appropriate value of the thresholding with this pick value. PSNR uses as a measure for quality of image by make comparison with the original image. The PSNR value is defined as below:
B. Multilevel Threshold[3] Sometimes, a single threshold is unsuitable for global segmentation. Therefore, some methods developed for multilevel thresholding [4-6]. Arora [3] proposed a multilevel threshold. It identifies multiple threshold values globally based on a gray scale distribution. A statistic recursive approach is applied by determining the mean and standard deviation on the first and subsequent range of a gray scale distribution. The multilevel algorithm is described in algorithm 1.
§ ¨ ¨ ¨ Max 2 PSNR = 10 * log10 ¨ m −1 n −1 ¨ ¦¦[I (i, j ) − K (i, j )]2 ¨ i =0 j =0 ¨ m*n ©
Algorithm 1 The Multi-level Thresholding Algorithm[3] 1: while increasing PSNR> 0.1 is true do 2: r=[a,b]. ( in the first step a=0 and b=255) 3: find mean and standard deviation for all pixels value in image range of r 4: t1=mean – k1* standard deviation; (k1 is random number) 5: t2=mean + k2* standard deviation; (k2 is random number) 6: The mean value of range [a,t1] is set as the threshold value of that particular partial range. 7: The mean value of range [a,t2] is set as the threshold value of that particular partial range. 8: a=t1+1 9:b=t2-1 10: end while 11: t1=mean 12: t2= mean+1 13: repeat step 6 14: Obtain new image with multilevel thresholding
· ¸ ¸ ¸ ¸ (2) ¸ ¸ ¸ ¹
In equation 2, Max is a maximum value in an image (for example, in a gray scale image Max is 255) while m and n are height and weight respectively of an image. I(i,j) is the original value of image and K(i,j) is a value after a change. The Proposed Threshold Algorithm Algorithm 3 The Porposed Threshold Algorithm.[3]
Input: license plate images, img. Output: obtain the selection of threshold values, t. 1: Find mean value of img and determine the type of img , is either dark or medium or bright images. 2: for (0 alpha) and (Sub > beta) then threshold=t 6: end for 7: If type of img is dark and threshold < s1 then threshold = threshold + k1 (3) 8: If type of img is medium and threshold > s1 then threshold = threshold –k2 (4) 9: If type of img is bright threshold > s3 then threshold = threshold - k3 (5) 10: Choose the selected threshold values. 11: Execute the character segmentation module.
C. Multi-Threshold[7] Multi threshold is another approach that applies multi threshold value [7]. This method uses a series of threshold in values and compute their respective total number of blobs/objects in an image. This then, it selects the peak threshold values which is consists the most total number of blobs comparing to their threshold neighbors. The Heuristic threshold algorithm is described in Algorithm 2. Algorithm 2 The Multi Threshold Algorithm [7].
Input: license plate images. Output: thresholding values. 1: Start. 2: Obtain the histogram distribution.
There are three level of images which are dark, medium and bright. To define those level, the mean value of
469
Table 2: Classification results with MLP-BP.
that image is calculated. After determining the mean of the pixels, it picks one appropiate threshoding as Eq. 3,4 and 5 respectively. The constant values of k1 , k2, k3, s1,s2, and s3 are based on experimental evaluations. Further reference, source code and some example of this algorithm in the [8]website. (This algorithm programmed and tested in VC++).
Wrong 1
Wrong 2
Kittler and Illingworth’s MET[1] Potential difference[2] Otsu[11] Multilevel[3] Proposed method
5.39% 5.46% 3.74% 6.10% 5.81%
1.23% 1.22% 0.49% 1.77% 1.88%
Wrong > 2 0.49% 0.49% 1.87% 0.93% 0.82%
Below are the indicators used in Table 1: “Not found", means that the application was not able to recognize the license plate. "Miss 1", "Miss 2", "Miss > 2" mean that the application has missed one, two or more than 2 character(s) in the license plate recognition. "Extra" means that the system has detected more characters than the original value. Indicators in Table 2 are explained below: "Wrong 1","Wrong 2", "Wrong > 2" mean that the system has detected one, two, or more than 2 characters incorrectly. As instance the actual character is "A" and the detected one is "C" in the system. In table 3,"Correctly Segmented" means that, the accuracy of the segmentation in the system of the license plate recognition. The main purpose of this algorithm is to achieve high level of accuracy in License Plate Recognition System in comparison with the other similar existing algorithms. There are some examples of this method, figure 5 shows pass and figure 6 shows segmentation fail and finaly, figure 7 displays fail in license plate recognition system.
Figure 2.Examples of PSNR for the original license plate images.
Figure 2 shows comparison between PSNR and sub-PSNR and number of blob. The SUB-PSNR is different between last two PSNR and normalized and BLOB is number of objects in image. IV.
Thresholding types
EXPERIMENTAL EVALUATIONS
In evaluation, this paper presents the proposed thresholding method within the LPR system which uses geometric features [9-10] and support vector machine (SVM). To compare the performance of the system, we explored and ran more than one thresholding method. They were Kittler and Illingworth's MET [1], Potential difference [2], Otsu's method [11], and the proposed method and compare the results obtained with those of the original system. Our test data consisted of 1216 images. If all clusters identified in an image consist of a single blob, then we say that no number plate was identified in this image. The percentage of images in which the number plate was not identified is summarized in the first row of Table 1. In this table columns correspond to thresholding method and the rows correspond to the status of the license plate and the segmentation error is classified into three types: one, two, or more characters were not segmented correctly. The number plate was not identified, this considers cases where a number plate region had been found but is totally wrongly placed.
Table 3: Blob error analysis for Kittler and Illingworth's MET [1], Otsu [11], potential difference [2], and the proposed framework based on correctly segmented. Thresholding types Kittler and Illingworth’s MET[1] Potential difference[2] Otsu[11] Multilevel[3] Proposed method
Correctly segmented 65.77% 69.90% 39.06% 87.08 % 62.65%
Table 1: Segmentation results. Thresholding types Kittler and Illingworth’s MET[1] Potential difference[2] Otsu[11] Multilevel[3] Proposed method
Not found 9.80%
Miss 1
Miss2
Miss >2
Extra
3.27%
4.49%
6.94%
2.45%
4.49%
3.67%
4.57%
7.26%
2.77%
41.17% 5.49% 9.25%
4.39% 4.49% 5.16%
3.58% 5.93% 4.42%
10.33% 15.24% 7.62%
1.46% 4.41% 2.38%
Figure 3. Compare of proposed method of thresholding for others.
470
LPD, LPS and LPR. The rates are calculated as follows [7]: LPD rate= (total images – Not found – small overlap) / total images (3a) LPS rate= (total images – miss1 – miss2 – miss>2) / total images – LPD (3b) LPR rate= (total images – wrong1 – wrong2 -wrong>2) / total images – LPS (3c) LPD stands for License Plate Detection LPS stands for License Plate Segmentation LPR stands for License Plate Recognition
Comparison among all the methods gives Otsu [11] the highest recognition time (3549.31ms) followed by potential difference [4] (3589.03ms),, the Multilevel threshold [3] framework (4026.1382ms), the proposed framework (5045.05 ms), and Kittler and Illingworth's MET [1] (4119.06ms). The experiments were performed using a database of 1216 images on an AMD Turion X2 Dual Core 64-bit with 2.2 GHz processor speed and 4000 MHz Bus speed Examples of successful image results based on the proposed thresholding method is shown in Figure 4,5 and 6.
Figure 6. Examples of proposed method of thresholding for the license plate recognition system. Segmentation fails with 40 in thresholding value Images.
V.
CONCLUSION
In conclution, a Malaysian LPR system developed recently uses a fixed threshold to segment the number plate and the characters. The experiments proved that via a Taylor-made thresholding method, the algorithm can be improved significantly. Clearly that the propose methods has been tested on off-line processing of images. Also this algorithm for thresholding give reliable accuracy for LPD. Another advantage of this proposed approach, is that the adaptive threshold values can relatively change according to environment when there is a high or low contrast situation such as during night, mid-day, underground and rainy day. ACKNOWLEDGMENT This project research is funded by UKM-AP-ICT-172009 grant entitled "Smart home and house security", UKM GGPM-ICT-119-2010 grant entitled "Vision guide for text and logo recognition for moving object" and also FRGS UKM-TT-03-FRG0129-2010 grant entitled "determining adaptive threshold for image segmentation".
Figure 4. Examples of proposed method of thresholding for the license plate recognition system. Recognition fails with 230 in thresholding value images.
REFERENCES [1]
[2]
[3]
Figure 5. Examples of proposed method of thresholding for the license plate recognition system. Pass in recognition with 150 in thresholding value images.
471
J. Kittler, and J. Illingworth, “Minimum error thresholding,” Pattern Recognition, vol. 19, no. 1, pp. 41-47, 1986. G. S. J. Acharya, “A novel electrostatics based image binarization technique,” International Conference Systemics, Cybernetics and Informatics, 2007. S. Arora, J. Acharya, A. Verma et al., “Multilevel thresholding for image segmentation through a fast statistical recursive algorithm,” Pattern Recognition Letters, vol. 29, no. 2, pp. 119-125, 2008.
[4]
[5]
[6]
[7]
[8]
K. Hammouche, M. Diaf, and P. Siarry, “A comparative study of various meta-heuristic techniques applied to the multilevel thresholding problem,” Engineering Applications of Artificial Intelligence, vol. 23, no. 5, pp. 676-688, 2010. G. Hao, X. Wenbo, S. Jun et al., “Multilevel Thresholding for Image Segmentation Through an Improved Quantum-Behaved Particle Swarm Algorithm,” Instrumentation and Measurement, IEEE Transactions on, vol. 59, no. 4, pp. 934-946, 2010. M.-H. Horng, “A multilevel image thresholding using the honey bee mating optimization,” Applied Mathematics and Computation, vol. 215, no. 9, pp. 3302-3310, 2010. S. N. H. S. Abdullah, F. PirahanSiah, N. H. Zainal Abidin et al., “Multi-threshold approach for license plate recognition system,” International Conference on Signal and Image Processing WASET Singapore August 25-27, 2010 ICSIP 2010, pp. 1046-1050, 2010, 2010.
[9]
[10]
[11]
472
F. PirahanSiah. "Farshid PirahanSiah, thresholding algorithm for image segmentation," 2010; http://www.pirahansiah.com. S. N. H. S. Abdullah, F. PirahanSiah, M. Khalid et al., “An evaluation of classification techniques using enhanced Geometrical Topological Feature Analysis,” in 2nd Malaysian Joint Conference on Artificial Intelligence (MJCAI 2010), Malaysia, 2010, pp. 12- 22. S. N. H. S. Abdullah, M. Khalid, R. Yusof et al., "Comparison of Feature Extractors in License Plate Recognition." pp. 502-506. N. Otsu, “A Threshold Selection Method from GrayLevel Histograms,” Systems, Man and Cybernetics, IEEE Transactions on, vol. 9, no. 1, pp. 62-66, 1979.