walls or balconies with different wrought iron designs, very common elements ... Small de- tails such as facade ornaments, wrought iron balconies or other noisy ...
ADAPTIVE PARAMETER TUNING FOR MORPHOLOGICAL SEGMENTATION OF BUILDING FACADE IMAGES Andr´es Serna, Jorge Hern´andez and Beatriz Marcotegui Mines ParisTech CMM - Centre de morphologie math´ematique Math´ematiques et Syst`emes 35 rue St Honor´e 77305-Fontainebleau-Cedex, France ABSTRACT We present an adaptive method to segment Haussmannian facades from street level images. Our approach assumes that images are rectified, cropped and their elements are aligned in a pseudo-regular structure. It is based on the accumulation of directional color gradients, combined with morphological filters in order to deal with textured facades. We propose an automatic parametrization of three filters included in the process: opening filter of size nop , alternate sequential filter (ASF) of size n, and H-minima filter with contrast threshold h. This automatic selection offers robustness to noise, image resolution changes, shadows and textures. Quantitative and qualitative results are reported on a public annotated database, validating the good performances of our approach. Index Terms— Mathematical morphology, facade segmentation, window detection, urban modeling 1. INTRODUCTION Digital 3D city models are useful for many applications: urban planning, emergency response simulation, cultural heritage documentation, virtual tourism, route planning, studies of accessibility for disabled people, among others. Thanks to availability of new types of 3D data, an increasing number of geographic applications such as Google Earth, Microsoft Virtual Earth and Geoportail are flourishing nowadays. Some of these applications do not only require to look realistic, but also have to be faithful to reality. Initially, virtual scenarios were created by infographic approaches, leading to time-consuming procedures, unsuitable for large-scale urban modeling. Procedural modeling allows to speed up the 3D virtual environment creation [1]. It is based on a set of rules, a grammar, defin{andres.serna morales, jorge.hernandez, beatriz.marcotegui} @mines-paristech.fr
ing a given architectural style. Procedural modeling approaches create realistic models in an efficient way, but a precise parametrization is required if the model has to be faithful to reality. Automatic analysis of facade images, combined with procedural modeling, allows to increase the productivity while remaining faithful to reality. Many algorithms focusing on automatic facade analysis have been designed in the recent years. In general, existing methods use rectified and cropped images containing a single building. Usually, individual buildings are manually extracted. In [2], Lee and Nevatia develop a method based on thresholding of directional gradient projections. In [1], M¨ uller et al. find repetitive architectural structures using mutual information to describe a single facade image. These methods are very sensitive to noise and fail if the building contains textured walls or balconies with different wrought iron designs, very common elements in Parisian Haussmannian architecture. In [3], Hern´andez et al. describe a method that automatically extracts an isolated building from a city block street level image. Besides, they extend Lee and Nevatia method introducing morphological filters in the directional gradient projections. These filters improve the robustness to textured facades. In [4], Teboul et al. learn a shape dictionary using random forest technique and publish an annotated database with 100 building images. In [5], Hammoudi extracts facade structures from 3D point clouds data using Hough transform. Finally, in [6], Pinte et al. combine color information and 3D point cloud data to improve the method robustness. In this paper we focus on morphological directional gradient projections combined with morphological filters. We study the adaptive parameter tuning of these filters and evaluate the proposed algorithm on the cited public database. The paper is organized as follows. Section 2 describes the morphological directional gradient projection technique, illustrated on a vertical splitting example. Section 3 describes the filter parametrization technique. Section 4 shows the performance of our method
on Teboul’s annotated database. Finally, Section 5 is devoted to conclude this work. 2. SEGMENTATION OF BUILDING FACADES The starting point for our approach is the method developed by Hern´ andez et al. [3]. Input images are assumed rectified and cropped, as shown in Fig. 2(b). Fig. 1 shows the diagram of the whole process and Fig. 2 illustrates intermediate images. First, a morphological vertical gradient Gy (x, y) detects horizontal contours (Fig. 2(c)). Then, a horizontal opening filter of size nop is applied in order to eliminate the undesirable details. Fig. 2(e) shows the accumulation, column by column, of the vertical gradient. This 1D projected gradient contains peaks at window locations and valleys between them.
(a) Street level image
(b) Isolated building
(c) Morphological verti- (d) Horizontal Opening cal gradient: Gy (x, y)
Fig. 1. Process scheme to compute vertical divisions. Afterwards, this projection is filtered in order to get a single maximum for each window. An Alternate Sequential Filter (ASF) of size n and a H-minima filter are used for this purpose. Finally, this profile is inverted and a watershed process computes the facade division. Fig. 2(f) shows the final result superimposed on the original image. Although a vertical splitting is shown, the same technique applies to horizontal splitting, just changing vertical by horizontal and vice versa. A frequency domain analysis of this profile would also be possible, but our approach is more robust to pseudoperiodic structures. Fig. 3 shows some qualitative results demonstrating the robustness of our method to occlusions, shadows and rectification problems. Note that our method is robust to rectification errors as long as a line can pass trough the wall without touching any window.
(e) Vertical projection, filtering and watershed
(f) Vertical splitting
Fig. 2. Vertical splitting. Image from [3].
3. FILTERING PARAMETRIZATION The method introduced in the previous section leads to interesting results but relies on a good filter parametrization. Specifically, three parameters require tuning: the size nop for the horizontal opening, the size n for the ASF, and the contrast threshold h for the H-minima filter. If these parameters are too small, the result will be over-segmented (Figures 5(a) and 5(b)). On the other hand, if they are too big, the result will be undersegmented (Fig. 5(d)). The aim of this section is to tune in an adaptive way these filter parameters, according to
Fig. 3. Facade divisions. Images from [3].
intrinsic image information. The parameter tuning of each step is explained below.
3.1. Opening filter parametrization Windows are the image largest structures. Small details such as facade ornaments, wrought iron balconies or other noisy structures can produce fake divisions on projected profile Py (Gy ). A morphological opening with a horizontal structuring element of size nop is used in order to get rid of these details from gradient images. The selection of nop is based on the pattern spectrum [7, 8]. Pattern spectrum (PS) plots the quantityP of information filtered out by each opening γi : (P Si = ∀pixel (γi−1 − γi )). The resulting curve is also called size distribution because its peaks correspond to the prevailing sizes of the image structures. Fig. 4 shows size distributions for different Gy (x, y) images. These curves present an important peak for small size openings. This peak corresponds to noisy details. Note that this peak exists for the three images in spite of shadows (Fig. 10(e)), balconies (Fig. 10(b)), and vegetation (Fig. 10(d)). The opening size is chosen as the value i for which the pattern spectrum falls down under 25% of its maximum. This selection offers robustness to image resolution changes.
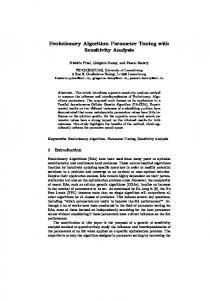
Fig. 5 shows the resulting vertical divisions for different filter sizes. Note that the filter size that minimizes the standard deviation, n=7, leads to a correct facade division.
(a) n=0, σ=7.70
(b) n=1, σ=14.01
(c) n=7, σ=6.24
(d) n=11, σ=68.90
Fig. 5. Divisions for different ASF sizes. Image from [3].
3.3. H-minima filter parametrization
Fig. 4. Size distribution of Gy (x, y) with a horizontal structuring element. Test images correspond to Fig. 10.
3.2. ASF filter parametrization An ASF consists in a sequence of openings (γ) and closings (ϕ) of increasing sizes. The sequence starts with the filter of size 1 and ends with the filter of size n: ASFn (Py (Gy )) = γn ϕn ...γ2 ϕ2 γ1 ϕ1 (Py (Gy )). This filter is particularly appropriated when the noise is present over a wide range of scales [9]. The filter size is chosen based on the facade regularity. Several filters of different sizes are applied, and the one leading to the most regular result is chosen. The regularity is estimated by the standard deviation σ of the segmented facade division sizes. This filter is applied to 1D profiles. Thus, evaluating different sizes is not a time-consuming task.
H-minima filter is a filtering tool based on a contrast criterion. More precisely, this transformation suppresses all minima whose contrast is lower than a given threshold h [10]. The contrast threshold h is chosen as a percentage of the dynamic of the extrema in the profile, that is h ∝ max(f ) − min(f ), where f = ASFn (Py (Gy )). This adaptive selection provides independence with respect to image resolution. Fig. 6 illustrates the effect of ASF and H-minima filtering. Note that the strongest filtering is carried out by the ASF, while the H-minima removes still remaining possible low contasted extrema, as shown in the left side of Fig. 6. 3.4. Window detection We assume that there is only one column of windows per vertical division. Analyzing the extrema of the filtered profile P˜y (Gy ), we found that minima pass through the wall while maxima pass through the windows. Using this information, we apply a constrained watershed on the projected horizontal gradient Py (Gx ), taking the extrema of P˜y (Gy ) as markers. Fig. 7 illustrates the process of window detection.
Fig. 6. ASF and H-minima filtering. The original profile corresponds to Fig. 10(a).
rectly the window detection performance, we remove from our detection the ground truth balconies regions. Fig. 9(a) shows the evaluation scores obtained with increasing ASF sizes. We can observe that the maximum fmean =0.79 corresponds to filters of size between 7 and 10. If we use the ASF fitting method proposed in Section 3.2, we get the same score, the maximum in the figure, which proves the efficiency of the proposed tuning. Once the parameters nop and n are chosen according to the procedure aforementioned, we need to choose the best h threshold for the H-minima filter. Fig. 9(b) shows an exhaustive test varying h from 1% to 30% of the dynamic in the profiles. The best values found in the test correspond to hv =14% and hh =2.5% of the dynamic for the vertical and horizontal filter thresholds, respectively. Note that this parameter is not so critical since the lowest and highest fmean correspond to 0.78 and 0.80, respectively. However, it improves the global performance up to 1% with respect to Fig. 9(a), where H-minima filter is not applied.
Fig. 7. Location of the vertical edge of the windows. 4. EXPERIMENTS (a) ASF size
Our method is tested on the public database [4] that contains 100 images. Images are rectified and various semantic elements are manually annotated. An example is shown in Fig. 8. We evaluate our system on window localization with the classic precision (P ), recall (R) and fmean criteria. P is the fraction of retrieved instances that are relevant, R is the fraction of relevant instances that are retrieved taking all relevant instances in the database into account, and fmean = 2P R/(P + R).
(a) monge 19
(b) Ground truth
(c) Detection
Fig. 8. Example of an annotated image from [4]. Note that our procedure detects windows including their corresponding balconies. In order to evaluate cor-
(b) H-minima thresholds
Fig. 9. fmean sensitivity to parameters n, hh and hv . The results reported by Teboul et al. are P = 0.65, R = 0.81 and fmean = 0.72, these figures are computed from the confusion matrix of [4] considering windows and balconies in the same category. However, they only test 10 images of the database, while we have run our experiments on the whole dataset. Using our proposed adaptive parameter tuning, the results are P = 0.82, R = 0.79 and fmean = 0.80, which is much better than other results reported in the literature on the public Teboul’s database. Qualitative results are shown in Fig. 10. Figures 10(a), 10(b) and 10(c) show examples in which the proposed method fails. Those images do not respect the regularity hypothesis on which our system is based: some window columns are almost adjacent. The standard deviation of division width is smaller when those columns are merged than when they are separated. Figures 10(d), 10(e) and 10(f) present the robustness of our system to shadows, textures and images on which the distance between windows are pseudoregular.
have been adapted to each image size. Qualitative and quantitative results are reported. Our performances are better than others reported in the literature on Teboul’s public database. Thus, our approach is validated. In the future, the use of an adaptive opening operator, called ultimate opening, will be studied. This operator automatically adapts its size to the image structures, based on a contrast criterion. (a) monge 34
(b) monge 58
(c) monge 63
6. ACKNOWLEDGEMENTS The work reported in this paper has been performed as part of Cap Digital Business Cluster TerraNumerica project. 7. REFERENCES
(d) monge 13
(e) monge 55
(f) monge 85
Fig. 10. Examples of results. Images from [4].
Although developing a real time application is out of this work scope, the process takes approximatively 0.7 seconds per image on an Intel(R) Core(TM) i7 CPU 2.93 GHz and 8 GB memory desktop computer. 5. CONCLUSIONS We propose an automatic parameter tuning of the three filters in the process: i) size nop of the opening filter is deduced from the pattern spectrum analysis of gradient images. This filter removes texture details on the facade in order to avoid fake divisions. Moreover, its adaptive tuning offers robustness to image resolution changes. ii) Size n of the ASF is chosen as the value that minimizes the standard deviation σ of the segmented region sizes. This filter size has a strong influence on the result, as shown in Fig. 5. Its adaptive tunning leads to the best result among all filter sizes. And, iii) contrast threshold h in the H-minima filter is chosen as a percentage of the dynamic of the extrema in the profile. The sensitivity to this parameter is very low, that means that the spurious maxima remaining after the ASF are very low contrasted, as shown in Fig. 6. This filter improves fmean criterion by 1% (from 79% to 80%). The adaptive parameter tuning offers robustness to noise, image resolution changes, shadows and textures. These adaptive filters lead to the best performance score compared to any filter parameters tested in an exhaustive way. If the database resolution had been heterogeneous, the results would have been even better than the score with any filter parameter, because our parameters would
[1] P. M¨ uller, G. Zeng, P. Wonka, and L. Van Gool, “Image-based procedural modeling of facades,” ACM Transactions on Graphics, vol. 26, no. 3, pp. 85–93, 2007. [2] S. C. Lee and R. Nevatia, “Extraction and integration of window in a 3d building model from ground view images,” IEEE Computer Vision and Pattern Recognition, vol. 02, pp. 113–120, 2004. [3] J. Hern´andez and B. Marcotegui, “Morphological segmentation of building fa¸cade images,” in IEEE International Conference on Image Processing, ICIP’09, 2009, pp. 4029–4032. [4] O. Teboul, L. Simon, P. Koutsourakis, and N. Paragios, “Segmentation of building facades using procedural shape priors,” in CVPR, 2010, pp. 3105–3112. [5] K. Hammoudi, Contributions to the 3D city modeling, Ph.D. thesis, Universit´e Paris-Est, 2011. [6] A. Pinte, C. Baillard, and E. Denis, “Mod´elisation de fa¸cades par analyse conjointe d’images terrestres et de donn´ees laser,” Revue fran¸caise de photogramm´etrie et de t´el´ed´etection, vol. 194, pp. 53–65, 2011. [7] G. Matheron, Random Sets and Integral Geometry, John Wiley & Sons, New York, 1975. [8] P. Maragos, “Pattern spectrum and multiscale shape representation,” IEEE Transactions on Pattern Analysis and Machine Intelligence, vol. 11, pp. 701–716, 1989. [9] J. Serra, Image Analysis and Mathematical Morphology, vol. 2, Academic Press, London, 1988. [10] P. Soille, Morphological Image Analysis: Principles and Applications, Springer-Verlag New York, Inc., Secaucus, NJ, USA, 2003.