some design issues of a manufacturing scheduling tool by entering into the details .... of the company contain manufacturing execution control software that ...
Chapter 12
Advanced Design of Scheduling Tools
12.1 Introduction In this chapter we move from the architecture discussed in Chap. 11 to discussing some design issues of a manufacturing scheduling tool by entering into the details of the different modules identified. In doing so, we also move from the generic (i.e. company-independent) to the specific (company-dependent), according to the different activities in the development of a manufacturing scheduling tool presented in Fig. 11.1. Therefore, it is not possible to give specific rules on how to implement the functionalities of the architecture, as this would largely depend on the specific tool to be designed. Instead, in this chapter we will go along the four modules of the architecture in order to discuss the main issues while keeping the discussion as much generic as possible. More specifically, in this chapter we present the following modules: • • • •
Business Logic Unit/Data Abstraction Module (Sect. 12.2), Database Management Module (Sect. 12.3), User Interface Module (Sect. 12.4), and Schedule Generator Module (Sect. 12.5).
12.2 Business Logic Unit/Data Abstraction Module This module mimics modern computer languages and development paradigms which insist on abstraction, modularity and encapsulation. Databases evolve over time, since new requirements often imply new fields and tables. The same can be said about the user interface. If a scheduling tool is built in a monolithic way, a small change in the database could have a wave effect on many other modules. This would result in a software that is both very rigid and difficult to maintain. To ensure complete modularity and a high degree of independence, we propose the usage of elaborated class hierarchies that allow inter-module communication with published J. M. Framinan et al., Manufacturing Scheduling Systems, DOI: 10.1007/978-1-4471-6272-8_12, © Springer-Verlag London 2014
319
320
12 Advanced Design of Scheduling Tools
interfaces (like those available, e.g. in the C# programming language). Notice that this architecture is very different from standard approaches where data is simply retrieved from databases and stored in memory structures. A distinct feature we propose is data polymorphism with which the same data entity might have different representations depending on the moment and intended use. Picture for example the entity that modelises a given quantity of a product to be produced. First of all, this might be referred to as a job, task, lot, production order and many other different names, depending on the company. Second, the data required to work with such an entity depends on the module. When visualising the production plan, detailed information like family, colour or characteristics of the product to produce are required. In addition, internal data employed by the tool (such as the status of a job) have to be handled. Finally, different data (and data formats) may have to be provided to the different information systems interoperating with the scheduling tool. However, all this information is not relevant for generating schedules, as typically only the code of the job and processing time might be all that is needed. As a result, the type of interface published by a data class or entity to each module differs according to the intended use. With this architecture, the BLU/DAM acts as a hub between all modules, ensuring maximum expandability, flexibility and reusability. With the proposed architecture, it should be easy to provide a Web-based user interface as a Web-based IU could be easily plugged in to the BLU/DAM without knowing any detail of the other modules. Although the BLU/DAM does not directly incorporate any functionality, it includes the functionalities related to constraint abstraction discussed in Sect. 11.6.2.
12.3 Database Management Module This module contains three submodules, namely System Database, Production Monitoring and Import/Export/Synchronisation, which we discuss in the following items: • System database. Among the three modules, this one is the most standard, and it contains all necessary persistent data in the tool. Modern relational databases are perfectly capable for this task. However, large databases require some extra efforts in order to assure a responsive software. Existing architectures, like the aforementioned by Pinedo and Yen (1997) fail to address important aspects of the database management which can be of paramount importance for an effective and real implementation of scheduling tools. Some important data will have to be retrieved from existing information systems and ERP software. Usually, this information is not complete, specially if the company is implementing a thirdparty production planning/scheduling software. As a result, some additional data will have to be introduced into the System DB, which in turn adds the necessity of keeping consistency of this data with the ERP system. Keeping this consistency is extremely complex and requires an specific module to import, export and to synchronise the Business Information System with the System DB. This module can incorporate the Schedule and Instance Capacity Analysis functionalities discussed in Sect. 11.6.6.
12.3 Database Management Module
321
The challenges presented in this module should not be underestimated. Although there are clear concepts of jobs, machines and so forth, the implementation of the functionalities described in the architecture render these concepts more complex in practice. For instance, the analysis of scenarios requires to store all relevant data related to a single schedule, as the Decision-Maker may want to ‘play’ with different processing times of certain machine (maybe trying to make a guess of the worst and best cases available), or different sets of jobs (for instance when deciding if certain job is to be scheduled, or not). As a result, storing a scenario may consist in virtually storing certain layout (together with the characteristics of the machines), a given set of jobs (which may be different for each scenario, or at least with different features), and different schedules (or solutions) for each scenario. Keeping all this information in the database forces to a careful design of a data model far away from a trivial task. • Production Monitoring. This submodule is concerned with production control. As we will see later on, controlling the current production programme requires of special features. SCADA systems and in general, the business information systems of the company contain manufacturing execution control software that generate real-time information. This information is urgent and must be dealt with rapidly. • Import/Export/Synchronise. This module should carry out lengthy operations in batch mode in order to keep up to date the System DB. As a result, an ad hoc module must be written in order to load real-time production control data. This data is then interfaced to the BLU/DAM and the necessary events are fired in order to notify all other modules that real-time data has been received. Together with the BLU/DAM, this module can incorporate the functionalities to perform the monitoring of execution (Production Monitoring submodule) as required in the analysis of functionalities carried out in Sect. 11.6.5.
12.4 User Interface Module Although this module might seem straightforward, it is indeed one of the most complex modules in the architecture. Effective, complete and easy to work with visualisation is a hard task that requires extensive coding. This comes as no surprise, since different scheduling problems require not only different solution procedures but also equally varied and complex solution representations. When building this module, the following design principles should be taken into account: 1. The tool should be flexible enough to allow the Decision-Maker to follow his/her preferred logical process when building a schedule. There are numerous studies describing the unstructured nature of the decision process adopted by the human schedulers (see, e.g. MacCarthy and Wilson 2001), therefore it does not seem too practical to force the schedulers to adopt a particular one, even in the case that the schedulers themselves have actively participated in the design of the tool.
322
12 Advanced Design of Scheduling Tools
2. The tool should allow the Decision-Maker to focus in a specific view or step of the scheduling process, starting from a general view and moving (if required) to a more specific one. While it may be very tempting that the decision-maker can modify input data while analysing schedules, we believe that this should be done via different interfaces, so the user does not loose track of what he/she is doing. 3. The tool should not overload the decision-maker with data/information outside the context in which the information is originally presented. Although this is a difficult decision on which information should be displayed and which not, we believe that this could be done by a careful selection of the information and by drill-down menus that, in any case, may allow the scheduler to customise the information that should be depicted. 4. The tool should be able to capture all relevant scenarios for the decision-making process, i.e. the Decision-Maker might wish to try different alternatives of performing the scheduling tasks, including different sets of jobs, modes of operations for the machines, shifts, etc. For each of these scenarios, different schedules may be stored (some of them generated by the Schedule Generator submodule, while others are manually built/modified by the Decision-Maker). All this information should be available in an structured manner so the task of the Decision-Maker is facilitated. These principles would naturally lead to the separation of this module into different interfaces depending on the view of the scheduling process addressed. While the connection among these interfaces should be enforced, the logical distinction may allow the scheduler to make sure about the step in the process in which he/she is currently involved. Consequently, up to five submodules can be identified inside the user interface. These are the following: • Output Representation. This submodule implements a set of functionalities devoted to present the information to the Decision-Maker. As we shall discuss, this submodule can be employed also as an input from the Decision-Maker, if the manipulation of the schedules is allowed. • Scenario Management. This submodule serves to implement a number of functionalities related to handling different scheduling scenarios. By scheduling scenarios we mean different schedules or even different instances created from the original schedule provided by the Schedule Generator module due to the manual intervention of the schedule. As we shall discuss, this submodule is instrumental in providing the tool with the ability to perform a what-if analysis. • System Maintenance. This submodule refers to the part of the user interface devoted to ease the creation and maintenance of the data required by the scheduling tool, including a number of functionalities so that the consistency and comprehensiveness of the data entered are checked, and alarms are triggered if discrepancies between past and actual data are observed. • Scheduling Control. This submodule deals with the functionalities related to visualise (possibly) in real-time the state of the shop floor. This submodule is closely linked to the Production Monitoring submodule described in Sect. 12.3.
12.4 User Interface Module
323
• Algorithm Generator Interface. This submodule may allow the user to edit new algorithms in an easy manner. These submodules are described in detail in the following sections.
12.4.1 Output Representation Once a solution for a given scheduling problem or production plan has been provided by the Schedule Generator Module, it has to be visualised. In addition, in order to build an interactive tool, the same interface used to visualise the solution can be employed to allow its modification. In addition, it has been argued (Pinedo 2009) that Output Representation interfaces should allow (at least up to a certain extent) for the modification of the input data, as some of these data (for instance, due dates) often have to be changed during a scheduling session. Several interfaces for the presentation and manipulation of solutions can be considered. These are: • Gantt Charts. The Gantt Charts are the most popular form of schedule manipulation and have been already presented throughout this book. The typical form of the Gantt chart is an horizontal bar chart in which the x-axis represents time and the y-axis represents the different machines or stages in the manufacturing process. Jobs or tasks are depicted as rectangles whose basis correspond to the processing time of the tasks. The identification of the different jobs in a Gantt chart is done via labelling these rectangles and/or depicting them with different colours or patterns. This format can be also employed to depict some other characteristics of the jobs and/or the resulting schedule, such as the tardiness or earliness of some jobs. In addition, some additional features related to the properties of the jobs, machines or schedules can be represented in a Gantt Chart, such as job earliest starting times, due dates and deadlines (that can be shown as vertical lines), frozen jobs (that may be rendered in a different colour/pattern), machine unavailabilities (that may be pictured as shadowed), etc. Gantt Charts are a well known and (relatively) easyto-understand visualisation tool and therefore they constitute the primary form of showing aggregate information in an scheduling tool (Wiers 1997). Regarding the manipulation of the schedule shown in the Gantt chart by the scheduler, several options are possible (see, e.g. Speranza and Woerlee 1991, or Baek et al. 1999), i.e.: – Add/Delete. The news are manually entered into or are removed from the existing schedule. This leads to the necessity of showing the Decision-Maker a zone in the interface where non-scheduled jobs are shown (or, alternative, where jobs removed from the schedule can be stored). – Interchange. The relative sequence of two or more jobs is interchanged. This usually leads to a limited change in the schedule (at least as compared to other options).
324
12 Advanced Design of Scheduling Tools
– Split/Join. A job is splitted into two or more tasks. Conversely, two or more tasks are merged into a single job. The implications of this movement are not straightforward, as the processing times of the machines for the joint/splitted jobs are different from those in the initial schedule. Therefore, it would be advisable to invoke the Schedule Generator once again in order to detect new (possibly improved) schedules. – Lock. A job is locked in the Gantt chart, i.e. their starting and finishing times are fixed. An alternative would be to lock the relative position of a job in the machine, so that the starting and finishing times can be changed, but not the order of the job with respect to the rest of the jobs in this machine. Note that some of these options can be done by clicking, dragging and dropping the individual jobs. However, providing the interface with these capabilities is far from being a trivial task, since after changing the position of a job on a machine, the rest of the jobs have to be pushed backward or forward to maintain feasibility. The effect of this movement on the rest of machines is referred as cascading or propagation (see, e.g. Pinedo 2009) and it may lead to substantial changes with respect to the schedule provided by the application. Therefore, an option that should be available for the decision-maker is whether to invoke or not a rescheduling procedure, possibly after locking some of the jobs. In addition to a detailed representation of the individual jobs, an aggregated view of the whole schedule (possibly representing shifts or sets of related jobs, and groups of machines or stages) would be interesting for the Decision-Maker. This aggregated view should be static, i.e. it should not allow the manipulation of the individual schedules. However, it has the advantage of showing a global view of the process (particularly needed when the number of jobs/machines in the plant is rather large) that can be useful when assessing the impact of the local changes in the schedule. After allowing all this manipulation, the Decision-Maker may want to save the schedule, or to ‘undo’ certain modifications. The first option is discussed when describing the functionalities of Scenario Management in Sect. 12.4.2. With respect to ‘undoing’, we believe that this option should be available (in order to recover from mistakes when manipulating schedules), but only for a limited number of moves, as it is easy that the Decision-Maker loose the track of what he/she is doing. It is preferable, thus, that the tool offers to save the actual schedule as an scenario every time a short number of manipulations has been performed. • Job Screens. A Job screen (see, e.g. Higgins 1996) is an ordered list of the jobs that should be processed on each machine. Another name for job screens is Dispatch lists (see Pinedo 2009). A number of characteristics of the jobs, such as the processing times, their corresponding weights and/or priorities, the starting, finishing times and deadlines, etc. can be shown. The job screens provide a representation of the schedule that is focused on each manufacturing resource, and therefore seems to be quite suitable for the manipulation of the schedule. For instance, given the list of the jobs to be processed in front of a machine, the scheduler can alter this order according to constraints or considerations that have not
12.4 User Interface Module
325
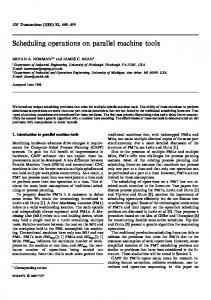
been captured by the model such as certain set-ups, different age/characteristics of the machines or the different skills of the workers in a shift. Nevertheless, it has the disadvantage that, in principle, it only considers local information, so the effects of this (local) manipulation in the full schedule are not shown. In our previous example, it may be that a reasonable change in the order of the processing of the jobs in an early stage have a negative effect when evaluating the schedule in all machines. Therefore, it seems reasonable to accompany the representation of the job screens with global information of the schedule (such as the aggregated Gantt Chart discussed in the early item), so changes in the objective functions are also visible. Local changes in this global information view can be visualised by rendering the changed zone in a different colour and by showing both aggregate Gantt Charts (before and after the local changes). Although it is not usually shown in Job screens from several tools (such as LEKIN, see Pinedo 2009), additional information related to each machine could be shown. Particularly, information regarding machine utilisation, total set-up time, etc., could be also very useful for the decision-maker to focus onto a particular machine. Therefore, our suggestion for this type of interface would be to implement a twolevel interface. A first-level graph (sketched in Fig. 12.1) would display each one of the machines in the manufacturing process, together with some summary information related to each one of the machines. By doing so, the scheduler can visualise the whole process and focus onto the overloaded resources (or, in contrasts, in those idle). This first level would be primarily devoted to show the output, and little manipulation or no manipulation at all should be provided. A second level can be accessed by the user by clicking on each one of the resources, and would provide the information corresponding to the jobs in this machines. Alternatively, an integrated Job Screen such as the one shown in Fig. 12.2 can be employed. • Capacity buckets. In this type of interface (see e.g. Pinedo 2009), the time axis (usually horizontal) is partitioned into a number of time slots or buckets that may correspond to either days, weeks or any other time unit. For each machine (usually depicted in the y-axis), the corresponding capacity is shown. The idea is similar to the one of the machine load boards (see, e.g. Higgins 1996). An example of capacity buckets is shown in Fig. 12.3. This type of interface may help the scheduler to identify which machines in the plant are operating near their capacity (in the same manner as the first level of the Jobs Screens proposed before), but also during which time interval. It is primarily an output interface, and interactivity is, in principle, not required. However, a second level of information could be providing by allowing the scheduler to click on a particular bucket of an specific machine in order to obtain the list of the jobs to be processed, or possibly, a singlemachine Gantt chart in order to gain some insight on the causes of the congestion (or idleness) of the machines. • Throughput diagram. These type of diagrams usually represents the evolution of the value of a cumulative performance measure (usually represented in the y-axis) against the time (usually depicted in the x-axis). The performance measure may be (Pinedo 2009), the total amount of orders received, orders produced or
326
12 Advanced Design of Scheduling Tools
Fig. 12.1 First level of the proposed job screen interface
Fig. 12.2 Integrated job screen interface
12.4 User Interface Module
327
Fig. 12.3 Example of capacity buckets
orders shipped. Note that the difference between the curves of orders produced and shipped amounts for the work-in-process. In addition, the expected amount of orders can be also depicted, so this diagram allows visualising the deviations from the planned schedules, particularly if the data shown in the diagram are captured in real-time. Throughput diagrams are devised for representation of the schedules and not for their manipulation, therefore there is no interactivity linked to this type of diagrams. For a detailed explanation on the uses of throughput diagrams, we refer the reader to Wiendahl and Tonshoff (1988). Alternative names for these diagrams are IOP (Input-Output Planning) (Wiers and Van Der Schaaf 1997), and are available in many standard software packages for production planning and control (Wortman et al. 1996). In addition to the types of diagrams described before, a number of reports containing statistic pages and performance criteria sheets must be provided, among many other possible data visualisations. It is tempting to overload the decision-maker with reports and screens very rich in information, but in this case we believe that it is preferable to concentrate in only one of the different views or perspectives of the scheduling process. Most of these reports should be developed ad hoc, as they must comply with company-specific forms and data.
12.4.2 Scenario Management As soon as the scheduler manually modifies the schedule proposed by the tool via some of the interfaces described in the previous section, a new schedule is generated. Analogously, if the scheduler modifies some input data (e.g. in order to anticipate a delay in the arrival of raw materials required to start certain job, its corresponding release times are changed), a new instance is generated, and several schedules can be offered by the tool, or be obtained after a manual modification by the scheduler.
328
12 Advanced Design of Scheduling Tools
Each one of these alternatives would have to be eventually confronted by the scheduler in order to study the different possibilities and trade-offs offered. We will name scenario to each one of these alternatives, noting that an scenario consists of an instance plus a corresponding set of schedules. The tool must then allow the scheduler to record each scenario (giving a label or description) and to compare them. These are the basic functionalities of the Scenario Management submodule. Obviously, this submodule has to be tightly connected to that of Output Representation, as the latter provides the starting point for the former. At some point while modifying the schedules and/or the instances in the Output Representation submodule, the scheduler must be able to create a new scenario by ‘dropping’ this solution (together with the corresponding instance) into an ‘Scenario List’. A label and a description of this scenario should be given, so that the scheduler can easily identify it at a later stage. Once the initial selection of scenarios has finished, the user must be able to see the main performance measures of the selected scenarios and to see the full details of the scenario, perhaps by double-clicking on it. In order to make this process systematic, our opinion is that the scheduler should not be able to modify the scenario from this submodule. However, he/she can transfer the scenario back to the Output Representation module (by ‘copying’ the scenario) and then make all necessary manual modifications and save it as a new scenario in the ‘Scenario List’. The differences among the scenarios in the Scenario List should be clearly visible, both by forcing the Decision-Maker to introduce different, meaningful labels for each scenario, and by allowing the Decision-Maker to see a summary of the main characteristics of each scenario (related both to input and output data). The submodule may allow to discard scenarios that have been initially selected, but given the complexity of generating an, in principle valid, scenario, we believe that the scenarios should not be completely removed unless explicitly stated by the decision-maker. To do so, a ‘folder’ of discarded scenarios should be kept apart from those under scrutiny. We believe that this submodule may greatly enhance the decision support capabilities of a scheduling tool, as the analysis of scenarios is pointed out by McKay and Wiers (2003) as an important element in a scheduling tool. Let us not forget that once a scheduling tool is available to the user, more and more strategic decisions can be taken. For example, questions like what would be the result with an additional machine? What if I cancel the night shift? can be answered with a Scenario Management submodule.
12.4.3 System Maintenance Of course, all the persistent information in the System Database must be maintained, from the configuration of the shop and existing machines to the detailed production characteristics of each product. As simple as this might seem, the sheer amount of production data often results in a cluttered user interface. A number of interfaces can be built to present and edit these data, such as the plant layout interface and the jobs interface.
12.4 User Interface Module
329
The plant layout interface may depict graphically the work centres and machines in the plant. If possible, it should also represent the routing between the work centres, although for many shop floors this may not be possible or may result in a very confusing representation. In such cases, it is preferable to depict just the work centres together with their description and characteristics. An important part is to include (either in this interface or in a separate one) an entry point of the resource calendar, as it is likely that the machines are not always available. The jobs interface would serve to enter all data related to the jobs and to their relationship with the machines. Note that some of these data must be particularly awkward to be entered, such as, e.g. those related to the sequence-dependent setups. Special care should be put to devise simple screens for this type of interface, as it relates to data that are frequently modified. Nevertheless, some of these data would not change, therefore past configurations should be stored and the scheduler should be asked whether these data must be pre-loaded in order to ease the task of entering new information, or not. In order to be usable, maintenance screens should be easy to work with. We advocate the usage of simple data wizards and automation tools. For example, when purchasing an additional parallel machine, it is surely easier to copy an existing one and later specifying the small differences than to introduce a new machine from scratch. The same can be said regarding entering new jobs into the system. Finally, note that even in the case of a scheduling tool seamlessly connected to other information systems providing all sources of data, we believe that this submodule should be kept, so that the tool is able to generate new scenarios for the Scenario Management submodule.
12.4.4 Scheduling Control A separate interface should be devised for handling in real-time the data coming from the BLU/DAM module. Regarding the Scheduling Control submodule, it is to note that real-time data coming from the BLU/DAM must be handled independently. Should the current schedule receive an event from the production floor, this event must generate a visual warning to the user. Once this warning is accounted for, a detailed report of changes to the current schedule should be provided. Some of this information is needed in order to cope with functionalities mentioned in Sect. 11.6.8. More specifically, input data checking and feasibility analysis must be confronted upon each new scenario.
12.4.5 Algorithm Generator Interface Last but not least, the scheduling tool should allow for the creation of new algorithms. In order to hide the small details of the algorithms to the user, a friendly interface
330
12 Advanced Design of Scheduling Tools
based on wizards is preferable, which is foreseen in our proposal to be the goal of the Algorithm Generator Interface submodule. The functionality of new algorithms was put forward in Sect. 11.6.3.
12.5 Schedule Generator Module This module contains four main submodules, i.e. Algorithm Library (which in turn may be divided into Scheduling Algorithms and Rescheduling Algorithms), Algorithm Generator, Scheduler and Dispatcher, and Preprocessor. In order to be adaptable, the optimisation algorithm must work on an abstraction of the scheduling model, or better, on an abstraction of the representation of a possible solution. For example, a typical permutation flow shop solution for makespan criterion can be represented with a simple permutation of the jobs. The detailed schedule with all the start and finish times of every task is many times of little relevance for the optimisation methods. As mentioned before, these abstractions are provided by the BLU/DAM. Notice that once the solution to a problem is returned to the BLU/DAM, a complete and much more detailed schedule might be built by the user interface module. What should be mentioned as a part of the architecture is the separation of all nonessential constraints from the schedule generation process. Many constraints can be accounted for when the detailed schedule is constructed. Of course some level of accuracy will be lost in the process but it has to be carefully studied whether this decreased accuracy is compensated by a more general and adaptable optimisation method. In order to reflect this, we separate the Algorithm Library submodule from the Scheduler and Dispatcher submodule. A given—and more general—algorithm produces an optimised production schedule where all major constraints have been considered. In a second step, the Scheduler and Dispatcher submodule produces an even more detailed schedule where minor constraints are also considered. By operating in this way, the scheduling tool might accommodate new constraints and new situations in a more flexible and agile way. Similarly, the number and variety of optimisation criteria or performance measures found in practice is extremely large. As a result, for the calculation of the performance measure for a given solution, a two-stage approach is preferable. In the first stage, a detailed schedule is derived from the abstract representation of the solution. All relevant data, and most importantly, completion times of all tasks, are calculated. In a second step, specific performance criteria are derived from the completion times calculated in the first stage. This two-phase approach allows for a large flexibility and independence when defining new and ad hoc criteria. With the previous premises, a given scheduling algorithm does not need to know in detail neither the specific constraints and small details of the underlying model nor the particular scheduling criterion. Notice also that the Algorithm Library should contain not only full-scale optimisation algorithms but also some smaller schedule repair and rescheduling algorithms that might be invoked by the user interface module as a result of changes in a given
12.5 Schedule Generator Module
331
solution or as the response to events in the production floor. Examples of these specific approaches are summarised, e.g. in Li et al. (2000). We would like to point out an important issue here. As of today, and according to our experience, most companies are using extremely simple scheduling methods like list algorithms, if at all. Therefore, when implementing and deploying a new scheduling tool, the focus should not be on the accuracy and effectiveness of the optimisation algorithms as these are likely to outperform human schedulers in many scenarios. Conversely, special care should be put on assuring the success of this scheduling software as a whole by providing flexibility and expandability. Among the algorithms, there is a broad distinction between specific algorithms and generic algorithms. Specific algorithms are designed for solving a particular model, while a generic algorithm may be applied to a wide range of scheduling problems. In practice, most commercial scheduling tools employ general-purpose algorithms, such as genetic algorithms or tabu search (e.g. SAP-APO employs genetic algorithms). As mentioned, both types of algorithms have advantages and disadvantages. However, there are some reasons for not overlooking specific algorithms: • Exact algorithms. With the increasing power of computers, more and more problem instances may be solved by exact algorithms (i.e. enumeration methods). Typical generic algorithms for exact methods are based in integer programming models that are relaxed into continuous models in order to obtain bounds to perform a branch and bound method. However, it is known that, for most scheduling problems, such bounds are extremely bad and therefore are not efficient in the bounding procedure. A promising avenue in this regard is to employ the so-called hybrid methods (i.e. combining exact methods and metaheuristics, see Jourdan et al. 2009 for a review). • Unfeasible solutions. Most real-life scheduling models must deal with unfeasible solutions—in fact, the aim of scheduling is, in most cases, simply obtaining a feasible solution for the problem (Hopp and Spearman 1996). While the performance of metaheuristics is extremely good for problems where the codification of the solutions does not lead to unfeasible solutions, this is not true for the case where such algorithms should handle unfeasible solutions. In contrast, specific algorithms for the model under consideration may yield very good (and feasible) solutions in a relatively short time period. • ‘In-house’ algorithms. It may be that the schedulers have devised efficient solution procedures for the specific scheduling problem based on their experience. Although some of these algorithms may be naïve, they can cope well with specific performance criteria, or perform efficiently for certain specific constraints. • Complementarities between generic and specific algorithms. For many cases, the performance of the generic algorithm heavily depends on the initial solution, usually provided by one or several specific algorithm(s). The Algorithm Library should give some hints regarding the selection of the algorithm. On one hand, it may be that the specific problem under consideration cannot be fit into the models that can be solved by the algorithms contained in the library. In this case, the tool should suggest/propose the usage of algorithms included in the library that can solve problems which are similar to the one under consideration.
332
12 Advanced Design of Scheduling Tools
On the other hand, it may happen that more than one algorithm can be employed to solve a particular problem. From all these, the tool should suggest/propose those more suitable for each case. Regarding the capacity of a manufacturing scheduling tool to be enhanced with new algorithms, McKay et al. (2002) note that few available tools contain libraries of configurable algorithms that plug and play. It has to be noted that the requirement is not only that completely new algorithms can be included in the library, but also that existing algorithms can be tailored and that certain parts of these algorithms can be integrated into new ones. With respect to the extensibility of scheduling tools, also McKay et al. (2002) state that few of them allow the enhancement or combination of existing algorithms in a simple manner. For most commercial software either these algorithms cannot be enhanced or the procedure for their enhancement is extremely complex (Stadtler and Kilger 2002). The blocks described in this section serve to implement many functionalities discussed in an earlier chapter. First, model detection functionalities (Sect. 11.6.2) can be implemented in the Preprocessor submodule although this requires intervention from the user interface module. Regarding to problem-solving functionalities (Sect. 11.6.3), rescheduling algorithms are included into the Algorithm Library submodule together with scheduling algorithms (thus allowing multi-algorithm scheduling). An Algorithm Generator submodule is connected to the Algorithm Generator Interface (already discussed in Sect. 12.4) to facilitate the generation of new algorithms, which again requires a tight integration with the user interface. The Algorithm Library can also contain functionalities for the evaluation of algorithms. The only functionality presented in Sect. 11.6.3 and not included in our proposal is the incorporation of the human expertise, as their advantages are a subject of controversy. However, their integration in the proposed architecture is relatively straightforward. Finally, functionalities related to the evaluation of solutions for several objectives (discussed in Sect. 11.6.4) are covered by the Scheduler and Dispatcher submodule. Cleanly modularising this part of the architecture is a challenging task as it is tempting to incorporate algorithm logic in other modules. However, abstraction and modularisation is a must in order to avoid re-implementation of other modules at each implementation of a scheduling tool.
12.6 Conclusions and Further Readings In this chapter we have moved from the high-level, conceptual issues regarding the development of a manufacturing scheduling tool described in Chap. 11 to detailed design issues. This has resulted in an outline of the main contents of the modules identified in the architecture in Chap. 11. Summing up, the modules described in this section address a number of functionalities discussed in Chap. 11: In addition to the representation of the solutions (see Sect. 11.6.2) which is covered by the Output Representation submodule and the capability that the scheduler manipulates the solutions found by the tool (discussed
12.6 Conclusions and Further Readings
333
in Sect. 12.4), the proposed architecture setup the basis for an intuitive generation of new algorithms (see Sect. 11.6.3) by using the Algorithm Generation Interface submodule, and eases the analysis of scenarios (see Sect. 11.6.4) by employing a submodule for Scenario Management. Finally, functionalities referred to reactive scheduling (see Sect. 11.6.5) are foreseen by the submodule Scheduling Control. There are a number of issues that can be concluded from this exposition. The first one is the careful choice of the technology (computer, databases, programming languages, etc.) to be employed in the manufacturing scheduling tool. Note that many of the features described in this chapter (and particularly those referring to the user interface) cannot be implemented, e.g. on a light client or Web-based user interfaces. Another important conclusion is to realise the enormous amount of ‘overhead’ work related to the development of a manufacturing scheduling tool beyond the effort to build appropriate models and solutions procedures. Even for a tool designed to support a single scheduling model and its corresponding solution procedure, in order to make the software usable, a sheer number of functions for entering, registering, tracking and checking data have to be written. This may be another reason explaining both the difficulty to move from the optimisation-based scheduling to the decisionmaking scheduling, as well as the high failure rate of some implementations of scheduling tools if these supporting, yet vital, functions are not carefully addressed. Despite the applicability of the issues treated in the chapter regarding the implementation of a scheduling tool, the existing literature is quite scarce. This chapter has been elaborated around the ideas in Framinan and Ruiz (2010), using a lot of material from Higgins (1996), who discussed the main problem related to the interaction of the user in scheduling software. Several articles cited in the document (such as e.g. Wiers 1997, or Pinedo 2009) constitute a good point to extend some of the topics treated here. Finally, additional information on throughput diagrams can be found in Wiendahl and Tonshoff (1988).
References Baek, D., Oh, S., and Yoon, W. (1999). A visualized human-computer interactive approach to job shop scheduling. International Journal of Computer Integrated Manufacturing, 12(1):75–83. Framinan, J. and Ruiz, R. (2010). Architecture of manufacturing scheduling systems: Literature review and an integrated proposal. European Journal of Operational Research, 205(2):237–246. Higgins, P. G. (1996). Interaction in hybrid intelligent scheduling. International Journal of Human Factors in Manufacturing, 6(3):185–203. Hopp, W. J. and Spearman, M. L. (1996). Factory physics. Foundations of manufacturing management. Irwin, New York, USA. Jourdan, L., Basseur, M., and Talbi, E.-G. (2009). Hybridizing exact methods and metaheuristics: A taxonomy. European Journal of Operational Research, 199(3):620–629. Li, H., Li, Z., Li, L., and Hu, B. (2000). A production rescheduling expert simulation system. European Journal of Operational Research, 124(2):283–293. MacCarthy, B. L. and Wilson, J. R., editors (2001). Human performance in Planning and Scheduling. Taylor & Francis.
334
12 Advanced Design of Scheduling Tools
McKay, K. and Wiers, V. (2003). Integrated decision support for planning, scheduling, and dispatching tasks in a focused factory. Computers in Industry, 50(1):5–14. McKay, K. N., Pinedo, M. L., and Webster, S. (2002). Practice-focused research issues for scheduling systems. Production and Operations Management, 11(2):249–258. Pinedo, M. (2009). Planning and Scheduling in Manufacturing and Services. Springer, New York, second edition. Pinedo, M. L. and Yen, B. P.-C. (1997). On the design and development of object-oriented scheduling systems. Annals of Operations Research, 70(1):359–378. Speranza, M. and Woerlee, A. (1991). A decision support system for operational production scheduling. European Journal of Operational Research, 55(3):329–343. Stadtler, H. and Kilger, C. (2002). Supply chain management and advanced planning. Springer, Heildelberg. Wiendahl, H.-P. and Tonshoff, K. (1988). The throughput diagram - an universal model for the illustration, control and supervision of logistic processes. CIRP Annals - Manufacturing Technology, 37(1):465–468. Wiers, V. (1997). Human-Computer Interaction in Production Scheduling: Analysis and Design of Decision Support Systems for Production Scheduling Tasks. Technische Universitiet Eindhoven. Wiers, V. and Van Der Schaaf, T. (1997). A framework for decision support in production scheduling tasks. Prod Plann Control, 8(6):533–544. Wortman, J., Euwe, M., Taal, M., and Wiers, V. (1996). A review of capacity planning techniques within standard software packages. Production Planning & Control, 7(2):117-128.