Atmos. Chem. Phys., 10, 4065–4083, 2010 www.atmos-chem-phys.net/10/4065/2010/ doi:10.5194/acp-10-4065-2010 © Author(s) 2010. CC Attribution 3.0 License.
Atmospheric Chemistry and Physics
Airborne measurements of the spatial distribution of aerosol chemical composition across Europe and evolution of the organic fraction W. T. Morgan1 , J. D. Allan1,2 , K. N. Bower1 , E. J. Highwood3 , D. Liu1 , G. R. McMeeking1 , M. J. Northway3 , P. I. Williams1,2 , R. Krejci4 , and H. Coe1 1 Centre
for Atmospheric Science, University of Manchester, Manchester, UK Centre for Atmospheric Science, University of Manchester, Manchester, UK 3 Department of Meteorology, University of Reading, Reading, UK 4 Department of Applied Environmental Science, Atmospheric Science Unit, Stockholm University, Stockholm, Sweden 2 National
Received: 27 November 2009 – Published in Atmos. Chem. Phys. Discuss.: 16 December 2009 Revised: 1 April 2010 – Accepted: 27 April 2010 – Published: 29 April 2010
Abstract. The spatial distribution of aerosol chemical composition and the evolution of the Organic Aerosol (OA) fraction is investigated based upon airborne measurements of aerosol chemical composition in the planetary boundary layer across Europe. Sub-micron aerosol chemical composition was measured using a compact Time-of-Flight Aerosol Mass Spectrometer (cToF-AMS). A range of sampling conditions were evaluated, including relatively clean background conditions, polluted conditions in North-Western Europe and the near-field to far-field outflow from such conditions. Ammonium nitrate and OA were found to be the dominant chemical components of the sub-micron aerosol burden, with mass fractions ranging from 20–50% each. Ammonium nitrate was found to dominate in North-Western Europe during episodes of high pollution, reflecting the enhanced NOx and ammonia sources in this region. OA was ubiquitous across Europe and concentrations generally exceeded sulphate by 30–160%. A factor analysis of the OA burden was performed in order to probe the evolution across this large range of spatial and temporal scales. Two separate Oxygenated Organic Aerosol (OOA) components were identified; one representing an aged-OOA, termed Low VolatilityOOA and another representing fresher-OOA, termed Semi Volatile-OOA on the basis of their mass spectral similarity to previous studies. The factors derived from different flights were not chemically the same but rather reflect the range of
Correspondence to: W. T. Morgan (
[email protected])
OA composition sampled during a particular flight. Significant chemical processing of the OA was observed downwind of major sources in North-Western Europe, with the LV-OOA component becoming increasingly dominant as the distance from source and photochemical processing increased. The measurements suggest that the aging of OA can be viewed as a continuum, with a progression from a less oxidised, semivolatile component to a highly oxidised, less-volatile component. Substantial amounts of pollution were observed far downwind of continental Europe, with OA and ammonium nitrate being the major constituents of the sub-micron aerosol burden. Such anthropogenically perturbed air masses can significantly perturb regional climate far downwind of major source regions.
1
Introduction
The chemical composition of the atmospheric aerosol burden has significant implications for its climate impacts (e.g. Forster et al., 2007). Specifically, it plays a major role in determining the scattering or absorbing nature of the aerosol and has an important control upon its affinity for water uptake. Furthermore, the chemical composition of the particle phase is an important component of global and regional biogeochemical cycles (Andreae and Crutzen, 1997). These include the cycling of carbon, sulphur, nitrogen, oxygen and water. The spatial heterogeneity of the aerosol burden has significant implications for its subsequent impact. On regional scales, the direct effect of aerosols is capable of
Published by Copernicus Publications on behalf of the European Geosciences Union.
4066
W. T. Morgan et al.: Aerosol chemical composition measurements across Europe
substantially reducing the impact of greenhouse gas radiative forcing, due to their competing cooling and warming effects respectively (Charlson et al., 1992). This is particularly evident over industrialized and heavily populated regions of the Northern Hemisphere such as North America, Europe and South-East Asia. Additionally, aerosols can alter the microphysical properties of clouds (e.g. Haywood and Boucher, 2000), leading to changes in the radiation balance of the climate system and also regional meteorology (Denman et al., 2007). Several recent intensive field studies have sought to elucidate aerosol chemical composition and the processes which change it, with a focus upon their regional impacts. These include studies in Asia such as the Indian Ocean Experiment (INDOEX, Ramanathan et al., 2001) and North America such as the New England Air Quality Study (NEAQS, Bates et al., 2005; Kleinman et al., 2007; Wang et al., 2007), the International Consortium for Atmospheric Research on Transport and Transformation (ICARTT, Quinn et al., 2006; Williams et al., 2007; Brock et al., 2008; de Gouw et al., 2008) and the Megacity Initiative: Local and Global Research Observations (MILAGRO, DeCarlo et al., 2006; Kleinman et al., 2008; Baumgardner et al., 2009; Fast et al., 2009). Recent airborne studies in Europe have focused upon polluted environments in the Adriatic and Black Seas (Crosier et al., 2007) and the UK region (Morgan et al., 2009). A major conclusion of these European studies was the significant contribution of ammonium nitrate to the submicron particulate burden, particularly during highly polluted conditions. Zhang et al. (2007) presented a summary of numerous field studies in the Northern Hemisphere from the Aerodyne Aerosol Mass Spectrometer (AMS, Jayne et al., 2000; Canagaratna et al., 2007). A major theme of such analyses was the high proportion of Organic Matter (OM) contributing to the sub-micron particulate burden. The study by Zhang et al. (2007) indicated that the OM component was dominated by oxygenated species relative to Primary Organic Aerosol (POA) and that the mass fraction of the more oxidised component compared to the total organic mass increases away from urban environments. Comparison of such ambient measurements of Secondary Organic Aerosol (SOA) with atmospheric chemistry models reveals significant discrepancies between them (Volkamer et al., 2006, and references therein). Furthermore, such discrepancies increase as a function of photochemical age. Coupling of a thermodenuder system with an AMS indicated that the SOA component could be separated in terms of their volatility, with more aged-SOA being less volatile than fresher-SOA (Huffman et al., 2009). Furthermore, the POA component was shown to be semi-volatile. Such results are consistent with recent frameworks which have treated the entire OM component as semi-volatile (Donahue et al., 2006; Robinson et al., 2007). This is in contrast to traditional modelling approaches that prescribe the POA to be non-volatile and inert (Donahue et al., 2009). Recently, such a framework Atmos. Chem. Phys., 10, 4065–4083, 2010
has been implemented to explain OM volatility and composition variations both downwind of a megacity source and across a global ground-based dataset (Jimenez et al., 2009). The present study seeks to elucidate the spatial distribution and chemical evolution of the sub-micron particulate mass across a broad range of scales, with particular emphasis upon the OM component and its contrasting behaviour compared to inorganic species. We do so using measurements drawn from two related aircraft campaigns across Northern Europe, a region that plays an important role in the global aerosol budget. The major part of the analysis consists of measurements made during May 2008 as part of the European Integrated Project on Aerosol Cloud Climate and Air Quality Interactions (EUCAARI, Kulmala et al., 2009) airborne intensive study, known as the EUCAARI-LONG Range EXperiment (EUCAARI-LONGREX, henceforth referred to as LONGREX). These measurements are complemented by flight operations based out of the UK, which took place during April and September 2008 as part of the Appraising the Direct Impacts of Aerosol on Climate (ADIENT) project. A key aim of these projects is an evaluation of the relative contribution of particular chemical components to the aerosol burden. This includes characterisation of the multiple components which make up the OM burden, along with their subsequent evolution in the atmosphere. The present dataset is well placed to investigate processes governing the formation and transformation of atmospheric aerosol due to the broad range of spatial scales investigated.
2
Method
The UK Facility for Airborne Atmospheric Measurements (FAAM) BAe-146 research aircraft took part in the LONGREX campaign in conjunction with the Deutsches Zentrum f¨ur Luft-und Raumfahrt (DLR) Falcon 20-E5. The LONGREX campaign was closely coordinated with the Intensive Observation Period at Cabauw Tower (IMPACT), the second major part of the EUCAARI airborne intensive operational period, although the analysis presented here is based solely on data obtained during LONGREX. Principally, the BAe-146 operated within the planetary boundary layer, while the Falcon operated at high-altitude in the free troposphere. The Falcon operated a LIDAR system which included a High Spectral Resolution LIDAR mode (HSRL, Esselborn et al., 2008) delivering aerosol backscatter and extinction coefficients. Real time LIDAR data were utilised during flight operations to identify the location of pollution plumes, which were subsequently sampled in-situ by the BAe-146. Flight operations were conducted across Northern Europe from the 6–22 May. A period of stable anticyclonic conditions characterised the first eight days of the project from the 6–14 May. Two more flights were conducted during LONGREX over the 21–22 May period, www.atmos-chem-phys.net/10/4065/2010/
W. T. Morgan et al.: Aerosol chemical composition measurements across Europe
4067
a. 65 Period ADIENT-1 LONGREX-1 LONGREX-2 LONGREX-3 ADIENT-2
60
Date(s) 16 April 06-08 May 10-14 May 19-20 May 18-25 September
7
Latitude (ºN)
B357
(Pc)
55
2
Lp (Pa) 1
B374
50
B369
4 6
Cr (Pb) Ca
3
B406
5
Ob
B362 45 -20
-10
0
10
20
30
Mass
-3
b.
concentration (µg sm )
Longitude (ºE) 8
Organics Nitrate Sulphate Ammonium
6 4 2 0 1
2
3
4
5
6
7
Zone
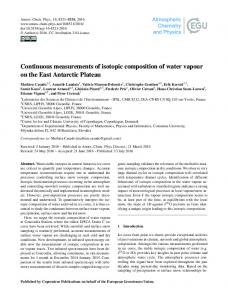
Fig. 1. (a) Flight tracks of the BAe-146 considered by this analysis for segments below 3000 m. The periods identified in the figure are described in the main text and Table 1. Overlapping flight tracks are offset slightly in order to clearly discern them. The flight numbers and arrows refer to the example flights discussed in the main text. Locations relevant to this study are marked, including Liverpool (Lp), Cranfield (Cr), Cabauw (Ca) and Oberpfaffenhofen (Ob). The locations of the vertical profiles displayed in Fig. 3 are indicated by the Pa (Profile-a), Pb (Profile-b) and Pc (Profile-c) markers. (b) Summary of the AMS median mass concentrations for each zone identified in (a). The vertical bars represent the 25th and 75th percentiles.The percentile concentrations are included in the Supplementary materials in Table S3 (http://www.atmos-chem-phys.net/10/4065/2010/acp-10-4065-2010-supplement.pdf).
which was characterised by predominantly easterley conditions. Flights from LONGREX are considered along with the ADIENT flights from April and September 2008. The ADIENT flights were conducted in differing meteorological conditions, with the April flight conducted in southeasterley conditions, while the September flights took place during easterley conditions with similar transport patterns to the LONGREX period. The flight tracks are shown on Fig. 1 and are coloured according to the different flying periods and conditions. The meteorological conditions for the different periods are relatively consistent in terms of their transport patterns, with air masses advecting pollution from continental Europe downwind to either the UK region or the Eastern Atlantic Ocean (see Supplementary Materials Sect. 2, Figs. S1 and S2; http://www.atmos-chem-phys.net/ 10/4065/2010/acp-10-4065-2010-supplement.pdf). Some flights concentrated on instrument testing/calibration and are not included in the analysis. During some flights instrument performance was not optimal; data from these 3 flights have not been included. The flights included in this analysis are summarised in Table 1.
www.atmos-chem-phys.net/10/4065/2010/
2.1
Instrumentation
The FAAM BAe-146 research aircraft houses a suite of instruments capable of resolving the chemical composition, microphysical, optical and hygroscopic properties of the insitu aerosol population. Inboard aerosol instrumentation samples ambient air via stainless steel tubing from Rosemount inlets (Foltescu et al., 1995). Sub-micron particle losses have been shown to be negligible (Osborne et al., 2007). Number size distributions were measured using a wing-mounted Particle Measurement Systems (PMS) Passive Cavity Aerosol Spectrometer Probe 100X (PCASP, Liu et al., 1992; Strapp et al., 1992). The PCASP instrument optically counts and sizes particles between 0.1–3 µm diameter across 15 channels. Particle size is determined via experimental calibrations using Di-Ethyl-Hexyl-Sebacate (DEHS), which is converted to a Polystyrene Latex Sphere (PSL) equivalent size. Black Carbon (BC) mass and the number of particles containing a BC core were characterised as a function of particle size using a Droplet Measurement Technologies (DMT) Single Particle Soot Photometer (SP2, Stephens et al., 2003; Baumgardner et al., 2004). The SP2 was modified to include a two-element avalanche photodiode to improve determination of the optical size of absorbing Atmos. Chem. Phys., 10, 4065–4083, 2010
4068
W. T. Morgan et al.: Aerosol chemical composition measurements across Europe
Table 1. Flight summary for ADIENT (B357, B401-B406) and LONGREX (B362-B380) operations included in this study. All flights were conducted during 2008. The predominant meteorological conditions present are summarised, where SE refers to south-easterley, E refers to easterley and HP refers to the high pressure system during the initial LONGREX flights described in the main text. Also included is an indication of which period each flight took place during, which are abbreviated as A1 (ADIENT-1) and A2 (ADIENT-2). The LONGREX flights refer to the 3 periods in the main text, which are referred to as LONGREX-1 (L1), LONGREX-2 (L2) and LONGREX-3 (L3). Flight
Date
B357 B362 B365 B366 B369 B370 B371 B373 B374 B379 B380 B401 B402 B406
16 April 6 May 8 May 8 May 10 May 12 May 12 May 13 May 14 May 21 May 22 May 18 September 19 September 25 September
Meteorology
Period
SE HP HP HP HP HP HP HP HP E E E E E
A1 L1 L1 L1 L2 L2 L2 L2 L2 L3 L3 A2 A2 A2
particles (Gao et al., 2007). Additionally, gas phase concentrations of CO (Carbon Monoxide), O3 (Ozone) and NOx (defined as the sum of NO (Nitric Oxide) and NO2 (Nitrogen Dioxide)) were measured. The facility also provides aircraft position information and measurements of standard atmospheric variables, such as temperature and relative humidity. Measurements made by an Aerodyne compact Time-ofFlight Aerosol Mass Spectrometer (cToF-AMS, Drewnick et al., 2005; Canagaratna et al., 2007) form the major part of this study. The instrument provides the capability to quantitatively measure the size-resolved chemical composition of non-refractory particulate matter, including OM, sulphate, nitrate, ammonium and chloride. A major advantage of the cToF-AMS is the ability to provide high time resolution measurements with enhanced precision and sensitivity. Thus it is ideal for airborne deployments. Previous studies (Crosier et al., 2007; Capes et al., 2008; Morgan et al., 2009) have detailed the AMS sampling strategy onboard the BAe-146. The sampling losses for the cToF-AMS inlet system were estimated experimentally to be approximately 10% by number across the size range of the AMS. This was accomplished by comparing a Condensation Particle Counter (CPC) upstream of the inlet system with one situated immediately prior to the sampling orifice of the AMS while sampling monodisperse aerosol. Details specific to the cToF-AMS data analysis will be discussed in the following subsection.
Atmos. Chem. Phys., 10, 4065–4083, 2010
Operating Region North-West UK coast North-Western Europe & North Sea Eastern Europe & Baltic Sea North-Western Europe Baltic Sea North-Western Europe & North Sea North-Western Europe & North Sea Southern UK coast Eastern Atlantic North-Western Europe North-Western Europe and Southern UK coast Southern UK coast Eastern UK coast Southern and Western UK coasts
2.2
AMS data quantification
The AMS data analysis was performed using the standard SQUIRREL (SeQUential Igor data RetRiEvaL) ToFAMS software package. Mass spectrum deconvolution is accomplished using the fragmentation table approach described by Allan et al. (2004). Error estimates are generated according to the model documented by Allan et al. (2003). Mass concentrations derived from the AMS are reported as micrograms per standard cubic metre (µg sm−3 ) i.e. at a temperature of 273.15 K and pressure of 1013.25 hPa. Power was unavailable to the AMS between flights due to operational constraints. Through the use of plug valves to isolate the AMS chamber, a vacuum of typically less than 0.5 Torr is maintained while the turbo-pumps are powered down. Ionisation efficiency (IE) calibrations were performed regularly before and after each flight during the flying periods. Values determined from both pre-flight and post-flight calibrations (i.e. taking place on the same day) exhibited little variability. Post-flight values were used as these were considered to be more reliable compared with pre-flight values due to the reduced instrument background post-flight. A faulty ground power unit during LONGREX caused a loss of power to the aircraft prior to flight B365 while the AMS was pumping down. This led to slightly enhanced background concentrations in the AMS vacuum chamber due to a filament failure associated with the power loss during flights B365–B369. Recent laboratory evidence (Matthew et al., 2008) suggests that the AMS Collection Efficiency (CE, Huffman et al., 2005) is significantly modulated by particle phase. Previous AMS data collected in Europe on the BAe-146 www.atmos-chem-phys.net/10/4065/2010/
W. T. Morgan et al.: Aerosol chemical composition measurements across Europe
3
Spatial distribution of aerosol chemical composition across Europe
The differing spatial scales and meteorological contexts considered by this analysis provide a thorough examination of the aerosol chemical composition in Europe during anticyclonic conditions. The distribution of the chemical components measured by the AMS will be discussed here in order to set the context for the subsequent analysis and discussion. Both the broader scale and flight period/condition specific details will be summarised. The flight periods were split according to the period in which they were conducted and their general meteorological conditions. Their designations are summarised in Table 1 and Fig. 1. The spatial distribution of the total OM for Straight and Level Runs (SLRs) below 3000 m is shown for the entire dataset in Fig. 2. The boundary layer height was predominantly below 2000 m but during some conditions, an elevated planetary boundary layer was observed so 3000 m was used as a threshold altitude. The distribution indicates that OM is www.atmos-chem-phys.net/10/4065/2010/
65
-3
AMS Total Mass (µg sm ) 1.0 25.0
0.7 0.6
60
Latitude (ºN)
0.5 0.4 55 0.3 0.2
Organics mass fraction
has used a CE correction following the principle developed by Crosier et al. (2007). This was developed using a simple empirical treatment of the CE as a linear function of the nitrate content of the aerosol based upon comparison of AMS sulphate with filter measurements. Matthew et al. (2008) conducted a detailed laboratory study of the AMS CE across a range of compositions. Their study included a comparison of their laboratory derived correction with the Crosier et al. (2007) parameterisation. This indicated that the simpler linear treatment overestimated the CE at intermediate ammonium nitrate mass fractions. A comparison between the two techniques as part of this work revealed that the two approaches showed a maximum discrepancy at intermediate ammonium nitrate mass fractions that did not typically exceed 25% and was considerably less at high and low mass fractions. Consequently, we use the correction developed by Matthew et al. (2008) to estimate the CE of the AMS in this study. The AMS total mass concentrations were converted to total volume concentrations using the densities reported by Cross et al. (2007), which correspond to 1.27 g cm−3 for organics and 1.77 g cm−3 for inorganics. Comparison of the estimated AMS total volume with the PCASP indicates that campaign average agreement was within 30% (see Supplementary Materials Sect. 3, Fig. S4; http://www.atmos-chem-phys.net/10/4065/ 2010/acp-10-4065-2010-supplement.pdf). This is within the 30–50% uncertainty previously reported for PCASP volume concentration estimates (e.g. Moore et al., 2004; Hallar et al., 2006). All flights fall within the 50% agreement range except for B357. The uncertainties in the estimate are large due to the high sensitivity of the volume calculations to diameter (proportional to diameter3 ) and the uncertainties in density required to convert the AMS mass to volume.
4069
0.1
50
0.0
45 -20
-10
0
10
20
30
Longitude (ºE)
Fig. 2. AMS total mass concentrations (symbol size) and organic mass fraction (symbol colour) for low-level Straight and Level Runs (SLRs0.9) with fulvic acid across the dataset and variability in the retrieved mass spectrum was low. Furthermore, the OOA-1 profiles had low correlation with the reference HOA mass spectrum from Pittsburgh (r0.7) but the same is also true for nitrate and OOA-1. The high correlations between nitrate and OOA-2 principally occur closer to source regions due to their semi-volatile nature. The examples of high correlation of nitrate and OOA-1 are further away from source due to the ammonium nitrate concentration being sustained downwind, while the OOA-2 has been processed to OOA-1. The most stark example of this is B374, where nitrate and OOA-2 are anti-correlated while nitrate and OOA-1 are highly correlated. B374 took place far downwind of the major sources in continental Europe in the Eastern Atlantic Ocean, where the air mass had aged significantly and little precipitation had occurred upwind. Once formed, ammonium nitrate exists in a chemical equilibrium with ammonia and nitric acid, the losses of which are via dry and wet deposition only. This contrasts with OOA, which undergoes complex and continual processing involving repartitioning and oxidation. Thus the OM transforms from more volatile to less volatile condensable products as the air parcel ages downwind of source. Thus the OM is dominated by the more-oxidised form downwind of the major emission sources and is then well correlated with ammonium nitrate. www.atmos-chem-phys.net/10/4065/2010/
W. T. Morgan et al.: Aerosol chemical composition measurements across Europe
OOA-1 correlation coefficient
a.
4073
1.0 0.8 0.6 0.4 0.2 0.0 0.0
0.2 0.4 0.6 0.8 1.0 OOA-2 correlation coefficient
0.0
Fulvic Acid
HOA-Pittsburgh
Sulphate
-0.4 0.0 0.4 0.8 OOA-2 correlation coefficient
Nitrate
5
-3
Mass Concentration (µg sm )
b.
0.2 0.4 0.6 0.8 1.0 OOA-2 correlation coefficient
4
3
2
1
0 B357
B362
B365
B366
B369 OOA-1
B370 OOA-2
B371
B373
B374
B379
B380
B401
B402
B406
HOA (m/z 57 x 12.2)
Fig. 4. (a) Summary of correlations for OOA-1 and OOA-2 with both reference mass spectra and external time series. Uncentered correlation coefficients are used for the mass spectra, while Pearson’s R are used for the external time series. The fulvic acid mass spectrum is from Alfarra et al. (2004) and the HOA-Pittsburgh refers to to the deconvolved HOA solution from Zhang et al. (2005a). (b) Boxplot summary statistics of OOA-1, OOA-2 and estimated HOA mass concentrations for each flight considered in the analysis. Crosses represent the mean value, while horizontal lines represent the 25th, 50th and 75th percentiles. The whiskers represent the 5th and 95th percentiles.
Sulphate is often well correlated with OOA-2 and OOA1, which is likely due to the regional nature of these measurements and the covariance between the different chemical species. Thus factor interpretations where multiple OOA components are identified need to consider the meteorological, photochemical and geographical context at individual sampling locations when making suppositions based upon comparison with other secondary particulate species. Given that the OOA-2 component generally contains a HOA contribution, it is desirable to estimate the relative importance of the primary versus secondary components. Some previous studies have included first order estimates of OM components based upon absolute intensities at specific mass spectral markers by comparing such markers with factor component solutions (e.g. Zhang et al., 2005a; Aiken et al., 2009). Zhang et al. (2005a) reported that the HOA mass concentration can be approximated based upon a linear scaling of the signal intensity at m/z 57. Aiken et al. (2009) reported a similar relationship but with an additional correction for oxidised fragments associated with m/z 57 based upon the organic signal intensity at m/z 44. In order to derive an approximate estimate of the contribution of HOA to the OM burden in this dataset, these first order estimates are used.
www.atmos-chem-phys.net/10/4065/2010/
While such estimations are not fully quantitative, they do at least represent an approximate reference point which provides a level of justification for the decision to limit the analysis to the 2-factor solution sets. Furthermore, the estimated HOA is typically less than the OOA-2 concentration reported from the factor analysis. An important observation is that the enhanced HOA mass fractions are predominantly driven by the reduced contribution from secondary species, rather than a major increase in the absolute HOA mass loading. The Aiken et al. (2009) estimate was found to be inappropriate for this dataset as the m/z 57 contribution was often close to zero, while the organic intensity at m/z 44 was typically an order of magnitude greater. This led to negative HOA concentrations frequently being estimated using this approximation. The solutions for the entire dataset are summarised in Fig. 4b by comparing the absolute mass concentrations for the OOA-1, OOA-2 and estimated HOA. The HOA contribution is calculated using the estimation from Zhang et al. (2005a) and indicates that the median concentration is typically less than 0.5 µg sm−3 , with concentrations rarely exceeding 1 µg sm−3 . Such a result indicates that HOA typically contributes 5–20% to the regional OM burden, which is in line with previous studies (Zhang et al., Atmos. Chem. Phys., 10, 4065–4083, 2010
4074
W. T. Morgan et al.: Aerosol chemical composition measurements across Europe
Normalised signal
a.
0.25
Spectrum A
b.
0.30
0.20
0.0 0.2 0.4 0.6 0.8 1.0 Uncentred correlation with HOA Pittsburgh mass spectrum
0.15 0.10
0.25
0.05
Spectrum A
0.00 20
40
60 m/z
80
LV-OOA
Spectrum B
0.08 0.06 0.04
Uncentred correlation with fulvic acid mass spectrum
0.15
2
m/z 44:OM
Normalised Signal
100
0.20
0.10
Individual data points OOA-1 OOA-2
0.0
0.02
1.0
0.00 20
40
60 m/z
80
Normalised Signal
0.08
100
0.10
Spectrum B
Spectrum C
SV-OOA
0.05
0.06 0.04 0.02
0.00 20
40
60 m/z
80
100
Spectrum C
HOA
0.00
0.00
0.05
0.10 m/z 43:OM
0.15
0.20
Fig. 5. (a) Examples of mass spectra derived from the PMF analysis. (b) Relationship between the fractional signal at m/z 44 normalised to the total organic loading and m/z 43 normalised to the total organic loading. Grey markers refer to individual data points from all of the flights. Diamond and circle markers denote the same measures from the high and low oxygenated factors (OOA-1 and OOA-2) identified from the PMF analysis, coloured and sized according to their correlation with Pittsburgh HOA and laboratory derived fulvic acid respectively. The mass spectra shown in (a) are identified on (b) by the arrow and text box. The thick dashed black lines refer to guidelines from Ng et al. (2009) discussed in the main text. The dashed green lines refer to guideline bounds for the different PMF clusters identified as LV-OOA, SV-OOA and HOA.
2007). Consequently, the dataset indicates that the OOA component dominates the OM burden across Europe on the regional scale, thus this will be the focus of the subsequent discussion. 4.3
Interpretation of the factor analysis
Typical example mass spectra from different flights from the 2 factor solutions are presented in Fig. 5a. Spectrum A is highly consistent with LV-OOA, with the spectrum being dominated by normalised organic signal intensity at m/z 44 and with a correlation coefficient of 0.99 with fulvic acid. This spectrum is taken from flight B366, as is spectrum B which is distinguished by the normalised m/z 43 and 44 peaks being almost equal. This is consistent with SV-OOA spectra (e.g. Ulbrich et al., 2009; Jimenez et al., 2009) and the relative concentration of this component versus the HOA estimated suggests it is dominated by OOA. Spectrum C is the B357 HOA-type factor which had a correlation coefficient of 0.91 with the reference HOA spectrum. This factor is likely dominated by HOA-like components rather than OOA. A key feature of these example spectra is the changing normalised signal intensities at m/z 43 and 44, with HOA being dominated by m/z 43, SV-OOA being closer to a 1:1 ratio and LV-OOA being dominated by m/z 44.
Atmos. Chem. Phys., 10, 4065–4083, 2010
This is illustrated in Fig. 5b by the relationship between the organic signal intensity at m/z 43 and 44, which are both normalised to the total OM loading. Both individual data points from all of the flights and the normalised signal intensities from the resolved factor components for each flight are shown. This shows that as the m/z 43:OM ratio decreases, the m/z 44:OM ratio increases. This is suggestive of the OM burden aging as a continuum in terms of its oxygen content from freshly formed OOA, through to highly aged OOA which exhibits a high resemblance to fulvic acid-like mass spectra. The flight operations, given their transient nature, tend to probe this continuum which is a consequence of the constant evolution of the OM component on the regional scale. This is consistent with the difficulty in separating the OOA from the HOA in the factor analysis. The relative contribution of m/z 43 and 44 to the PMF factor components also vary from flight to flight. Clearly, while the generic terms OOA-1 and OOA-2 have been widely used to label different factors retrieved by PMF analysis, they are not chemically identical but vary from one dataset to another. Hence they also exhibit this continuum feature which can be seen in Fig. 5b. The mass spectra shown in Fig. 5a are identified on Fig. 5b in order to distinguish the general classification of the OM components. The factor components retrieved by this dataset indicate that the OOA-1 and OOA-2 are separated in terms
www.atmos-chem-phys.net/10/4065/2010/
W. T. Morgan et al.: Aerosol chemical composition measurements across Europe of their m/z 44:OM ratio, with OOA-2 being less than 0.10 and OOA-1 being greater than 0.14. This is reflected by the green dashed horizontal line on Fig. 5b between these two clusters. B357 is the only flight where the second factor is interpreted as being dominated by HOA rather than SV-OOA due to its high resemblance to reference spectra and good agreement with literature values for POA to primary emission tracers. The two factors (from B365 and B371) which also exhibit reduced signal at m/z 44 do not agree as well with such literature values. Furthermore, they are partially oxidised (m/z 44=0.01) and as shown in Fig. 4b, their absolute concentrations are significantly greater than the estimated HOA. Thus the second green dashed horizontal line is used to separate the B357 factor from the other OOA-2 components identified. The identified continuum is consistent with a PMF analysis of a worldwide AMS ground-based dataset by Ng et al. (2009). The black dotted lines in Fig. 5b show the general relationship between the m/z 44:OM ratio and the m/z 43:OM ratio from this worldwide dataset. Based upon the framework presented by Jimenez et al. (2009), we classify the OOA-1 components as LV-OOA and the OOA-2 as SV-OOA except for the B357 OOA-2 factor, which is classified as HOA. Aiken et al. (2008) showed that the contribution of m/z 44 to the OM is an excellent proxy for the Oxygen-to-Carbon (O:C) ratio of OM. Such an observation is attributed to SOA formation and photochemical aging. Thus the observed continuum of organic evolution is reflected by progressive aging from a SV-OOA dominated burden to a LV-OOA dominated burden. The separation of the factor profiles in terms of their normalised m/z 44 signal highlights that retrieved PMF profiles tend to be strongly determined by the extremes in the examined dataset as the actual data predominantly fall within a band of relatively oxidised OM between 0.10–0.20. The extremes on either side of this band are representative of very fresh and very aged OM respectively. The key question regarding this analysis technique is whether static PMF factor profiles are capable of reflecting changes in a continuum i.e. is it possible to simplify the observed evolution using such a limited number of factors? The variability in terms of the mass spectral fingerprints of the LVOOA and SV-OOA components shown in Fig. 4b highlight this point. Such variations are likely a complex combination of both atmospheric/chemical processes and instrumental variability from flight to flight (and also within a single flight). Ng et al. (2009) show the same phenomenon in their multiple ground-based dataset. In order to test whether the mass fractions of LV-OOA and SV-OOA can replicate the evolution in the m/z 44:OM ratio, correlation coefficients for each flight are calculated. The LV-OOA organic mass fraction and m/z 44:OM have a correlation coefficient ranging from 0.55–0.98 across the dataset (see Supplementary Material Fig. S11; http://www.atmos-chem-phys.net/10/ 4065/2010/acp-10-4065-2010-supplement.pdf). This indicates that the dataset can reproduce the evolution in the OM www.atmos-chem-phys.net/10/4065/2010/
4075
by comparing the relative concentrations of the LV-OOA and SV-OOA components. Thus the retrieved factors reflect the continuity of processing by increased oxidation in the atmosphere, consistent with the processing paradigm proposed by Jimenez et al. (2009).
5 5.1
Evolution of the organic aerosol component Transformation across Europe during a anticyclonic case study
The LONGREX-2 period presents an opportunity to probe the evolution of the chemical composition across the regional scale due to the consistent meteorological situation and reduced influence of wet deposition. Geopotential height fields and air mass back trajectories during the period are included in Supplementary Material Sect. 2, Fig. S3 (http://www.atmos-chem-phys.net/10/4065/ 2010/acp-10-4065-2010-supplement.pdf). The flight operations conducted during the period are summarised in Fig. 6a, where absolute mass concentrations between 250–2500 m are shown as a function of longitude. Points above 2500 m were generally outside of the boundary layer so are not included. Points lower than 250 m are omitted due to the formation of shallow layers over the sea surface decoupled from the atmosphere above. These were frequently encountered in marine regions sampled in this study. Such features, while interesting, are considered unrepresentative of the evolution of the chemical composition on the European scale. The aircraft flew on a roughly east-to-west transect across Northern Europe over the course of 4 days. At longitudes between 20 E and 25 E, concentrations were typically low (≈1 µg sm−3 for sulphate and organics) and constituted background conditions relative to the other locations sampled. Concentrations of both organic and inorganic species increased substantially to the west, with concentrations in the range of 3–7 µg sm−3 at the 75–95th percentiles, reflecting the increased density of anthropogenic sources encountered. The longitudinal gradients reveal that the median and the Inter Quartile Range (IQR) of the OM concentration is relatively constant west of 15 E, with concentrations typically between 3–5 µg sm−3 . The larger IQR in the 15–20 E band is likely due to the transition from background conditions to polluted conditions. The OM concentrations contrast with the inorganic mass concentrations, which display somewhat differing trends and variability. The ammonium sulphate concentrations tend to build from east-to-west but with greater variability than the OM. This contrast is likely a consequence of the differing formation/processing time scales and source distributions for ammonium sulphate versus OM. The ammonium nitrate concentrations show enhanced variability throughout with no noticeable trend to the east of the meridian, although the median concentration increases to the west of this longitude. This is a reflection of the NOx and ammonia source fields across Atmos. Chem. Phys., 10, 4065–4083, 2010
4076
W. T. Morgan et al.: Aerosol chemical composition measurements across Europe Approximate air mass transport a.
Nitrate Sulphate Organics
-3
Mass Concentration (µg sm )
8
6
4
2
0
0.8
160
0.6
120
0.4
80
0.2
40
0.0
-1
200
-3
1.0
OM:∆CO (µg sm ppm )
LV-OOA Organic Mass Fraction
b.
0 -15 to -10
-10 to -5
-5 to 0
0 to 5
5 to 10
10 to 15
15 to 20
20 to 25
Longitude (ºE)
Fig. 6. Boxplot summary statistics of aerosol chemical composition as a function of longitude during LONGREX-2, where the air mass transport was approximately east-to-west. (a) Summarises the concentrations for nitrate, sulphate and organics. (b) Presents the LV-OOA organic mass fraction (left) and the OM:1CO ratio (right). Crosses represent the mean value, while horizontal lines represent the 25th, 50th and 75th percentiles. The whiskers represent the 5th and 95th percentiles. Values are for altitudes between 250–2500 m.
Europe, with peak emissions of these emissions occurring in North-Western Europe (e.g. Reis et al., 2009). This is especially true in terms of ammonia, which is more readily available in Western Europe compared to further east due to intensive agricultural activities. The contrast with OM reflects this source distribution. Additionally, their differing formation and processing time scales discussed in Sect. 4.3 likely play a role. In terms of the chemical evolution of the OM, this period highlights the highly dynamic nature of the OM burden and is shown in Fig. 6b. In the background conditions to the east, the LV-OOA dominates, with a median mass fraction of close to 90%. Between 15 E and 20 E, where OM concentrations sharply increase, the LV-OOA mass fraction is highly variable due to the transition from background to more polluted conditions. The enhanced OM concentrations are driven by the SV-OOA component, as more freshly formed material is encountered as the aircraft travels westwards. This input of fresher material continues further to the west as the SV-OOA fraction increases (decreasing LV-OOA fraction), which is consistent with the urban source distribution in continental Europe. The LV-OOA fraction is then relatively constant as far west as 10 W. West of this, over the Eastern Atlantic Ocean, LV-OOA undergoes a marked increase with the median and 75th percentiles being 65% and 80% respectively. This increase in the LV-OOA reflects the lack of fresh pollution contributing to new SV-OOA formation and is coinciAtmos. Chem. Phys., 10, 4065–4083, 2010
dent with an increase in the median concentration of ozone beyond the zero meridian line, from 60 ppb to 80 ppb, which is suggestive of photochemical processing within the high pressure system. Based upon the aforementioned back trajectories, this represents approximately one day of air mass transit. A key observation during the LONGREX-2 period is the relationship between the LV-OOA mass fraction and the OM:1CO ratio shown in Fig. 6b (where 1CO correponds to CO minus the background value), with the enhancement in the OM:1CO ratio from a median value of approximately 20 µg sm−3 ppm−1 to over 100 µg sm−3 ppm−1 west of 15 E occurring upon the addition of SV-OOA mass which enhances the OM concentrations. These values then decrease west of the meridian to 60–100 µg sm−3 ppm−1 as the LVOOA mass fraction becomes more dominant and OM concentrations decrease slightly. De Gouw and Jimenez (2009) reported OM:1CO ratio’s for urban emissions containing large amounts of SOA in the range of approximately 50– 90 µg sm−3 ppm−1 in North America and Tokyo. Thus the values reported here tend towards greater values or even exceed those reported previously. The measurements presented here are close to those reported for the highly polluted Po Valley region in Northern Italy described in Crosier et al. (2007). The measurements are consistent with a rapidly formed OM close to source, which subsequently ages substantially downwind. This contrasts with the evolution of the inorganic www.atmos-chem-phys.net/10/4065/2010/
W. T. Morgan et al.: Aerosol chemical composition measurements across Europe constituents in the form of ammonium nitrate and ammonium sulphate, which evolve on differing time scales during this period. 5.2
Transformation with respect to distance from source and photochemical processing
The broadly similar transport patterns prevalent throughout the dataset (i.e. sampling of European air masses at distances both upwind, over continental Europe itself and at varying scales downwind) provides the potential to link the evolution of the aerosol chemical composition across this large range of spatial scales. The flight operations can be characterised according to the CO:NOx and O3 :NOx ratios, which are qualitatively used as proxies for proximity to major sources and photochemical processing. The O3 :NOx ratio is shown versus the CO:NOx ratio in Fig. 7c, indicating good first order agreement between their respective evolutions. In urban areas, CO concentrations are typically 5– 15 times NOx concentrations (e.g. Parrish et al., 2009) due to enhanced NOx emissions associated with primary combustion sources. Furthermore, on urban-to-near-urban scales, NOx levels are enhanced relative to O3 due to titration by NO. This yields an O3 :NOx ratio less than 1, thus this range in O3 :NOx and CO:NOx is classified as near-urban. Subsequent dilution and photochemistry downwind of urban emissions will lead to an enhancement in the ratios, as NOx is oxidised to form HNO3 and PAN on a time scale of a few hours (e.g. Neuman et al., 2009). This evolution is characterised by ratio values between 1 and 100, where O3 concentrations steadily increase (see Supplementary Material Sect. 4, Fig. S5; http://www.atmos-chem-phys.net/10/4065/ 2010/acp-10-4065-2010-supplement.pdf). This increase in O3 and decrease in NOx is characteristic of photochemical activity. Furthermore, across this range of O3 :NOx , CO tends to steadily decrease, indicative of dilution downwind of its major sources. The 1–10 O3 :NOx is chosen as the near-source range as the CO concentrations are similar to those at less than 1, while O3 levels are steadily increasing from their minimum value close to urban sources. The 10–100 O3 :NOx range is then split between near-outflow and far-outflow regimes, principally based upon its gradient across the LONGREX-2 period (not shown) where it increased above 50 at longitudes to the west of 10W. Values greater than 100 are characteristic of background conditions, with reduced O3 , CO and NOx concentrations indicative of dilution. The O3 :NOx ratio is used to characterise the flights as both measurements were available on all flights, whereas CO was absent during ADIENT-2. The results of this grouping are shown in Fig. 7 by contrasting the evolution from near-source conditions, predominantly over polluted regions of continental Europe and the associated near-field and far-field outflow from it. Also shown are the background conditions encountered, which were predominantly encountered in the Baltic www.atmos-chem-phys.net/10/4065/2010/
4077
Sea region, for a contrast with the more polluted regimes. The near-urban points are not included as too few were sampled to yield a statistically robust summary. The analysis indicates that under polluted and highly photochemically active conditions at near-source locations, ammonium nitrate and OM are the dominant chemical components. Concentrations range from 4.5–10.0 µg sm−3 and 4.0–6.5 µg sm−3 at the 50–95th percentile levels respectively. The upper percentile dominance of nitrate diminishes with increasing distance from source but it still maintains a significant fraction of the sub-micron mass, with concentrations comparable to sulphate. OM is the dominant component at all scales outside of the most polluted conditions, where nitrate is dominant. The estimated HOA mass fraction is typically between 5–15% at the 25–75th percentile levels across the range of conditions sampled. The composition of the OOA evolves strongly as a function of the O3 :NOx ratio, with the LV-OOA fraction making up 50–65% of the OM at the 25–75th percentile levels close to source, through to 60–80% of the OM in the far-field outflow. In background conditions, LV-OOA makes up close to 90% of the OM at the 75th percentile and is at 100% at the 95th percentile. These features are reflected in the colouring of the Fig. 7c, with the LV-OOA increasing as a function of CO:NOx and O3 :NOx . The two apparent lines in the relationship are principally a consequence of the enhanced pollutant concentrations in LONGREX-1 (the lower line), during which NOx and CO were enhanced thus the O3 :NOx is shifted downwards relative to the other periods shown. The LV-OOA organic mass fraction captures this change as the LONGREX-1 OM is more dominated by SV-OOA (reduced LV-OOA fraction). The results show that significant OM concentrations are rapidly formed under polluted conditions in continental Europe and that these concentrations are maintained upon advection downwind of the major sources in Europe. Much of the enhanced mass in Europe is associated with an increase in the SV-OOA fraction but a significant fraction is associated with LV-OOA, which is indicative of rapid photochemical processing of the OM on the regional scale. The median LV-OOA fraction is always greater than the SV-OOA fraction and the LV-OOA mass fraction steadily increases upon advection downwind. OOA across Europe was frequently well correlated with ammonium nitrate and ammonium sulphate, both of which likely originate from anthropogenic sources. Furthermore, OOA is correlated with O3 :NOx , again suggestive of an anthropogenic influence. Potentially this may point to the OOA sources being anthropogenic in origin also, although this contrasts with several previous studies in Europe which have identified that SOA is predominantly derived from biogenic sources (e.g. studies in Zurich, (Szidat et al., 2006), rural/remote areas, Gelencs´er et al., 2007 and G¨oteborg, Szidat et al., 2009). A similar picture is presented for the United States by Bench et al. (2007), who demonstrated that modern Atmos. Chem. Phys., 10, 4065–4083, 2010
4078
W. T. Morgan et al.: Aerosol chemical composition measurements across Europe 10
-3
Mass Concentration (µg sm )
a.
c. 1000
8
Background
6 4 100
Far-outflow
2
Near-outflow 0 Near-outflow
Far-outflow
b.
1.0
Organic mass fraction
Nitrate
0.8
Background
Sulphate
Organics
O3:NOx
Near-source
10 Near-source
1
0.6
Near-urban
0.4 0.4 0.6 0.8 1.0 LV-OOA organic mass fraction
0.2 0.1 0.0
0
Near-source
Near-outflow
Far-outflow
Background LV-OOA
10
1
10
2
10 CO:NOx
3
10
4
10
HOA
Fig. 7. Boxplot summary statistics of aerosol chemical composition as a function of proximity to source and photochemical processing. (a) Summarises the concentrations for nitrate, sulphate and organics, while (b) presents the organic mass fractions of LV-OOA and estimated HOA. Crosses represent the mean value, while horizontal lines represent the 25th, 50th and 75th percentiles. The whiskers represent the 5th and 95th percentiles. Values in (a) and (b) are for altitudes between 250–2500 m. (c) Summary of the relationship between the O3 :NOx ratio and the CO:NOx ratio for the dataset except for ADIENT-2 where no CO measurement was available. The grey horizontal lines designate the boundaries of the source proximities based upon the O3 :NOx ratio which are used in (a) and (b). The points are coloured according to the LV-OOA organic mass fraction.
carbon dominated in rural areas, which suggests a biogenic source. However, measurements in urban plumes and closer to major anthropogenic sources have indicated that anthropogenic Volatile Organic Compounds (VOCs) are the main source of OM (e.g. de Gouw et al., 2005, 2008; Bahreini et al., 2009). Furthermore, the presence of both significant anthropogenic and biogenic sources in Northern Europe could mean that the OOA results from a mixture of both anthropogenic and biogenic sources and/or that enhanced biogenic SOA is formed in the presence of anthropogenic pollution, which has previously been identified in the southeastern United States (Weber et al., 2007; Goldstein et al., 2009). However, the current study lacks suitable information regarding gas-phase organic precursors and/or additional OM chemical information to separate the different contributions of biogenic and anthropogenic to the total observed OM from the observations alone. Enhanced SV-OOA concentrations in North-Western Europe are strongly coupled to ammonium nitrate concentrations, which are regularly observed to peak at the top of the boundary layer. This is prescribed to partitioning of semivolatile gas phase precursors to the particle phase at reduced temperature and enhanced relative humidity (e.g. Morino Atmos. Chem. Phys., 10, 4065–4083, 2010
et al., 2006; Morgan et al., 2009). These observations are discussed in Morgan et al. (2010) in the EUCAARI special issue. 6
Conclusions
The spatial distribution of sub-micron aerosol chemical composition has been characterised based upon airborne measurements in the planetary boundary layer across Europe, north of the Alpine regions. Organic Matter (OM) and ammonium nitrate are the largest components, typically contributing 20–50% each to the non-refractory mass. Ammonium nitrate dominates in North-Western Europe where the emissions of NOx and ammonia reach their maximum. Ammonium nitrate dominates the infreqeunt but highly polluted periods sampled with concentrations ranging from 4– 8 µg sm−3 at the 75–95th percentile levels. This is consistent with the dominance of ammonium nitrate in Western Europe during periods of high pollutant concentrations identified previously (Putaud et al., 2004; Morgan et al., 2009). OM generally dominates over sulphate over the whole of Europe, with OM concentrations typically 1.3–2.5 times greater than that of sulphate. Sulphate contributes 10–30% to the www.atmos-chem-phys.net/10/4065/2010/
W. T. Morgan et al.: Aerosol chemical composition measurements across Europe regional non-refractory particulate mass burden. Consideration of OM and ammonium nitrate in modelling assessments of the impact of atmospheric aerosol in Europe is evidently required. The measurements presented here provide a useful test for regional and global aerosol models, due to the contrasting distributions of the OM components and inorganic components across the significant spatial and temporal scales sampled. A positive matrix factorisation analysis of the OM component was conducted, revealing the dominance of Oxidised Organic Aerosol (OOA) over Hydrocarbon-like Organic Aerosol (HOA), which is consistent with previous literature (Zhang et al., 2007). This dominance meant that the HOA component was difficult to separate from the OOA in a robust manner across the dataset. An empirical estimate based upon previous research indicated that HOA contributes less than 15% to the OM burden. Two factor solutions were found to be the most robust characterisation of the OM burden. Two separate OOA components were identified; one representing an aged-more oxidised organic aerosol and another representing fresher-less oxidised organic aerosol. These factors closely resemble those derived in ground-based global AMS datasets (Jimenez et al., 2009; Ng et al., 2009) where the less oxidised factor is associated with Semi-Volatile OOA (SV-OOA) and the more oxidised factor is found in the Low-Volatility OOA (LV-OOA) fraction. The OM chemical composition and the associated OOA factors derived for each flight were highly variable in terms of their oxygen content, based upon normalised organic signal intensities at m/z 44 and 43. When combined, the OM data and factors can be viewed as a continuum with a progression from a less oxidised, more-volatile component to a highly oxidised, less-volatile component. This progression was observed to occur as a function of the distance from source, with more oxidised components dominating further downwind. During highly polluted conditions in NorthWestern Europe, the SV-OOA displayed strong coupling to ammonium nitrate, indicative of gas-to-particle partitioning of semi-volatile components. Highly active photochemical conditions encountered during the study meant that LV-OOA was the largest OM component at all locations and this dominance increased with distance from source. In background conditions, LV-OOA made up more than 80% of the OM burden. This evolution is consistent with the recent paradigm proposed by Jimenez et al. (2009). The processes identified in this work result in the build up of significant amounts of anthropogenically influenced aerosol downwind of major source regions with total submicron mass loadings from the AMS exceeding 15 µg sm−3 with OM and ammonium nitrate being the dominant chemical components. Such concentrations have the capacity to significantly perturb regional weather and climate.
www.atmos-chem-phys.net/10/4065/2010/
4079
Acknowledgements. This work is supported by NERC ADIENT project NE/E011101/1 and EUCAARI project 036833-2. W. T. Morgan was supported by a Natural Environment Research Council (NERC) studentship NER/S/A/2006/14040 and a CASE sponsorship from Aerodyne Research Inc. The NERC National Centre for Atmospheric Science (NCAS) Facility for Ground based Atmospheric Measurements (FGAM) supported the maintenance of the cToF-AMS. NCAS also supported the development of the data interpretation methods employed here through its Composition Directorate. Many thanks to Ingrid Ulbrich (University of Colorado at Boulder, USA) for providing and supporting the PMF toolkit. Thanks to the British Atmospheric Data Centre (BADC) for the calculation of trajectories and access to European Centre for Medium-Range Weather Forecasts (ECMWF) Operational Analysis data, available from http://badc.nerc.ac.uk/data/ecmwf-op/. We thank A. M. Middlebrook for the AMS collection efficiency algorithm. We also thank F. Abicht, C. L. McConnell, A. Minikin, T. Hamburger and A. Stohl for their major contributions to the project. We thank the FAAM, the Met Office, Avalon, DLR-Falcon and DirectFlight personnel for their contributions to the campaign. In memory of Keith Drummond, without whom the flying circus would never have got off the ground. Edited by: O. Hov
References Aiken, A. C., Decarlo, P. F., Kroll, J. H., Worsnop, D. R., Huffman, J. A., Docherty, K. S., Ulbrich, I. M., Mohr, C., Kimmel, J. R., Sueper, D., Sun, Y., Zhang, Q., Trimborn, A., Northway, M., Ziemann, P. J., Canagaratna, M. R., Onasch, T. B., Alfarra, M. R., Prevot, A. S. H., Dommen, J., Duplissy, J., Metzger, A., Baltensperger, U., and Jimenez, J. L.: O/C and OM/OC ratios of primary, secondary, and ambient organic aerosols with high-resolution time-of-flight aerosol mass spectrometry, Environ. Sci. Technol., 42, 4478–4485, 2008. Aiken, A. C., Salcedo, D., Cubison, M. J., Huffman, J. A., DeCarlo, P. F., Ulbrich, I. M., Docherty, K. S., Sueper, D., Kimmel, J. R., Worsnop, D. R., Trimborn, A., Northway, M., Stone, E. A., Schauer, J. J., Volkamer, R. M., Fortner, E., de Foy, B., Wang, J., Laskin, A., Shutthanandan, V., Zheng, J., Zhang, R., Gaffney, J., Marley, N. A., Paredes-Miranda, G., Arnott, W. P., Molina, L. T., Sosa, G., and Jimenez, J. L.: Mexico City aerosol analysis during MILAGRO using high resolution aerosol mass spectrometry at the urban supersite (T0) – Part 1: Fine particle composition and organic source apportionment, Atmos. Chem. Phys., 9, 6633– 6653, 2009, http://www.atmos-chem-phys.net/9/6633/2009/. Alfarra, M. R., Coe, H., Allan, J. D., Bower, K. N., Boudries, H., Canagaratna, M. R., Jimenez, J. L., Jayne, J. T., Garforth, A. A., Li, S. M., and Worsnop, D. R.: Characterization of urban and rural organic particulate in the lower Fraser valley using two aerodyne aerosol mass spectrometers, Atmos. Environ., 38, 5745– 5758, 2004. Allan, J., Jimenez, J., Williams, P., Alfarra, M., Bower, K., Jayne, J., Coe, H., and Worsnop, D.: Quantitative sampling using an Aerodyne aerosol mass spectrometer: 1. Techniques of data interpretation and error analysis, J. Geophys. Res.-Atmos., 108, 4090, doi:10.1029/2003JD001607, 2003.
Atmos. Chem. Phys., 10, 4065–4083, 2010
4080
W. T. Morgan et al.: Aerosol chemical composition measurements across Europe
Allan, J. D., Delia, A. E., Coe, H., Bower, K. N., Alfarra, M. R., Jimenez, J. L., Middlebrook, A. M., Drewnick, F., Onasch, T. B., Canagaratna, M. R., Jayne, J. T., and Worsnop, D. R.: A generalised method for the extraction of chemically resolved mass spectra from aerodyne aerosol mass spectrometer data, J. Aerosol Sci., 35, 909–922, 2004. Andreae, M. and Crutzen, P.: Atmospheric aerosols: Biogeochemical sources and role in atmospheric chemistry, Science, 276, 1052–1058, 1997. Bahreini, R., Ervens, B., Middlebrook, A. M., Warneke, C., de Gouw, J. A., DeCarlo, P. F., Jimenez, J. L., Brock, C. A., Neuman, J. A., Ryerson, T. B., Stark, H., Atlas, E., Brioude, J., Fried, A., Holloway, J. S., Peischl, J., Richter, D., Walega, J., Weibring, P., Wollny, A. G., and Fehsenfeld, F. C.: Organic aerosol formation in urban and industrial plumes near Houston and Dallas, Texas, J. Geophys. Res., 114, D00F16, doi: 10.1029/2008JD011493, 2009. Bates, T. S., Quinn, P. K., Coffman, D. J., Johnson, J. E., and Middlebrook, A. M.: Dominance of organic aerosols in the marine boundary layer over the Gulf of Maine during NEAQS 2002 and their role in aerosol light scattering, J. Geophys. Res.-Atmos., 110, doi:10.1029/2005JD005797, d18202, 2005. Baumgardner, D., Kok, G., and Raga, G.: Warming of the Arctic lower stratosphere by light absorbing particles, Geophys. Res. Lett., 31, l06117, doi:10.1029/2003GL018883, 2004. Baumgardner, D., Grutter, M., Allan, J., Ochoa, C., Rappenglueck, B., Russell, L. M., and Arnott, P.: Physical and chemical properties of the regional mixed layer of Mexico’s Megapolis, Atmos. Chem. Phys., 9, 5711–5727, 2009, http://www.atmos-chem-phys.net/9/5711/2009/. Bench, G., Fallon, S., Schichtel, B., Malm, W., and McDade, C.: Relative contributions of fossil and contemporary carbon sources to PM2.5 aerosols at nine Interagency Monitoring for Protection of Visual Environments (IMPROVE) network sites, J. Geophys. Res., 112, D10205, doi:10.1029/2006JD007708, 2007. Brock, C. A., Sullivan, A. P., Peltier, R. E., Weber, R. J., Wollny, A., Gouw, J. A., Middlebrook, A. M., Atlas, E. L., Stohl, A., Trainer, M. K., Cooper, O. R., Fehsenfeld, F. C., Frost, G. J., Holloway, J. S., Hubler, G., Neuman, J. A., Ryerson, T. B., Warneke, C., and Wilson, J. C.: Sources of particulate matter in the northeastern United States in summer: 2. Evolution of chemical and microphysical properties, J. Geophys. Res.-Atmos., 113, d08302, doi:10.1029/2007JD009241, 2008. Canagaratna, M. R., Jayne, J. T., Jimenez, J. L., Allan, J. D., Alfarra, M. R., Zhang, Q., Onasch, T. B., Drewnick, F., Coe, H., Middlebrook, A., Delia, A., Williams, L. R., Trimborn, A. M., Northway, M. J., DeCarlo, P. F., Kolb, C. E., Davidovits, P., and Worsnop, D. R.: Chemical and microphysical characterization of ambient aerosols with the aerodyne aerosol mass spectrometer, Mass Spectrometry Reviews, 26, 185–222, 2007. Capes, G., Johnson, B., McFiggans, G., Williams, P. I., Haywood, J., and Coe, H.: Aging of biomass burning aerosols over West Africa: Aircraft measurements of chemical composition, microphysical properties, and emission ratios, J. Geophys. Res.Atmos., 113, D00C15cro, doi:10.1029/2008JD009845, 2008. Charlson, R. J., Schwartz, S. E., Hales, J. M., Cess, R. D., Coakley, J. A., Hansen, J. E., and Hofmann, D. J.: Climate Forcing by Anthropogenic Aerosols, Science, 255, 423–430, 1992. Crosier, J., Allan, J. D., Coe, H., Bower, K. N., Formenti, P., and
Atmos. Chem. Phys., 10, 4065–4083, 2010
Williams, P. I.: Chemical composition of summertime aerosol in the Po Valley (Italy), northern Adriatic and Black Sea, Q. J. Roy. Meteorol. Soc., 133, 61–75, 2007. Cross, E. S., Slowik, J. G., Davidovits, P., Allan, J. D., Worsnop, D. R., Jayne, J. T., Lewis, D. K., Canagaratna, M., and Onasch, T. B.: Laboratory and Ambient Particle Density Determinations using Light Scattering in Conjunction with Aerosol Mass Spectrometry, Aerosol Sci. Technol., 41, 343–359, 2007. De Gouw, J. and Jimenez, J. L.: Organic Aerosols in the Earth’s Atmosphere, Environ. Sci. Technol., 43, 7614–7618, doi:10.1021/ es9006004, 2009. de Gouw, J., Middlebrook, A., Warneke, C., Goldan, P., Kuster, W., Roberts, J., Fehsenfeld, F., Worsnop, D., Canagaratna, M., Pszenny, A., Keene, W., Marchewka, M., Bertman, S., and Bates, T.: Budget of organic carbon in a polluted atmosphere: Results from the New England Air Quality Study in 2002, J. Geophys. Res.-Atmos., 110, D16305, doi:10.1029/2004JD005623, 2005. de Gouw, J. A., Brock, C. A., Atlas, E. L., Bates, T. S., Fehsenfeld, F. C., Goldan, P. D., Holloway, J. S., Kuster, W. C., Lerner, B. M., Matthew, B. M., Middlebrook, A. M., Onasch, T. B., Peltier, R. E., Quinn, P. K., Senff, C. J., Stohl, A., Sullivan, A. P., Trainer, M., Warneke, C., Weber, R. J., and Williams, E. J.: Sources of particulate matter in the northeastern United States in summer: 1. Direct emissions and secondary formation of organic matter in urban plumes, J. Geophys. Res.-Atmos., 113, D08301, doi: 10.1029/2007JD009243, 2008. DeCarlo, P. F., Kimmel, J. R., Trimborn, A., Northway, M. J., Jayne, J. T., Aiken, A. C., Gonin, M., Fuhrer, K., Horvath, T., Docherty, K. S., Worsnop, D. R., and Jimenez, J. L.: Field-deployable, high-resolution, time-of-flight aerosol mass spectrometer, Anal. Chem., 78, 8281–8289, 2006. Denman, K., Brasseur, G., Chidthaisong, A., Ciais, P., Cox, P., Dickinson, R., Hauglustaine, D., Heinze, C., Holland, E., Jacob, D., Lohmann, U., Ramachandran, S., Dias, P. d. S., Wofsy, S., and Zhang, X.: Couplings Between Changes in the Climate System and Biogeochemistry, Climate Change 2007: The Physical Science Basis. Contribution of Working Group I to the Fourth Assessment Report of the Intergovernmental Panel on Climate Change, Cambridge University Press, Cambridge, United Kingdom and New York, NY, USA, 2007. Docherty, K. S., Stone, E. A., Ulbrich, I. M., DeCarlo, P. F., Snyder, D. C., Schauer, J. J., Peltier, R. E., Weber, R. J., Murphy, S. N., Seinfeld, J. H., Grover, B. D., Eatough, D. J., and Jiimenez, J. L.: Apportionment of Primary and Secondary Organic Aerosols in Southern California during the 2005 Study of Organic Aerosols in Riverside (SOAR-1), Environ. Sci. Technol., 42, 7655–7662, 2008. Donahue, N. M., Robinson, A. L., Stanier, C. O., and Pandis, S. N.: Coupled partitioning, dilution, and chemical aging of semivolatile organics, Environ. Sci. Technol., 40, 2635–2643, 2006. Donahue, N. M., Robinson, A. L., and Pandis, S. N.: Atmospheric organic particulate matter: From smoke to secondary organic aerosol, Atmos. Environ., 43, 94–106, 2009. Drewnick, F., Hings, S. S., DeCarlo, P., Jayne, J. T., Gonin, M., Fuhrer, K., Weimer, S., Jimenez, J. L., Demerjian, K. L., Borrmann, S., and Worsnop, D. R.: A new time-of-flight aerosol mass spectrometer (TOF-AMS) - Instrument description and first field deployment, Aerosol Sci. Technol., 39, 637–658, 2005.
www.atmos-chem-phys.net/10/4065/2010/
W. T. Morgan et al.: Aerosol chemical composition measurements across Europe Esselborn, M., Wirth, M., Fix, A., Tesche, M., and Ehret, G.: Airborne high spectral resolution lidar for measuring aerosol extinction and backscatter coefficients, Appl. Optics, 47, 346–358, 2008. Fast, J., Aiken, A. C., Allan, J., Alexander, L., Campos, T., Canagaratna, M. R., Chapman, E., DeCarlo, P. F., de Foy, B., Gaffney, J., de Gouw, J., Doran, J. C., Emmons, L., Hodzic, A., Herndon, S. C., Huey, G., Jayne, J. T., Jimenez, J. L., Kleinman, L., Kuster, W., Marley, N., Russell, L., Ochoa, C., Onasch, T. B., Pekour, M., Song, C., Ulbrich, I. M., Warneke, C., WelshBon, D., Wiedinmyer, C., Worsnop, D. R., Yu, X.-Y., and Zaveri, R.: Evaluating simulated primary anthropogenic and biomass burning organic aerosols during MILAGRO: implications for assessing treatments of secondary organic aerosols, Atmos. Chem. Phys., 9, 6191–6215, 2009, http://www.atmos-chem-phys.net/9/6191/2009/. Foltescu, V. L., Selin, E., and Below, M.: Corrections for Particle Losses and Sizing Errors During Aircraft Aerosol Sampling Using a Rosemount Inlet and the Pms Las-X, Atmos. Environ., 29, 449–453, 1995. Forster, P., Ramaswamy, V., Artaxo, P., Berntsen, T., Betts, R., W. Fahey, D., Haywood, J., Lean, J., Lowe, D., Myhre, G., Nganga, J., Prinn, R., Raga, G., Schulz, M., and Van Dorland, R.: Changes in Atmospheric Constituents and in Radiative Forcing, Climate Change 2007: The Physical Science Basis. Contribution of Working Group I to the Fourth Assessment Report of the Intergovernmental Panel on Climate Change, Cambridge University Press, Cambridge, United Kingdom and New York, NY, USA, 2007. Gao, R. S., Schwarz, J. P., Kelly, K. K., Fahey, D. W., Watts, L. A., Thompson, T. L., Spackman, J. R., Slowik, J. G., Cross, E. S., Han, J. H., Davidovits, P., Onasch, T. B., and Worsnop, D. R.: A novel method for estimating light-scattering properties of soot aerosols using a modified single-particle soot photometer, Aerosol Sci. Technol., 41, 125–135, 2007. Gelencs´er, A., May, B., Simpson, D., S´anchez-Ochoa, A., KasperGiebl, A., Puxbaum, H., Caseiro, A., Pio, C., and Legrand, M.: Source apportionment of PM2.5 organic aerosol over Europe: Primary/secondary, natural/anthropogenic, and fossil/biogenic origin, J. Geophys. Res.-Atmos., 112, D23S04, doi:10.1029/ 2006JD008094, 2007. Goldstein, A. H., Koven, C. D., Heald, C. L., and Fung, I. Y.: Biogenic carbon and anthropogenic pollutants combine to form a cooling haze over the southeastern United States, Proceedings of the National Academy of Sciences, 106, 8835–8840, 2009. Hallar, A. G., Strawa, A. W., Schmid, B., Andrews, E., Ogren, J., Sheridan, P., Ferrare, R., Covert, D., Elleman, R., Jonsson, H., Bokarius, K., and Luu, A.: Atmospheric Radiation Measurements Aerosol Intensive Operating Period: Comparison of aerosol scattering during coordinated flights, J. Geophys. Res., 111, D05S09, doi:10.1029/2005JD006250, 2006. Haywood, J. and Boucher, O.: Estimates of the direct and indirect radiative forcing due to tropospheric aerosols: A review, Rev. Geophys., 38, 513–543, 2000. Huffman, J. A., Jayne, J. T., Drewnick, F., Aiken, A. C., Onasch, T., Worsnop, D. R., and Jimenez, J. L.: Design, modeling, optimization, and experimental tests of a particle beam width probe for the aerodyne aerosol mass spectrometer, Aerosol Sci. Technol., 39, 1143–1163, 2005.
www.atmos-chem-phys.net/10/4065/2010/
4081
Huffman, J. A., Docherty, K. S., Aiken, A. C., Cubison, M. J., Ulbrich, I. M., DeCarlo, P. F., Sueper, D., Jayne, J. T., Worsnop, D. R., Ziemann, P. J., and Jimenez, J. L.: Chemically-resolved aerosol volatility measurements from two megacity field studies, Atmos. Chem. Phys., 9, 7161–7182, 2009, http://www.atmos-chem-phys.net/9/7161/2009/. Jayne, J. T., Leard, D. C., Zhang, X. F., Davidovits, P., Smith, K. A., Kolb, C. E., and Worsnop, D. R.: Development of an aerosol mass spectrometer for size and composition analysis of submicron particles, Aerosol Sci. Technol., 33, 49–70, 2000. Jimenez, J. L., Canagaratna, M. R., Donahue, N. M., Prevot, A. S. H., Zhang, Q., Kroll, J. H., DeCarlo, P. F., Allan, J. D., Coe, H., Ng, N. L., Aiken, A. C., Docherty, K. S., Ulbrich, I. M., Grieshop, A. P., Robinson, A. L., Duplissy, J., Smith, J. D., Wilson, K. R., Lanz, V. A., Hueglin, C., Sun, Y. L., Tian, J., Laaksonen, A., Raatikainen, T., Rautiainen, J., Vaattovaara, P., Ehn, M., Kulmala, M., Tomlinson, J. M., Collins, D. R., Cubison, M. J., E., Dunlea, J., Huffman, J. A., Onasch, T. B., Alfarra, M. R., Williams, P. I., Bower, K., Kondo, Y., Schneider, J., Drewnick, F., Borrmann, S., Weimer, S., Demerjian, K., Salcedo, D., Cottrell, L., Griffin, R., Takami, A., Miyoshi, T., Hatakeyama, S., Shimono, A., Sun, J. Y., Zhang, Y. M., Dzepina, K., Kimmel, J. R., Sueper, D., Jayne, J. T., Herndon, S. C., Trimborn, A. M., Williams, L. R., Wood, E. C., Middlebrook, A. M., Kolb, C. E., Baltensperger, U., and Worsnop, D. R.: Evolution of Organic Aerosols in the Atmosphere, Science, 326, 1525–1529, doi:10.1126/science.1180353, 2009. Kleinman, L. I., Daum, P. H., Lee, Y. N., Senum, G. I., Springston, S. R., Wang, J., Berkowitz, C., Hubbe, J., Zaveri, R. A., Brechtel, F. J., Jayne, J., Onasch, T. B., and Worsnop, D.: Aircraft observations of aerosol composition and ageing in New England and Mid-Atlantic States during the summer 2002 New England Air Quality Study field campaign, J. Geophys. Res.-Atmos., 112, D09310, doi:10.1029/2006JD007786, 2007. Kleinman, L. I., Springston, S. R., Daum, P. H., Lee, Y.-N., Nunnermacker, L. J., Senum, G. I., Wang, J., Weinstein-Lloyd, J., Alexander, M. L., Hubbe, J., Ortega, J., Canagaratna, M. R., and Jayne, J.: The time evolution of aerosol composition over the Mexico City plateau, Atmos. Chem. Phys., 8, 1559–1575, 2008, http://www.atmos-chem-phys.net/8/1559/2008/. Kulmala, M., Asmi, A., Lappalainen, H. K., Carslaw, K. S., P¨oschl, U., Baltensperger, U., Hov, Ø., Brenquier, J.-L., Pandis, S. N., Facchini, M. C., Hansson, H.-C., Wiedensohler, A., and O’Dowd, C. D.: Introduction: European Integrated Project on Aerosol Cloud Climate and Air Quality interactions (EUCAARI) – integrating aerosol research from nano to global scales, Atmos. Chem. Phys., 9, 2825–2841, 2009, http://www.atmos-chem-phys.net/9/2825/2009/. Lanz, V. A., Alfarra, M. R., Baltensperger, U., Buchmann, B., Hueglin, C., and Pr´evˆot, A. S. H.: Source apportionment of submicron organic aerosols at an urban site by factor analytical modelling of aerosol mass spectra, Atmos. Chem. Phys., 7, 1503– 1522, 2007, http://www.atmos-chem-phys.net/7/1503/2007/. Lanz, V. A., Alfarra, M. R., Baltensperger, U., Buchmann, B., Hueglin, C., Szidat, S., Wehrli, M. N., Wacker, L., Weimer, S., Caseiro, A., Puxbaum, H., and Prevot, A. S. H.: Source attribution of submicron organic aerosols during wintertime inversions by advanced factor analysis of aerosol mass spectra, Environ.
Atmos. Chem. Phys., 10, 4065–4083, 2010
4082
W. T. Morgan et al.: Aerosol chemical composition measurements across Europe
Sci. Technol., 42, 214–220, 2008. Liu, P. S. K., Leaitch, W. R., Strapp, J. W., and Wasey, M. A.: Response of Particle Measuring Systems Airborne ASASP and PCASP to Nacl and Latex-Particles, Aerosol Sci. Technol., 16, 83–95, 1992. Matthew, B. M., Middlebrook, A. M., and Onasch, T. B.: Collection efficiencies in an Aerodyne Aerosol Mass Spectrometer as a function of particle phase for laboratory generated aerosols, Aerosol Sci. Technol., 42, 884–898, 2008. McFiggans, G., Alfarra, M. R., Allan, J., Bower, K., Coe, H., Cubison, M., Topping, D., Williams, P., Decesari, S., Facchini, C., and Fuzzi, S.: Simplification of the representation of the organic component of atmospheric particulates, Faraday Discussions, 130, 341–362, 2005. Mohr, C., Huffman, J. A., Cubison, M. J., Aiken, A. C., Docherty, K. S., Kimmel, J. R., Ulbrich, I. M., Hannigan, M., and Jimenez, J. L.: Characterization of Primary Organic Aerosol Emissions from Meat Cooking, Trash Burning, and Motor Vehicles with High-Resolution Aerosol Mass Spectrometry and Comparison with Ambient and Chamber Observations, Environ. Sci. Technol., 43, 2443–2449, 2009. Moore, K. G., I., Clarke, A. D., Kapustin, V. N., McNaughton, C., Anderson, B. E., Winstead, E. L., Weber, R., Ma, Y., Lee, Y. N., Talbot, R., Dibb, J., Anderson, T., Doherty, S., Covert, D., and Rogers, D.: A comparison of similar aerosol measurements made on the NASA P3-B, DC-8, and NSF C-130 aircraft during TRACE-P and ACE-Asia, J. Geophys. Res., 109, D15S15, doi:10.1029/2003JD003543, 2004. Morgan, W. T., Allan, J. D., Bower, K. N., Capes, G., Crosier, J., Williams, P. I., and Coe, H.: Vertical distribution of sub-micron aerosol chemical composition from North-Western Europe and the North-East Atlantic, Atmos. Chem. Phys., 9, 5389–5401, 2009, http://www.atmos-chem-phys.net/9/5389/2009/. Morgan, W. T., Allan, J. D., Bower, K. N., Esselborn, M., Harris, B., Henzing, J. S., Highwood, E. J., Kiendler-Scharr, A., McMeeking, G. R., Mensah, A. A., Northway, M. J., Osborne, S., Williams, P. I., Krejci, R., and Coe, H.: Enhancement of the aerosol direct radiative effect by semi-volatile aerosol components: airborne measurements in North-Western Europe, Atmos. Chem. Phys. Discuss., 10, 10653–10705, 2010, http://www.atmos-chem-phys-discuss.net/10/10653/2010/. Morino, Y., Kondo, Y., Takegawa, N., Miyazaki, Y., Kita, K., Komazaki, Y., Fukuda, M., Miyakawa, T., Moteki, N., and Worsnop, D. R.: Partitioning of HNO3 and particulate nitrate over Tokyo: Effect of vertical mixing, J. Geophys. Res.-Atmos., 111, D15215, doi:10.1029/2005JD006887, d15215, 2006. Neuman, J. A., Nowak, J. B., Zheng, W., Flocke, F., Ryerson, T. B., Trainer, M., Holloway, J. S., Parrish, D. D., Frost, G. J., Peischl, J., Atlas, E. L., Bahreini, R., Wollny, A. G., and Fehsenfeld, F. C.: Relationship between photochemical ozone production and NOx oxidation in Houston, Texas, J. Geophys. Res., 114, D00F08, doi:10.1029/2008JD011688, 2009. Ng, N. L., Canagaratna, M. R., Zhang, Q., Jimenez, J. L., Tian, J., Ulbrich, I. M., Kroll, J. H., Docherty, K. S., Chhabra, P. S., Bahreini, R., Murphy, S. M., Seinfeld, J. H., Hildebrandt, L., DeCarlo, P. F., Lanz, V. A., Prevot, A. S. H., Dinar, E., Rudich, Y., and Worsnop, D. R.: Organic aerosol components observed in worldwide datasets from aerosol mass spectrometry, Atmos.
Atmos. Chem. Phys., 10, 4065–4083, 2010
Chem. Phys. Discuss., 9, 27745–27789, 2009, http://www.atmos-chem-phys-discuss.net/9/27745/2009/. Osborne, S. R., Haywood, J. M., and Bellouin, N.: In situ and remote-sensing measurements of the mean microphysical and optical properties of industrial pollution aerosol during ADRIEX, Qu. J. Roy. Meteorol. Soc., 133, 17–32, 2007. Paatero, P.: Least squares formulation of robust non-negative factor analysis, Chemometrics and Intelligent Laboratory Systems, 37, 23–35, 1997. Paatero, P. and Tapper, U.: Positive Matrix Factorization – a Nonnegative Factor Model with Optimal Utilization of ErrorEstimates of Data Values, Environmetrics, 5, 111–126, 1994. Parrish, D. D., Allen, D. T., Bates, T. S., Estes, M., Fehsenfeld, F. C., Feingold, G., Ferrare, R., Hardesty, R. M., Meagher, J. F., Nielsen-Gammon, J. W., Pierce, R. B., Ryerson, T. B., Seinfeld, J. H., and Williams, E. J.: Overview of the Second Texas Air Quality Study (TexAQS II) and the Gulf of Mexico Atmospheric Composition and Climate Study (GoMACCS), J. Geophys. Res., 114, D00F13, doi:10.1029/2009JD011842, 2009. Putaud, J.-P., Raes, F., Dingenen, R. V., Br¨uggemann, E., Facchini, M. C., Decesari, S., Fuzzi, S., Gehrig, R., H¨uglin, C., Laj, P., Lorbeer, G., Maenhaut, W., Mihalopoulos, N., M¨uller, K., Querol, X., Rodriguez, S., Schneider, J., Spindler, G., ten Brink, H., Tørseth, K., and Wiedensohler, A.: A European aerosol phenomenology – 2: chemical characteristics of particulate matter at kerbside, urban, rural and background sites in Europe, Atmos. Environ., 38, 2579–2595, 2004. Quinn, P. K., Bates, T. S., Coffman, D., Onasch, T. B., Worsnop, D., Baynard, T., de Gouw, J. A., Goldan, P. D., Kuster, W. C., Williams, E., Roberts, J. M., Lerner, B., Stohl, A., Pettersson, A., and Lovejoy, E. R.: Impacts of sources and aging on submicrometer aerosol properties in the marine boundary layer across the Gulf of Maine, J. Geophys. Res.-Atmos., 111, d23S36, doi: 10.1029/2006JD007582, 2006. Ramanathan, V., Crutzen, P. J., Lelieveld, J., Mitra, A. P., Althausen, D., Anderson, J., Andreae, M. O., Cantrell, W., Cass, G. R., Chung, C. E., Clarke, A. D., Coakley, J. A., Collins, W. D., Conant, W. C., Dulac, F., Heintzenberg, J., Heymsfield, A. J., Holben, B., Howell, S., Hudson, J., Jayaraman, A., Kiehl, J. T., Krishnamurti, T. N., Lubin, D., McFarquhar, G., Novakov, T., Ogren, J. A., Podgorny, I. A., Prather, K., Priestley, K., Prospero, J. M., Quinn, P. K., Rajeev, K., Rasch, P., Rupert, S., Sadourny, R., Satheesh, S. K., Shaw, G. E., Sheridan, P., and Valero, F. P. J.: Indian Ocean Experiment: An integrated analysis of the climate forcing and effects of the great Indo-Asian haze, J. Geophys. Res.-Atmos., 106, 28371–28398, 2001. Reis, S., Pinder, R. W., Zhang, M., Lijie, G., and Sutton, M. A.: Reactive nitrogen in atmospheric emission inventories, Atmos. Chem. Phys., 9, 7657–7677, 2009, http://www.atmos-chem-phys.net/9/7657/2009/. Robinson, A. L., Donahue, N. M., Shrivastava, M. K., Weitkamp, E. A., Sage, A. M., Grieshop, A. P., Lane, T. E., Pierce, J. R., and Pandis, S. N.: Rethinking organic aerosols: Semivolatile emissions and photochemical aging, Science, 315, 1259–1262, 2007. Rudich, Y., Donahue, N. M., and Mentel, T. F.: Aging of organic aerosol: Bridging the gap between laboratory and field studies, Ann. Rev. Phys. Chem., 58, 321–352, 2007. Stephens, M., Turner, N., and Sandberg, J.: Particle identification by laser-induced incandescence in a solid-state laser cavity, Appl.
www.atmos-chem-phys.net/10/4065/2010/
W. T. Morgan et al.: Aerosol chemical composition measurements across Europe Optics, 42, 3726–3736, 2003. Strapp, J. W., Leaitch, W. R., and Liu, P. S. K.: Hydrated and Dried Aerosol-Size-Distribution Measurements from the Particle Measuring Systems FSSP-300 Probe and the Deiced PCASP-100x Probe, J. Atmos. Oceanic Technol., 9, 548–555, 1992. Szidat, S., Jenk, T. M., Synal, H.-A., Kalberer, M., Wacker, L., Hajdas, I., Kasper-Giebl, A., and Baltensperger, U.: Contributions of fossil fuel, biomass-burning, and biogenic emissions to carbonaceous aerosols in Zurich as traced by 14 C, J. Geophys. Res., 111, D07206, doi:10.1029/2005JD006590, 2006. Szidat, S., Ruff, M., Perron, N., Wacker, L., Synal, H.-A., Hallquist, M., Shannigrahi, A. S., Yttri, K. E., Dye, C., and Simpson, D.: Fossil and non-fossil sources of organic carbon (OC) and elemental carbon (EC) in Gteborg, Sweden, Atmos. Chem. Phys., 9, 1521–1535, 2009, http://www.atmos-chem-phys.net/9/1521/2009/. Ulbrich, I. M., Canagaratna, M. R., Zhang, Q., Worsnop, D. R., and Jimenez, J. L.: Interpretation of organic components from Positive Matrix Factorization of aerosol mass spectrometric data, Atmos. Chem. Phys., 9, 2891–2918, 2009, http://www.atmos-chem-phys.net/9/2891/2009/. Volkamer, R., Jimenez, J. L., San Martini, F., Dzepina, K., Zhang, Q., Salcedo, D., Molina, L. T., Worsnop, D. R., and Molina, M. J.: Secondary organic aerosol formation from anthropogenic air pollution: Rapid and higher than expected, Geophys. Res. Lett., 33, L17811, doi:10.1029/2006GL026899, 2006. Wang, W., Rood, M. J., Carrico, C. M., Covert, D. S., Quinn, P. K., and Bates, T. S.: Aerosol optical properties along the northeast coast of North America during the New England Air Quality Study – Intercontinental Transport and Chemical Transformation 2004 campaign and the influence of aerosol composition, J. Geophys. Res.-Atmos., 112, D10S23, doi:10.1029/2006JD007579, 2007.
www.atmos-chem-phys.net/10/4065/2010/
4083
Weber, R. J., Sullivan, A. P., Peltier, R. E., Russell, A., Yan, B., Zheng, M., de Gouw, J., Warneke, C., Brock, C., Holloway, J. S., Atlas, E. L., and Edgerton, E.: A study of secondary organic aerosol formation in the anthropogenic-influenced southeastern United States, J. Geophys. Res., 112, D13302, doi: 10.1029/2007JD008408, 2007. Williams, B. J., Goldstein, A. H., Millet, D. B., Holzinger, R., Kreisberg, N. M., Hering, S. V., White, A. B., Worsnop, D. R., Allan, J. D., and Jimenez, J. L.: Chemical speciation of organic aerosol during the International Consortium for Atmospheric Research on Transport and Transformation 2004: Results from in situ measurements, J. Geophys. Res.-Atmos., 112, D10S26, doi: 10.1029/2006JD007601, 2007. Zhang, Q., Alfarra, M. R., Worsnop, D. R., Allan, J. D., Coe, H., Canagaratna, M. R., and Jimenez, J. L.: Deconvolution and quantification of hydrocarbon-like and oxygenated organic aerosols based on aerosol mass spectrometry, Environ. Sci. Technol., 39, 4938–4952, doi:10.1029/2007GL029979,, 2005a. Zhang, Q., Worsnop, D. R., Canagaratna, M. R., and Jimenez, J. L.: Hydrocarbon-like and oxygenated organic aerosols in Pittsburgh: insights into sources and processes of organic aerosols, Atmos. Chem. Phys., 5, 3289-3311, 2005b, http://www.atmos-chem-phys.net/5/3289/2005/. Zhang, Q., Jimenez, J. L., Canagaratna, M. R., Allan, J. D., Coe, H., Ulbrich, I., Alfarra, M. R., Takami, A., Middlebrook, A. M., Sun, Y. L., Dzepina, K., Dunlea, E., Docherty, K., DeCarlo, P. F., Salcedo, D., Onasch, T., Jayne, J. T., Miyoshi, T., Shimono, A., Hatakeyama, S., Takegawa, N., Kondo, Y., Schneider, J., Drewnick, F., Borrmann, S., Weimer, S., Demerjian, K., Williams, P., Bower, K., Bahreini, R., Cottrell, L., Griffin, R. J., Rautiainen, J., Sun, J. Y., Zhang, Y. M., and Worsnop, D. R.: Ubiquity and dominance of oxygenated species in organic aerosols in anthropogenically-influenced Northern Hemisphere midlatitudes, Geophys. Res. Lett., 34, L13801, doi:10. 1029/2007GL029979, 2007.
Atmos. Chem. Phys., 10, 4065–4083, 2010